. 2022 Jul 7:15:913328.
doi: 10.3389/fnmol.2022.913328. eCollection 2022.

Identification of Candidate Genes Associated With Prognosis in Glioblastoma

Affiliations

Identification of Candidate Genes Associated With Prognosis in Glioblastoma

Rongjie Li et al. Front Mol Neurosci. .

Abstract

Background: Glioblastoma (GBM) is the most common malignant primary brain tumor, which associated with extremely poor prognosis.

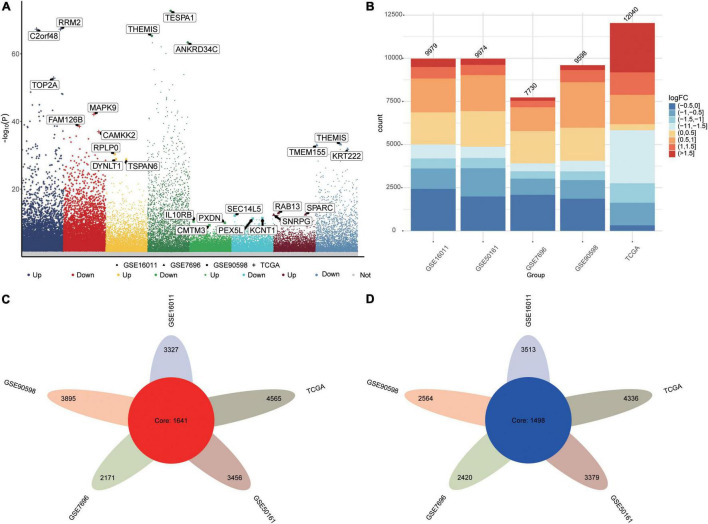
Methods: Data from datasets GSE16011, GSE7696, GSE50161, GSE90598 and The Cancer Genome Atlas (TCGA) were analyzed to identify differentially expressed genes (DEGs) between patients and controls. DEGs common to all five datasets were analyzed for functional enrichment and for association with overall survival using Cox regression. Candidate genes were further screened using least absolute shrinkage and selection operator (LASSO) and random forest algorithms, and the effects of candidate genes on prognosis were explored using a Gaussian mixed model, a risk model, and concordance cluster analysis. We also characterized the GBM landscape of immune cell infiltration, methylation, and somatic mutations.

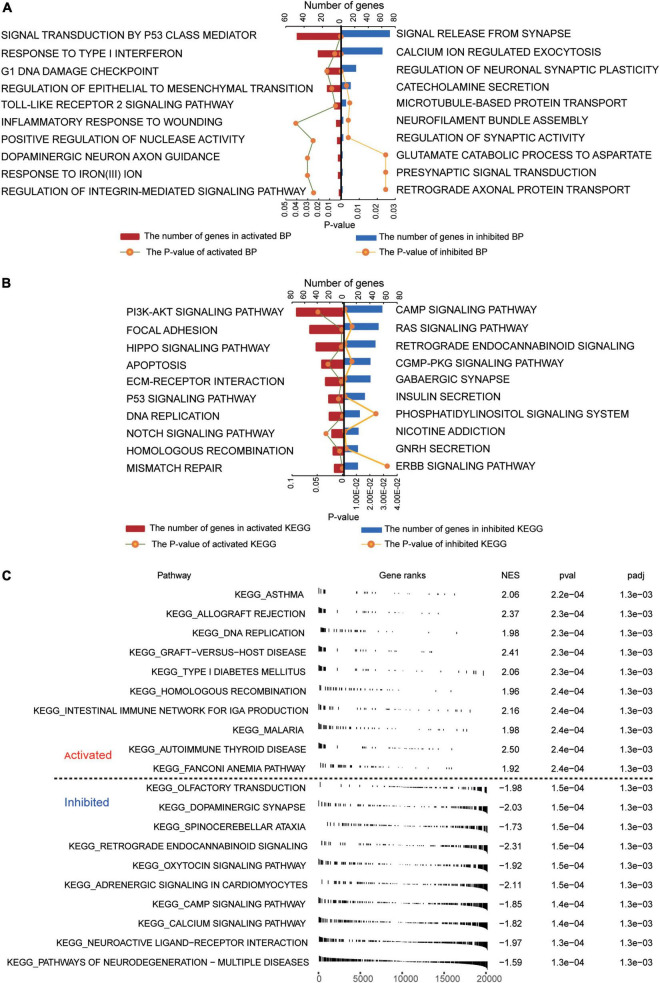
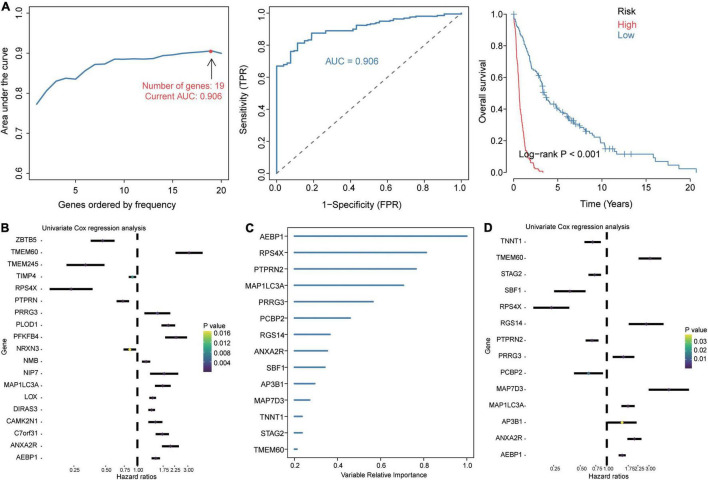
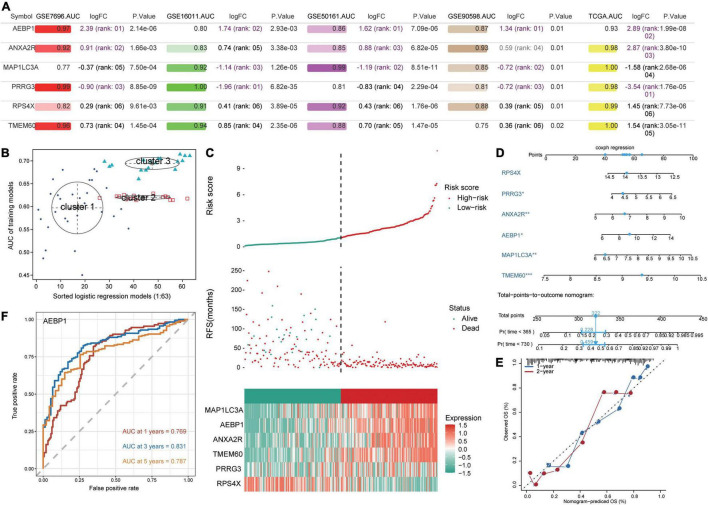
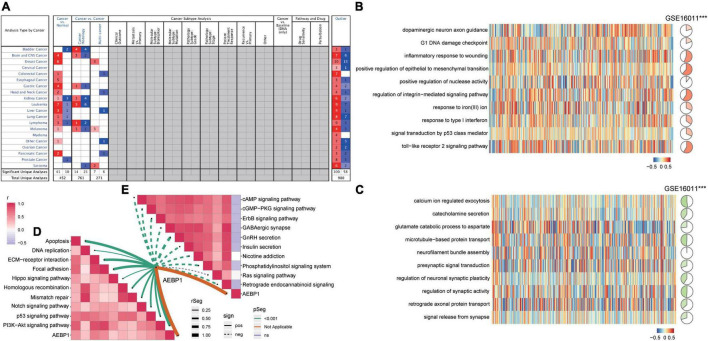
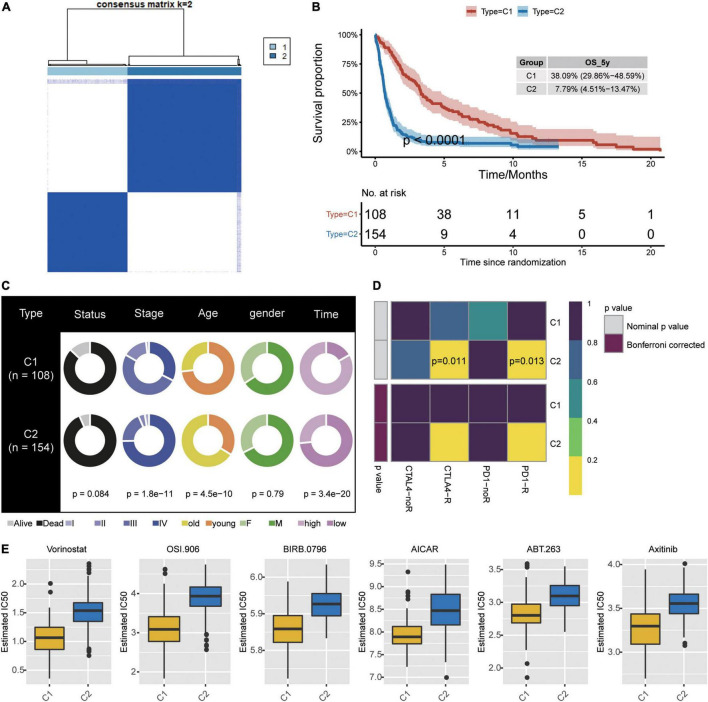
Results: We identified 3,139 common DEGs, which were associated mainly with PI3K-Akt signaling, focal adhesion, and Hippo signaling. Cox regression identified 106 common DEGs that were significantly associated with overall survival. LASSO and random forest algorithms identified six candidate genes (AEBP1, ANXA2R, MAP1LC3A, TMEM60, PRRG3 and RPS4X) that predicted overall survival and GBM recurrence. AEBP1 showed the best prognostic performance. We found that GBM tissues were heavily infiltrated by T helper cells and macrophages, which correlated with higher AEBP1 expression. Stratifying patients based on the six candidate genes led to two groups with significantly different overall survival. Somatic mutations in AEBP1 and modified methylation of MAP1LC3A were associated with GBM.

Conclusion: We have identified candidate genes, particularly AEBP1, strongly associated with GBM prognosis, which may help in efforts to understand and treat the disease.

Keywords: AEBP1; Cox regression; consensus cluster; glioblastoma; overall survival.


Conflict of interest statement

The authors declare that the research was conducted in the absence of any commercial or financial relationships that could be construed as a potential conflict of interest.

Figures

FIGURE 1
FIGURE 1
Differentially expressed genes (DEGs) between GBM patients and controls. (A) Manhattan plot of DEGs in the datasets TCGA, GSE16011, GSE7696, GSE50161 and GSE90598. (B) Statistical bar graph of DEGs in each group. (C) DEGs upregulated in GBM across all five datasets. (D) DEGs downregulated in GBM across all five datasets.
FIGURE 2
FIGURE 2
Functional enrichment of common DEGs in GBM. (A) Biological processes activated (red) or inhibited (blue) by common DEGs in GBM patients relative to controls. (B) KEGG pathways activated (red) or inhibited (blue) by common DEGs in GBM patients relative to controls. (C) Activated or inhibited processes in GBM patients relative to controls, based on gene set enrichment analysis.
FIGURE 3
FIGURE 3
Identification of prognosis-related candidate genes in GBM. (A) The 19 gene signatures with the largest AUC values for diagnosing GBM. Signatures were identified using the least absolute shrinkage and selection operator (LASSO) algorithm, receiver operating characteristic curves, and Kaplan–Meier analysis of low- and high-risk groups. AUC, area under the receiver operating characteristic curve; FPR, false positive rate; TPR, true positive rate. (B) Forest plots of Cox regression analysis of gene signatures in the LASSO model. (C) Importance ranking of 15 gene signatures based on random forest survival modeling. (D) Forest plots of Cox regression analysis of gene signatures in the random forest survival model.
FIGURE 4
FIGURE 4
Prediction of GBM patient survival based on candidate genes. (A) Areas under the receiver operating characteristic curve (AUCs), fold change in differential expression, and P value associated with candidate genes based on the datasets GSE16011, GSE7696, GSE50161, GSE90598, and TCGA. (B) Correlation of AUCs with the logistic regression model was identified using a Gaussian mixed model. (C) Distribution of candidate gene-based risk scores, recurrence-free survival (RFS) and gene expression levels in the GSE16011 dataset. (D) A predictive nomogram was constructed based on candidate genes and the GSE16011 dataset. (E) Agreement between nomogram-predicted and observed overall survival (OS) at one and 2 years. (F) Receiver operating characteristic curve for AEBP1 to predict OS at one, three, and 5 years.
FIGURE 5
FIGURE 5
AEBP1 may be a candidate marker for GBM. (A) AEBP1 expression in the Oncomine database. Red is high expression and blue is low expression. Numbers represent the number of analyses when the fold change of expression was 2. (B) Correlation between AEBP1 and biological processes activated in GBM. (C) Correlation between AEBP1 and biological processes inhibited in GBM. (D) Correlation between AEBP1 and KEGG pathways activated in GBM. (E) Correlation between AEBP1 and KEGG pathways inhibited in GBM.
FIGURE 6
FIGURE 6
Identification of new subtypes of GBM. (A) Consistency clustering based on six candidate genes and GBM patients, generating clusters C1 and C2. (B) Kaplan–Meier overall survival (OS) curves for the two clusters. (C) Differences in clinical characteristics between the two clusters. (D) Differences in predicted response to immunotherapy between the two clusters. (E) Predicted drug IC50 values that differed the most between the two clusters.

Similar articles

Cited by

References

    1. Blanche P., Dartigues J. F., Jacqmin-Gadda H. (2013). Estimating and comparing time-dependent areas under receiver operating characteristic curves for censored event times with competing risks. Stat. Med. 32 5381–5397. 10.1002/sim.5958 - DOI - PubMed
    1. Chen Z., Morales J. E., Guerrero P. A., Sun H., McCarty J. H. (2018). PTPN12/PTP-PEST Regulates Phosphorylation-Dependent Ubiquitination and Stability of Focal Adhesion Substrates in Invasive Glioblastoma Cells. Cancer Res. 78 3809–3822. 10.1158/0008-5472.CAN-18-0085 - DOI - PMC - PubMed
    1. de Semir D., Bezrookove V., Nosrati M., Scanlon K. R., Singer E., Judkins J., et al. (2020). PHIP drives glioblastoma motility and invasion by regulating the focal adhesion complex. Proc. Natl. Acad. Sci. U. S. A. 117 9064–9073. 10.1073/pnas.1914505117 - DOI - PMC - PubMed
    1. Dvorak H. F. (1986). Tumors: wounds that do not heal. Similarities between tumor stroma generation and wound healing. N Engl. J. Med. 315 1650–1659. 10.1056/NEJM198612253152606 - DOI - PubMed
    1. Friedman J., Hastie T., Tibshirani R. (2010). Regularization Paths for Generalized Linear Models via Coordinate Descent. J. Stat. Softw. 33 1–22. - PMC - PubMed