. 2022 Aug 19;25(8):104766.
doi: 10.1016/j.isci.2022.104766. Epub 2022 Jul 16.

Both COVID-19 infection and vaccination induce high-affinity cross-clade responses to SARS-CoV-2 variants

Affiliations

Both COVID-19 infection and vaccination induce high-affinity cross-clade responses to SARS-CoV-2 variants

Marc Emmenegger et al. iScience. .

Abstract

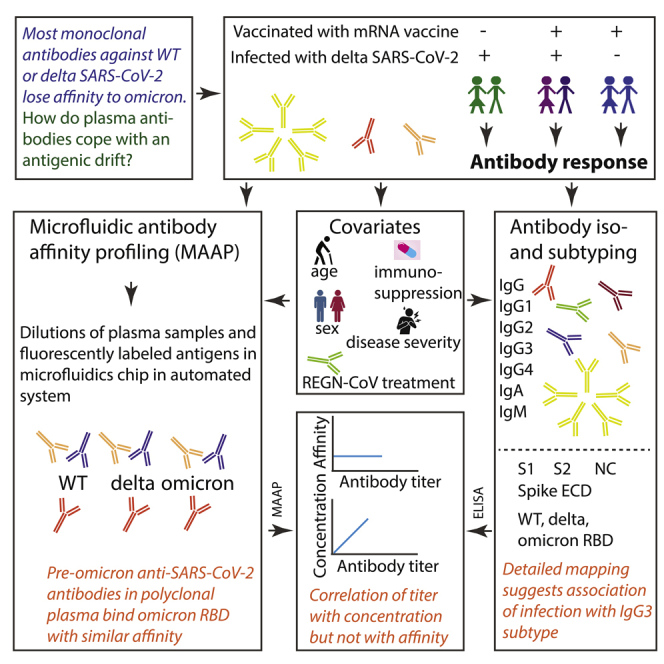
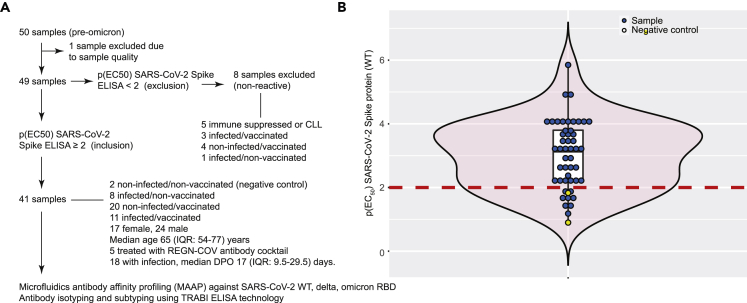
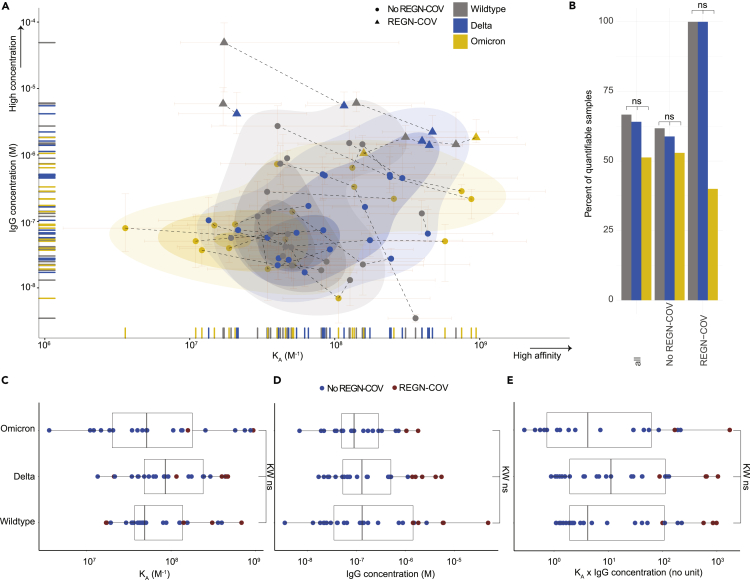
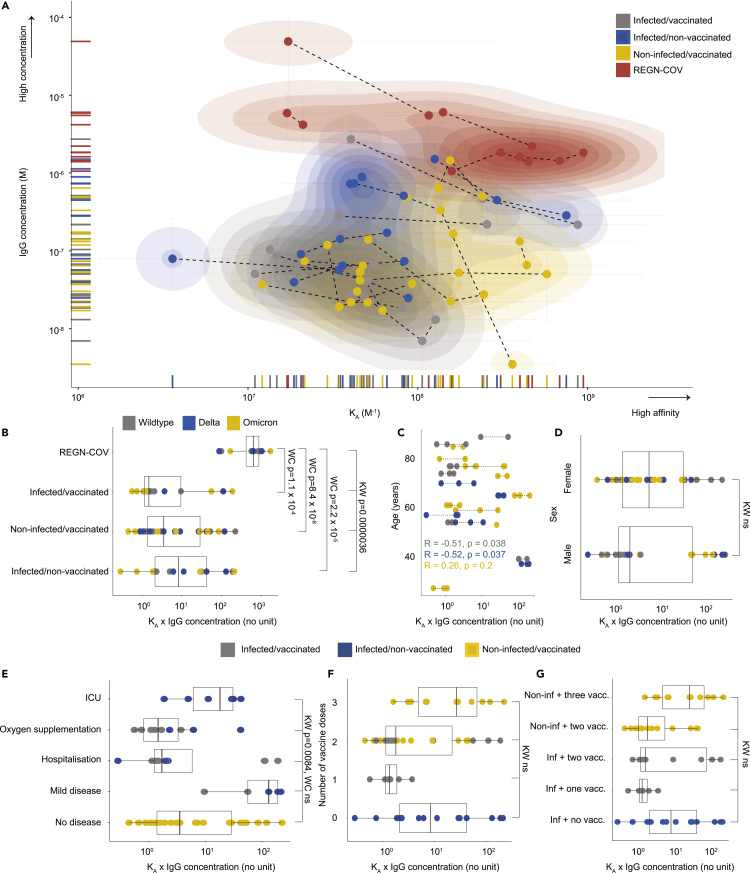
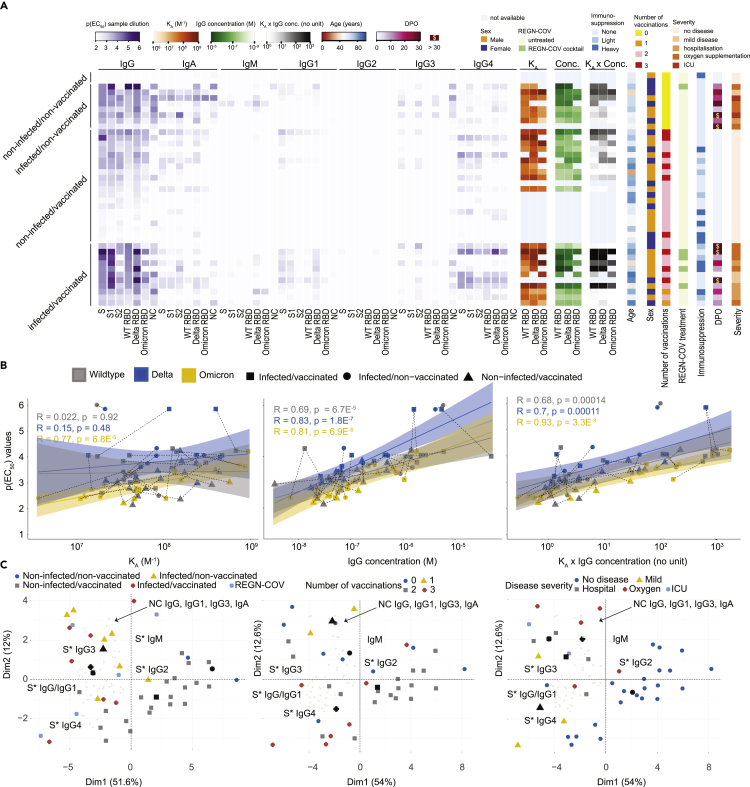
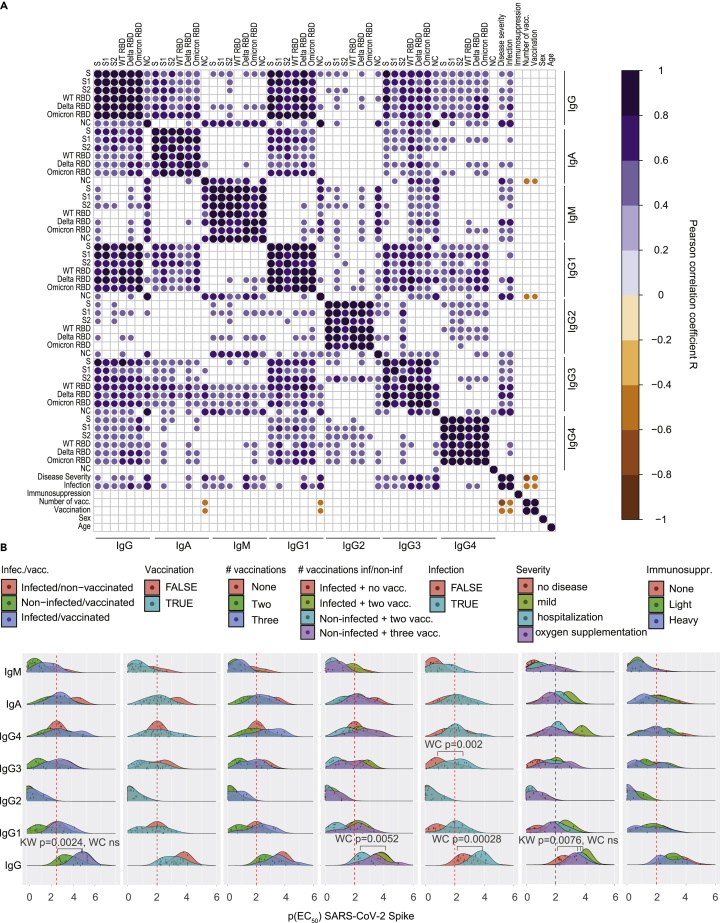
The B.1.1.529 (omicron) variant has rapidly supplanted most other SARS-CoV-2 variants. Using microfluidics-based antibody affinity profiling (MAAP), we have characterized affinity and IgG concentration in the plasma of 39 individuals with multiple trajectories of SARS-CoV-2 infection and/or vaccination. Antibody affinity was similar against the wild-type, delta, and omicron variants (K A ranges: 122 ± 155, 159 ± 148, 211 ± 307 μM-1, respectively), indicating a surprisingly broad and mature cross-clade immune response. Postinfectious and vaccinated subjects showed different IgG profiles, with IgG3 (p-value = 0.002) against spike being more prominent in the former group. Lastly, we found that the ELISA titers correlated linearly with measured concentrations (R = 0.72) but not with affinity (R = 0.29). These findings suggest that the wild-type and delta spike induce a polyclonal immune response capable of binding the omicron spike with similar affinity. Changes in titers were primarily driven by antibody concentration, suggesting that B-cell expansion, rather than affinity maturation, dominated the response after infection or vaccination.

Keywords: Disease; Immune response; Virology.


Conflict of interest statement

TPJK is a member of the board of directors of Fluidic Analytics. AA is a member of the clinical and scientific advisory board of Fluidic Analytics. AA is a member of the board of directors of Mabylon AG and AB2Bio AG. AKL, SF, SRAD, ASM, AYM, AI, and FR are employees of Fluidic Analytics. GM is a technical consultant for Fluidic Analytics. All other authors declare no competing interest.

Figures

None
Graphical abstract
Figure 1
Figure 1
Study design and experimental approach (A) Flowchart for inclusion and exclusion into the study. 41 samples were included in the analysis, representing different patient groups. (B) Violin boxplot showing the distribution of IgG p(EC50) values against the SARS-CoV-2 spike protein. A cutoff value of p(EC50) ≥ 2 was chosen to define reactive samples. Blue dots represent samples of infected and/or vaccinated individuals. Yellow dots are non-infected and non-vaccinated negative controls.
Figure 2
Figure 2
Characterization of affinity of SARS-CoV-2 antibodies to WT, delta, and omicron RBD variants (A) 2D scatter plot with integrated density contours. All quantifiable data points reflecting KA (in M−1) and IgG concentration values (in M) are plotted. 95% confidence intervals for each point are colored in light red. Triangles denote patients receiving the REGN-COV cocktail. RBD variants: WT (grey), delta (blue), omicron (yellow). Dotted lines represent the measurements of the same patient sample against different RBD variants. (B) Bar graph displaying the percentages of quantifiable samples for WT (grey), delta (blue), and omicron (yellow) RBD variants. Comparisons were performed including all samples, samples excluding those treated with REGN-COV, and only those treated with REGN-COV. Fisher’s exact test displayed no significant differences, at α = 0.01. (C and D) Boxplot analysis of KA values (C) and IgG concentrations (D) for WT, delta, and omicron RBD variants. (E) To employ a combined score of binding affinity (KA) and IgG concentration, we utilized the product KA x IgG concentration. (C-E): Colors denote treatment with REGN-COV (red) or absence of treatment (blue). Kruskal-Wallis (KW) with post-hoc Wilcoxon rank sum test (WC) after Holm correction for multiple comparisons was used, with α = 0.01. None of the group-wise comparisons reached statistical significance.
Figure 3
Figure 3
Correlation of affinity and IgG concentrations with clinically relevant parameters does not reveal clear differences between vaccinated and infected subgroups (A) 2D scatter plot with integrated density contours. All quantifiable data points reflecting KA (in M−1) and IgG concentration (in M) are plotted. 95% confidence intervals for each point are colored in light red. No distinct clusters were observed among patient groups infected/vaccinated (grey), infected/non-vaccinated (blue), non-infected/vaccinated (yellow); however, the REGN-COV-treated patients (red) clustered separately. (B) The same groups as in (A) depicted in a boxplot. Statistical analysis is shown in the graph. The RBD variants are color-coded. (C and D) No correlation between age (C) or sex (D) and KA x IgG concentration. (E) Although Kruskal-Wallis statistical testing indicates that the distributions are significantly different for different disease severities, pair-wise testing with the Wilcoxon rank sum test does not result in significance. (F) Trend towards increased KA x IgG concentration products in triple vaccinated individuals, without being statistically significant. (G) Same as (F) but additionally stratified according to vaccination/non-vaccination. A: Dotted lines represent the measurements of the same patient sample against different RBD variants. B, D-G: Kruskal-Wallis (KW) with post-hoc Wilcoxon rank sum test (WC) after Holm correction for multiple comparisons was used, with α = 0.01. C: The Pearson correlation coefficient was calculated. C-G: The patient groups are color-coded as in (A); however, the REGN-COV-treated patients were excluded from analyses.
Figure 4
Figure 4
Analysis of antibody subtypes, correlation with MAAP parameters, and global feature profiling (A) Multiple heatmaps. Purple heatmap displaying p(EC50) values (gradient) obtained with TRABI ELISA, for IgG, IgA, IgM, IgG1, IgG2, IgG3, and IgG4 antibodies. The SARS-CoV-2 WT spike ectodomain, the WT S1 domain, the WT S2 domain, the WT RBD, the delta RBD, and the omicron RBD variants as well as the nucleocapsid (NC) proteins were used. Orange heatmap displaying KA values, green heatmap displaying IgG concentration, grey heatmap displaying KA x IgG concentration obtained with MAAP against WT, delta, and omicron RBD variants. Additional heatmaps depict the age (red to blue), sex (orange: male; blue: female), number of vaccinations (yellow = 0, orange = 1, purple = 2, red = 3), treatment with the REGN-COV cocktail (green = TRUE), the strength of immunosuppression (none = light blue, light = turquoise, heavy = dark blue), the days post onset of infection (DPO) for patients with infection (pink), and disease severity (orange gradient). (B) Correlation between IgG p(EC50) values of the spike ectodomain with KA, IgG concentrations, or the product KA x IgG concentration. (C) Principal component analysis using all TRABI ELISA values as input. The three plots represent different color-based clustering approaches.
Figure 5
Figure 5
Multidimensional analysis of antibody profiles in patients after SARS-CoV-2 infection versus vaccination (A) Correlogram analysis using the TRABI ELISA values combined with features such as disease severity, immunosuppression, number of vaccinations received, sex, and age. Only significant correlations are shown, at α = 0.01. (B) Ridge plot distributions of p(EC50) values for all immunoglobulin iso- and subtypes against the Spike ECD. Data were aggregated according to the patient group, vaccination, number of vaccinations, infection, disease severity, and immunosuppression. Kruskal-Wallis (KW) with post-hoc Wilcoxon rank sum test (WC) after Holm correction for multiple comparisons was used, with α = 0.01. Only significant changes are displayed.

References

    1. Amanat F., Stadlbauer D., Strohmeier S., Nguyen T.H.O., Chromikova V., McMahon M., Jiang K., Arunkumar G.A., Jurczyszak D., Polanco J., et al. A serological assay to detect SARS-CoV-2 seroconversion in humans. Nat. Med. 2020;26:1033–1036. doi: 10.1038/s41591-020-0913-5. - DOI - PMC - PubMed
    1. Cameroni E., Bowen J.E., Rosen L.E., Saliba C., Zepeda S.K., Culap K., Pinto D., VanBlargan L.A., De Marco A., di Iulio J., et al. Broadly neutralizing antibodies overcome SARS-CoV-2 Omicron antigenic shift. Nature. 2022;602:664–670. doi: 10.1038/s41586-021-04386-2. - DOI - PMC - PubMed
    1. Cao Y., Wang J., Jian F., Xiao T., Song W., Yisimayi A., Huang W., Li Q., Wang P., An R., et al. Omicron escapes the majority of existing SARS-CoV-2 neutralizing antibodies. Nature. 2022;602:657–663. doi: 10.1038/s41586-021-04385-3. - DOI - PMC - PubMed
    1. Cele S., Jackson L., Khoury D.S., Khan K., Moyo-Gwete T., Tegally H., San J.E., Cromer D., Scheepers C., Amoako D.G., et al. Omicron extensively but incompletely escapes Pfizer BNT162b2 neutralization. Nature. 2022;602:654–656. doi: 10.1038/S41586-021-04387-1. - DOI - PMC - PubMed
    1. Crowley A.R., Natarajan H., Hederman A.P., Bobak C.A., Weiner J.A., Wieland-Alter W., Lee J., Bloch E.M., Tobian A.A.R., Redd A.D., et al. Boosting of cross-reactive antibodies to endemic coronaviruses by SARS-CoV-2 infection but not vaccination with stabilized spike. eLife. 2021;11:e75228. doi: 10.1101/2021.10.27.21265574. - DOI - PMC - PubMed

LinkOut - more resources