. 2022 Jan-Dec;14(1):2104089.
doi: 10.1080/19490976.2022.2104089.

Gut dysbiosis impairs hippocampal plasticity and behaviors by remodeling serum metabolome

Affiliations

Gut dysbiosis impairs hippocampal plasticity and behaviors by remodeling serum metabolome

Guoqiang Liu et al. Gut Microbes. 2022 Jan-Dec.

Abstract

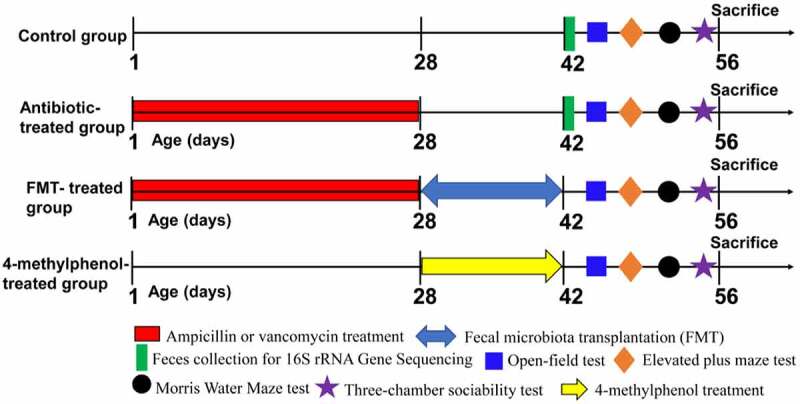
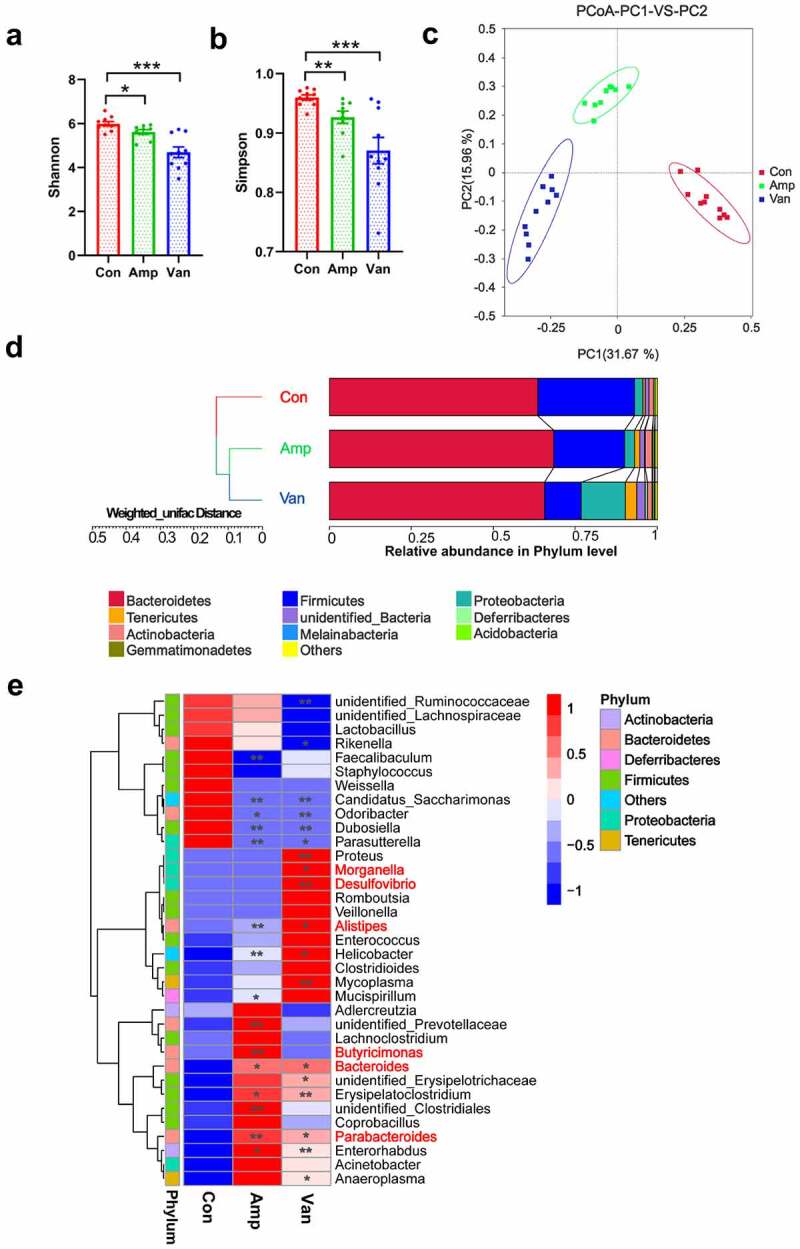
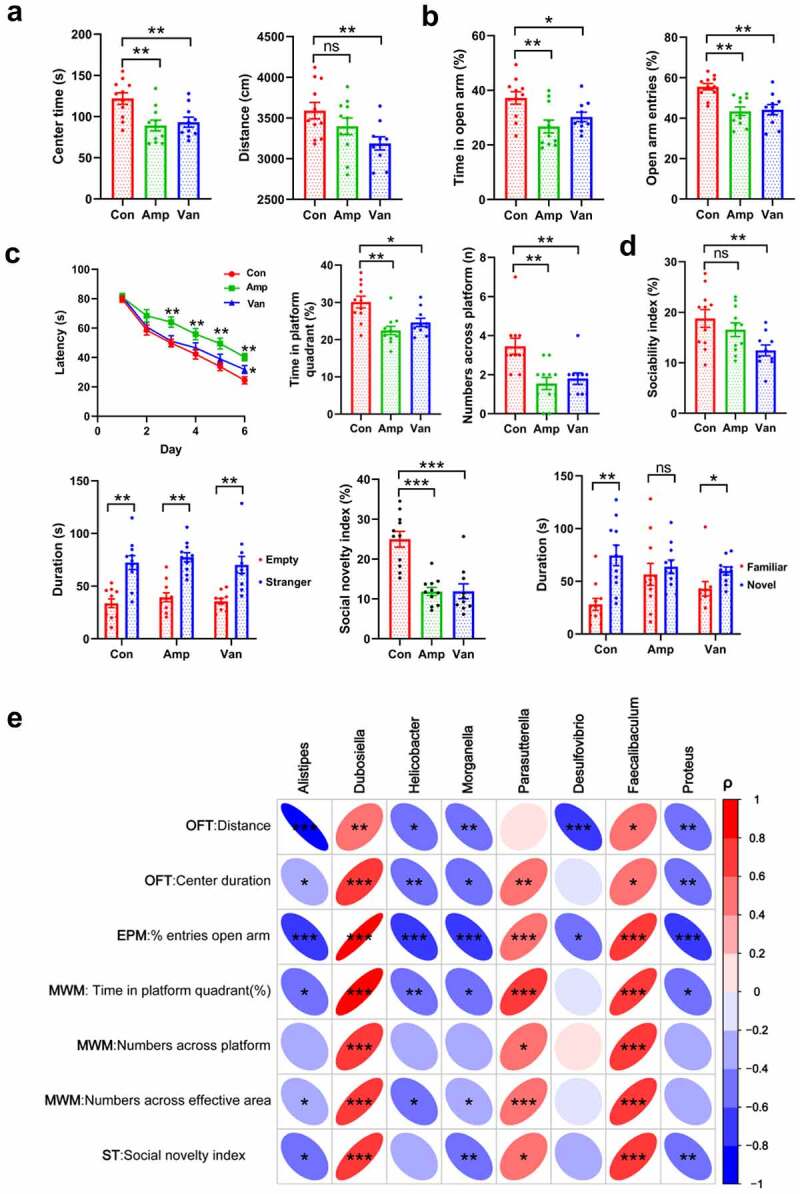
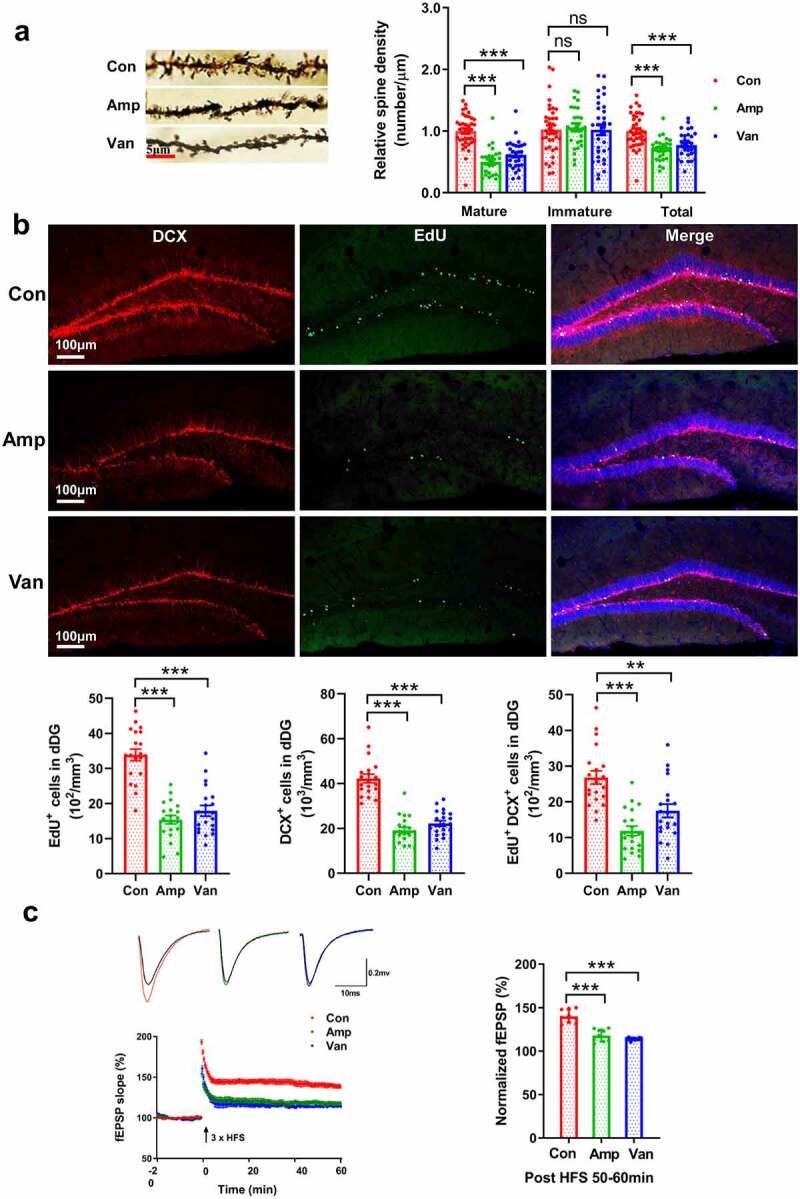
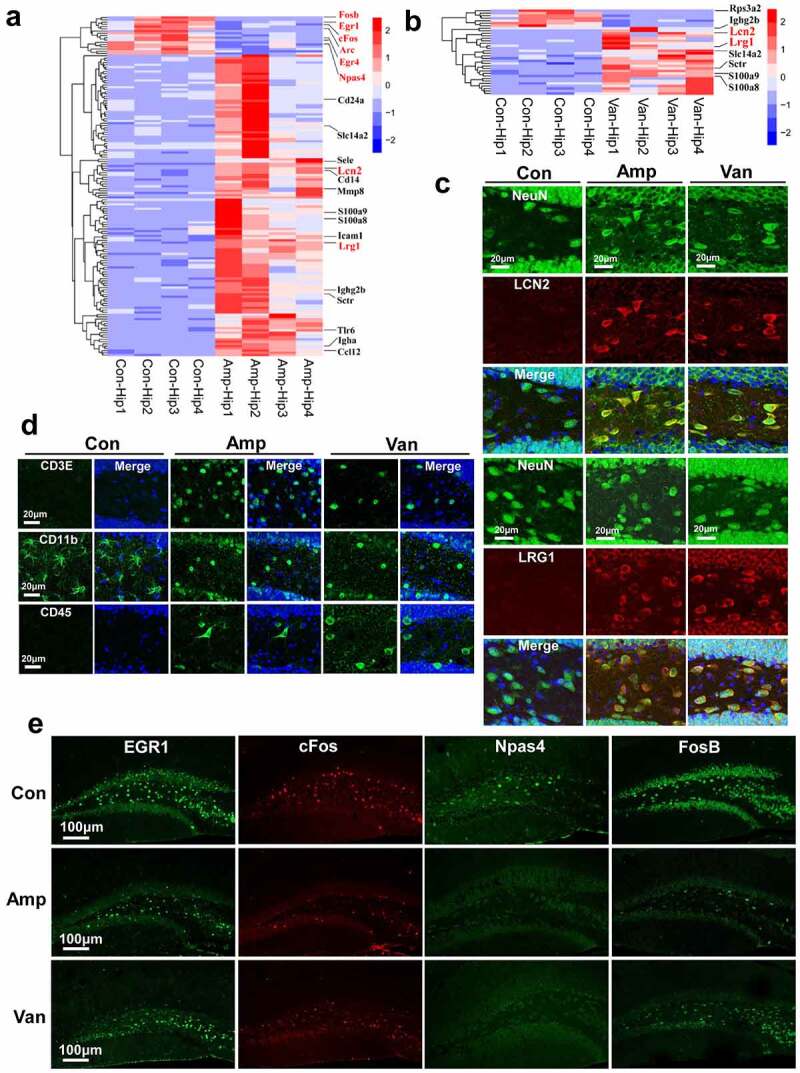
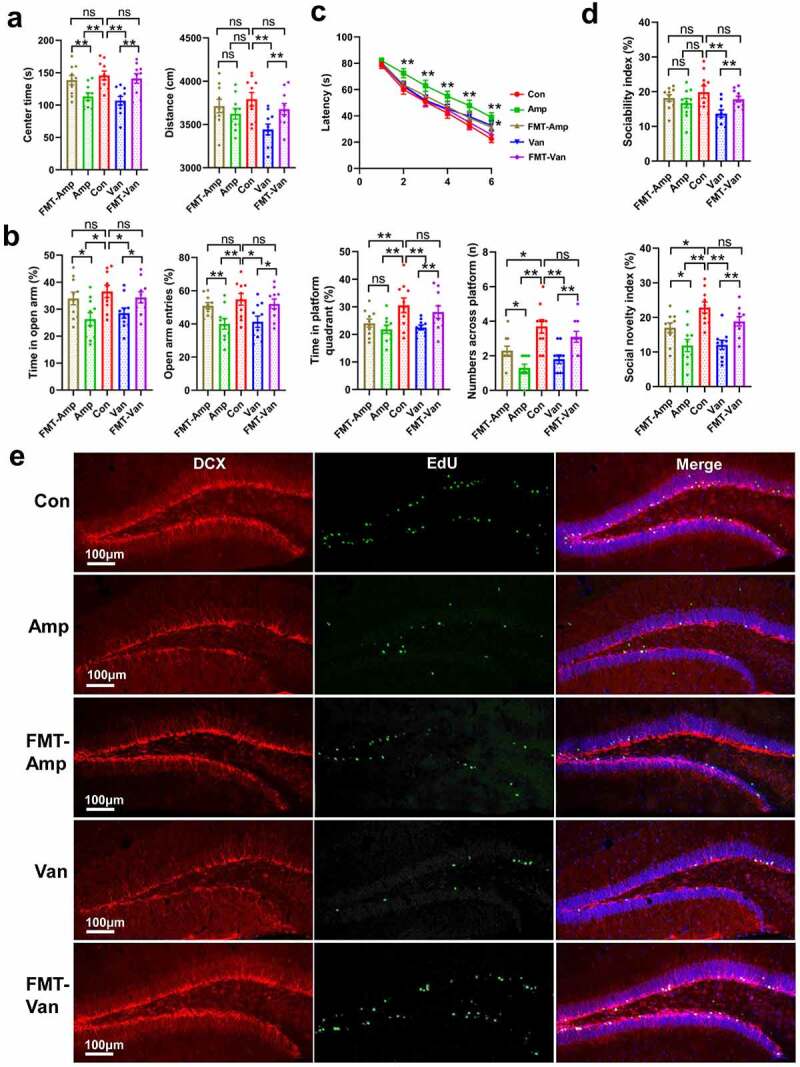
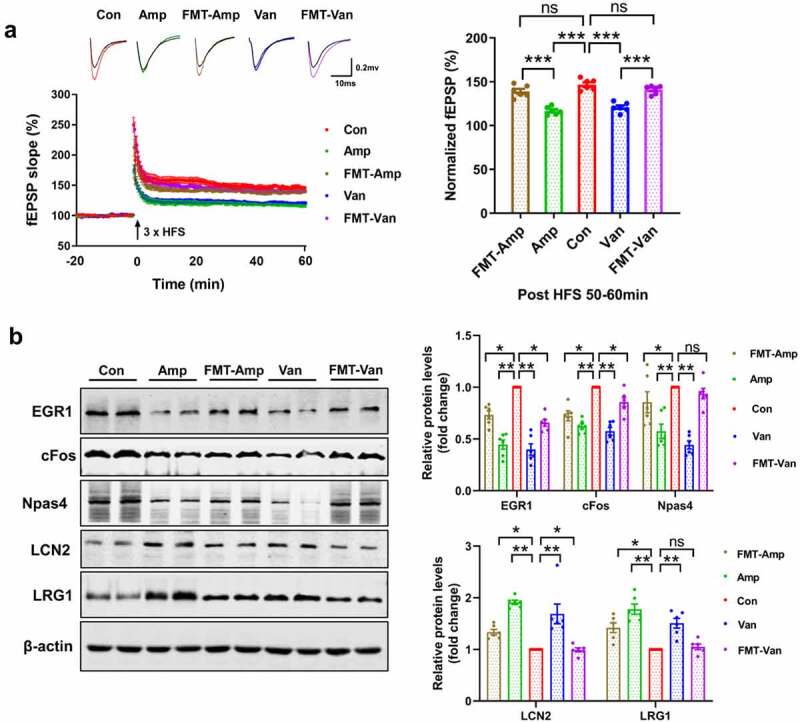
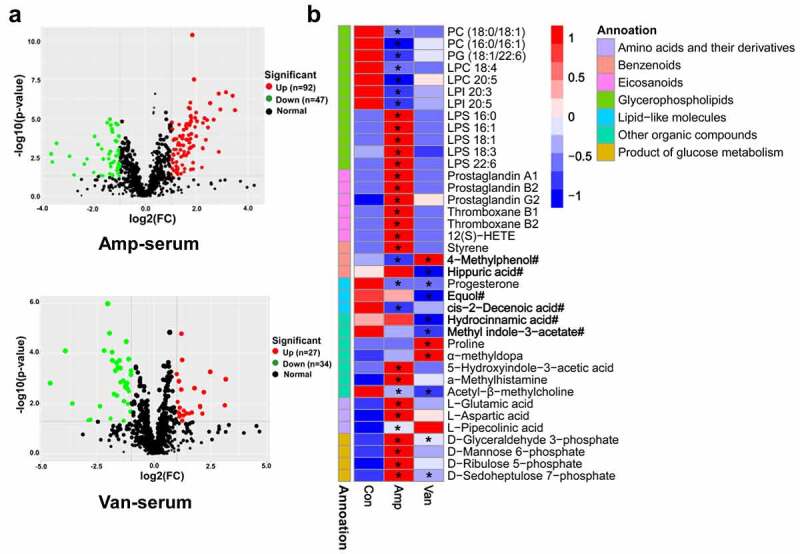
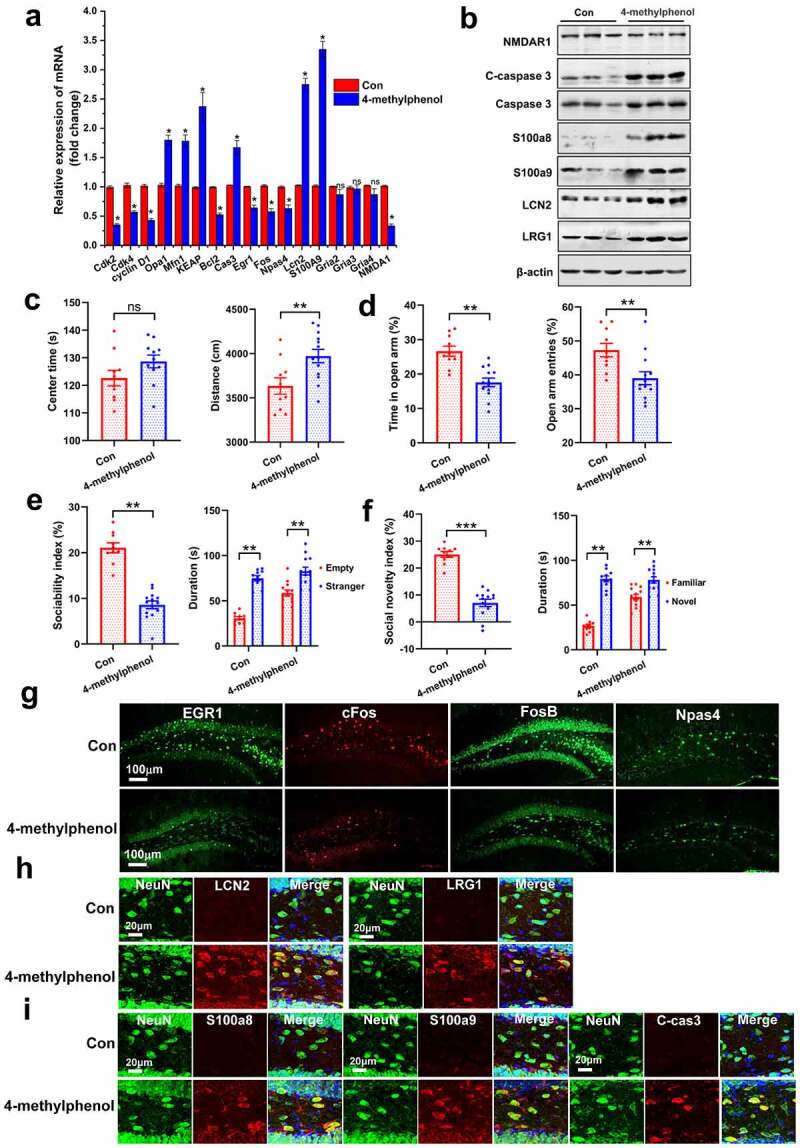
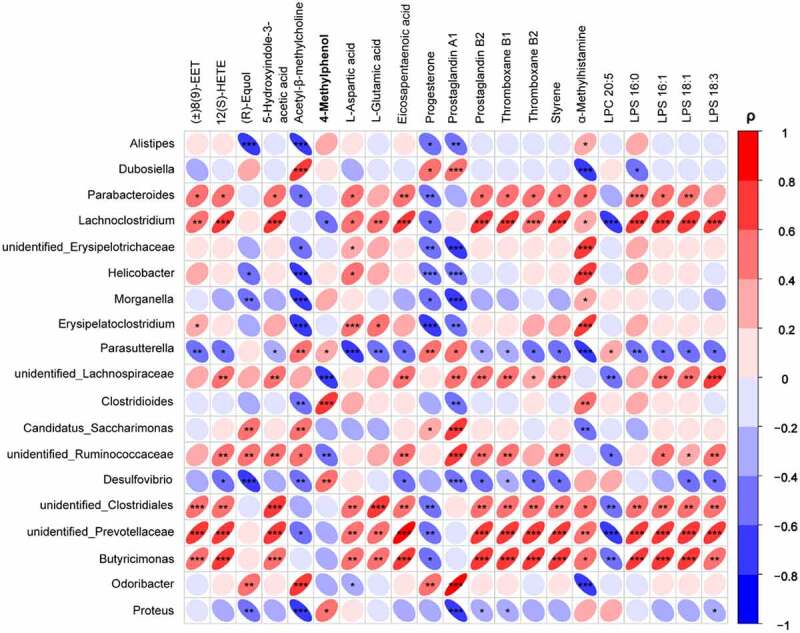
Accumulating evidence suggests that gut microbiota as a critical mediator of gut-brain axis plays an important role in human health. Altered gut microbial profiles have been implicated in increasing the vulnerability of psychiatric disorders, such as autism, depression, and schizophrenia. However, the cellular and molecular mechanisms underlying the association remain unknown. Here, we modified the gut microbiome with antibiotics in newborn mice, and found that gut microbial alteration induced behavioral impairment by decreasing adult neurogenesis and long-term potentiation of synaptic transmission, and altering the gene expression profile in hippocampus. Reconstitution with normal gut flora produced therapeutic effects against both adult neurogenesis and behavioral deficits in the dysbiosis mice. Furthermore, our results show that circulating metabolites changes mediate the effect of gut dysbiosis on hippocampal plasticity and behavior outcomes. Elevating the serum 4-methylphenol, a small aromatic metabolite produced by gut bacteria, was found to induce autism spectrum disorder (ASD)-like behavior impairment and hippocampal dysfunction. Together our finding demonstrates that early-life gut dysbiosis and its correlated metabolites change contribute to hippocampal dysfunction and behavior impairment, hence highlight the potential microbiome-mediated therapies for treating psychiatric disorders.

Keywords: 4-methylphenol; Gut microbiota; behavior; psychiatric disorders; serum metabolites.


Conflict of interest statement

No potential conflict of interest was reported by the author(s).

Figures

Figure 1.
Figure 1.
Experimental group and time linesThe newborn mice (P1) were treated with antibiotics (100 mg/kg ampicillin or 50 mg/kg vancomycin) or vehicle (distilled water) by oral gavage daily for four weeks (P1-P28). The feces of the mice were collected at the day P42 for 16S rRNA sequencing. Then, a series of behavioral testing was conducted in the order of OFT, EPM, MWM and three-chamber social test (P43-P56). For FMT-treated group, a fecal microbiota transfer protocol was conducted (P28-P42) in antibiotic-treated mice after the final antibiotic gavage. After that, animals were subjected to behavioral tests mentioned above (P43-P56). For 4-methylphenol-treated group, wild-type mice (4-week-old C57BL/6 J mice) were injected i.p. with 4-methylphenol (35 mg/kg) or saline (control group) daily for two weeks (P28-P42). Behavioral testing was performed after the treatment. After the social behavior test, the mice were returned to the their home cages for 1.5 h to induce the expression of IEGs, and then mice were perfused or the brain tissues were collected immediately.
Figure 2.
Figure 2.
Antibiotic treatment induces dramatic changes in the gut microbial composition(a) Shannon index and (b) Simpson index of gut microbiota. Data are presented as mean ± SEM, N = 9–10/group, unpaired two-tailed t-test, *P < 0.05, **P < 0.01, ***P < 0.001. (c) PCoA analysis based on the Bray-Curtis distance was performed to visually explore the similarity and variations between the samples’ microbial composition. N = 9–10/group. The percentages in parentheses refer to the proportions of variation explained by each ordination axis. (d) UPGMA clustering tree based on weighted UniFrac distance shows the relative abundance of gut microbiota at the phylum level. N = 9–10/group. (e) Heatmap of the relative abundance of top 35 bacterial genera. Some bacteria associated with neurological and psychiatric disorders were marked in red. N = 9–10/group. Data are presented as mean ± SEM, unpaired two-tailed t-test, *P < 0.05, **P < 0.01.
Figure 3.
Figure 3.
Gut dysbiosis increases the anxiety and impairs the spatial memory and social behavior(a, b) The locomotor and anxiety-like behavior in the OFT (A) and EPM test (B). N = 9–10/group. Data are presented as mean ± SEM, unpaired two-tailed t-test, *P < 0.05, **P < 0.01, ns: no significance. (c) The spatial learning and memory ability were evaluated using the MWM test. N = 9–10/group. Data are presented as mean ± SEM, unpaired two-tailed t-test, *P < 0.05, **P < 0.01. (d) The figure shows the three-chambered social test, the sociability index and social novelty index were shown. N = 9–10/group. Data are presented as mean ± SEM, unpaired two-tailed t-test, **P < 0.01, ***P < 0.001, ns: no significance. (e) Spearman’s correlation analysis of the relationship between behavioral outcomes and the abundance of bacteria. Positive sloped elipses represents a positive correlation, negatively sloped ellipses indicates negative correlations. The color shows the strength of the spearman correlation coefficient ρ, ρ > 0.6 or ρ<-0.6, and P-value < 0.05 were considered as a significant correlation. *P < 0.05, **P < 0.01, ***P < 0.001.
Figure 4.
Figure 4.
Disruption of gut microbiota impairs synaptic plasticity and adult neurogenesis(a) Golgi staining was used to visualize apical dendritic processes in the dorsal DG (dDG), the mature-appearing spine (mushroom spine) decreased following disruption of gut microbiota. N = 3/group. Data are presented as mean ± SEM, unpaired two-tailed t-test, **P < 0.01, ***P < 0.001, ns: no significance. (b) The representative micrographs and quantitative analysis of the cells positive for EdU and DCX in the dorsal hippocampus. N = 3/group. Data are presented as mean ± SEM, unpaired two-tailed t-test, **P < 0.01, ***P < 0.001. (c) Gut dysbiosis impaired LTP in antibiotic-treated mice, The time course and extent of LTP induction following HFS were shown. N = 9/group. Data are presented as mean ± SEM, unpaired two-tailed t-test, ***P < 0.001.
Figure 5.
Figure 5.
Disruption of gut microbiota alters hippocampal gene expression(a-b) Heatmap of significantly differential genes in the hippocampus following disruption of gut microbiota, some representative genes were marked in red in the graph. N = 4/group, FDR adjusted P-value of 0.1 and absolute foldchange of 2 was set as the threshold for significantly differential expression. (c) Confocal imaging shows that the LCN2- and LRG1-positive cells significantly increased in hippocampal DG following disruption of gut microbiota. N = 5/group. The nuclei were stained with DAPI. (d) The representative micrographs show the CD3E-, CD11b- and CD45-positive cell in the hippocampal DG. N = 5/group. The nuclei were stained with DAPI. (e) The representative micrographs show that antibiotic treatment resulted in an impairment the up-regulation of IEGs induced by social behavior test. N = 5/group.
Figure 6.
Figure 6.
Reconstitution with normal gut flora produces the therapeutic effects in the gut dysbiosis mice(a-b) FMT restored the locomotor ability and removed the anxiety-like behavior in gut dysbiosis mice. (a) OFT, (b) EPM test. N = 9–10/group. Data are presented as mean ± SEM, unpaired two-tailed t-test, *P < 0.05, **P < 0.01, ns: no significance. (c-d) FMT rescued the deficits in spatial memory (c) and social activity (D) in the gut dysbiosis mice. (c) MWM test; (d) three-chamber social test. N = 9–10/group. Data are presented as mean ± SEM, unpaired two-tailed t-test, *P < 0.05, **P < 0.01, ns: no significance.(e) Confocal micrographs show that FMT rescued the adult neurogenesis in antibiotic-treated mice. N = 5/group.
Figure 7.
Figure 7.
FMT restore the hippocampal LTP and the expression of IEGs (a) FMT restored the hippocampal LTP in the gut dysbiosis mice. The time course and extent of LTP induction following HFS were shown. N = 6/group. Data are presented as mean ± SEM, unpaired two-tailed t-test, ***P < 0.001. (b) FMT rescued the expression of IEGs, LCN2 and LRG1. N = 6/group. Data are presented as mean ± SEM, unpaired two-tailed t-test, *P < 0.05, **P < 0.01, ns: no significance.
Figure 8.
Figure 8.
Microbiota dysbiosis in early-life alters serum metabolome(a) volcano plot showing differential metabolites in amp-treated and van-treated mice. N = 9–10/group. Criteria for significant differences (VIP > 1, P < 0.05 and fold change ≥ 2). (b) heatmap of representative differential metabolites. The metabolites derived from the gut bacteria were marked with “#”. *P < 0.05, **P < 0.01.
Figure 9.
Figure 9.
Bacterial metabolite 4-methylphenol impairs the social behavior and hippocampal plasticity(a) real-time RT-PCR and (b) western blot analysis show the differential genes in primary hippocampal neurons exposed to 4-methylphenol. Cells were treated with 4-methylphenol at 60 μM for 48 hours as well as DMSO as a control. Data are presented as mean ± SEM, unpaired two-tailed t-test, *P < 0.05, ns: no significance. (c-d) effects of 4-methylphenol on locomotor activity and anxiety-like behavior in the OFT (c) and EPM test (d). N = 10/group. Data are presented as mean ± SEM, unpaired two-tailed t-test, **P < 0.01, ns: no significance. (e-f) administration of the 4-methylphenol to native mice impaired the sociability (e) and social novelty (f). wild-type mice (4-week old) were injected i.p. with saline or 4-methylphenol (35 mg/kg) daily for two weeks. N = 10/group. Data are presented as mean ± SEM, unpaired two-tailed t-test, **P < 0.01, ***P < 0.001. (g) representative micrographs show that 4-methylphenol treatment reduced the up-regulation expression of IEGs induced by social test. N = 4/group. (h) representative micrographs show that 4-methylphenol treatment increased the number of LCN2 and LRG1 positive neuron in the hippocampal DG. N = 4/group. (i) confocal micrographs show that the protein of S100a8, S100a9 and cleaved-caspase-3 were overexpressed in the hippocampus of mice treated with 4-methylphenol. N = 4/group.
Figure 10.
Figure 10.
Heatmap analysis of the Spearman correlation between serum differential metabolites and dominanting bacteria genera.Negatively sloped ellipses indicates negative correlations, and positive sloped elipses represents a positive correlation. The color shows the strength of the spearman correlation coefficient ρ, ρ > 0.6 or ρ<-0.6, and P-value < 0.05 were considered as a significant correlation. *P < 0.05, **P < 0.01, ***P < 0.001.

References

    1. Agirman G, and Hsiao EY.. SnapShot: the microbiota-gut-brain axis. Cell. 2021;184(9):2524–25. doi:10.1016/j.cell.2021.03.022. - DOI - PubMed
    1. Mosaferi B, Jand Y, Salari -A-A. Gut microbiota depletion from early adolescence alters anxiety and depression-related behaviours in male mice with Alzheimer-like disease. Sci Rep. 2021;11(1):22941. doi:10.1038/s41598-021-02231-0. - DOI - PMC - PubMed
    1. van de Wouw M, Boehme M, Lyte JM, Wiley N, Strain C, O’Sullivan O, Clarke G, Stanton C, Dinan TG, Cryan JF. Short-chain fatty acids: microbial metabolites that alleviate stress-induced brain-gut axis alterations. J Physiol. 2018;596(20):4923–4944. doi:10.1113/JP276431. - DOI - PMC - PubMed
    1. Hoban AE, Stilling RM, Moloney G, Shanahan F, Dinan TG, Clarke G, Cryan JF. The microbiome regulates amygdala-dependent fear recall. Mol Psychiatry. 2018;23(5):1134–1144. doi:10.1038/mp.2017.100. - DOI - PMC - PubMed
    1. McCarville JL, Chen GY, Cuevas VD, Troha K, Ayres JS. Microbiota metabolites in health and disease. Annu Rev Immunol. 2020;38(1):147–170. doi:10.1146/annurev-immunol-071219-125715. - DOI - PubMed

Publication types