

Integrated bioinformatic analysis of dysregulated microRNA-mRNA co-expression network in ovarian endometriosis
- PMID: 35876135
- PMCID: PMC9812100
- DOI: 10.1111/aogs.14430
Integrated bioinformatic analysis of dysregulated microRNA-mRNA co-expression network in ovarian endometriosis
Abstract
Introduction: Ovarian endometriosis is a frequently occurring gynecological disease with large socioeconomic impact. Accumulating evidence has suggested that aberrant miRNA-mRNA interactions are involved in the pathogenesis and progression of ovarian endometriosis. This study aims to identify key miRNAs in ovarian endometriosis by using integrated bioinformatic analysis of a dysregulated miRNA-mRNA co-expression network.
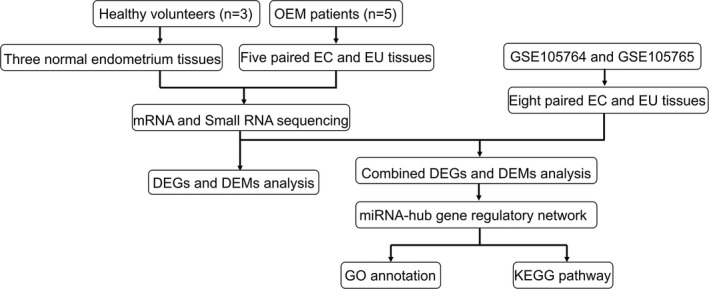
Material and methods: Expression profiling of miRNA and mRNA in three normal endometria and five pairs of ectopic/eutopic endometria from patients with ovarian endometriosis was determined by high-throughput sequencing techniques. The data were then integrated with the public sequencing datasets (GSE105764 and GSE105765) using a non-biased approach and a miRNA-mRNA co-expression regulatory network was constructed by in-depth bioinformatic analysis.
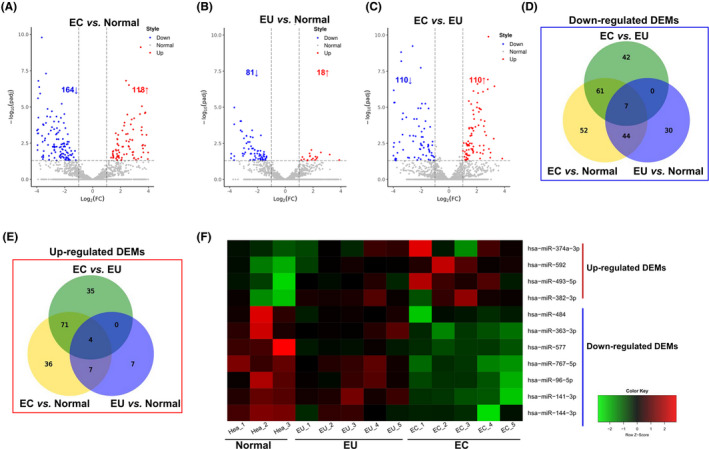
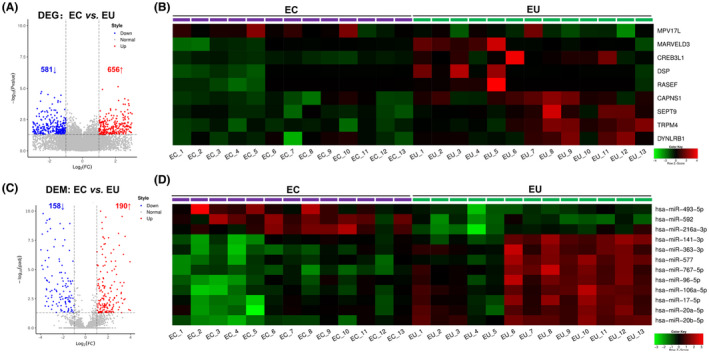
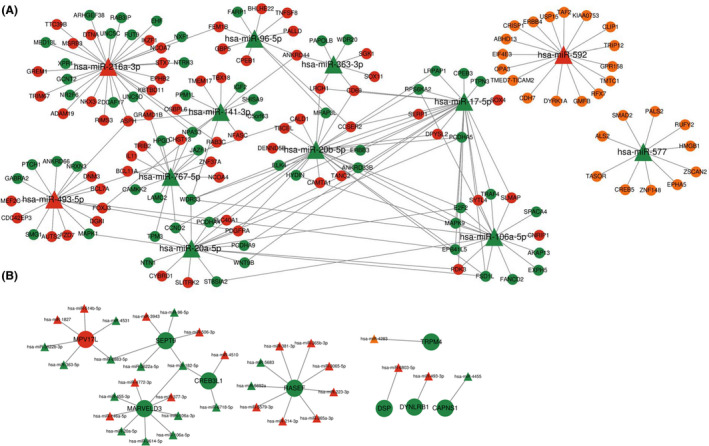
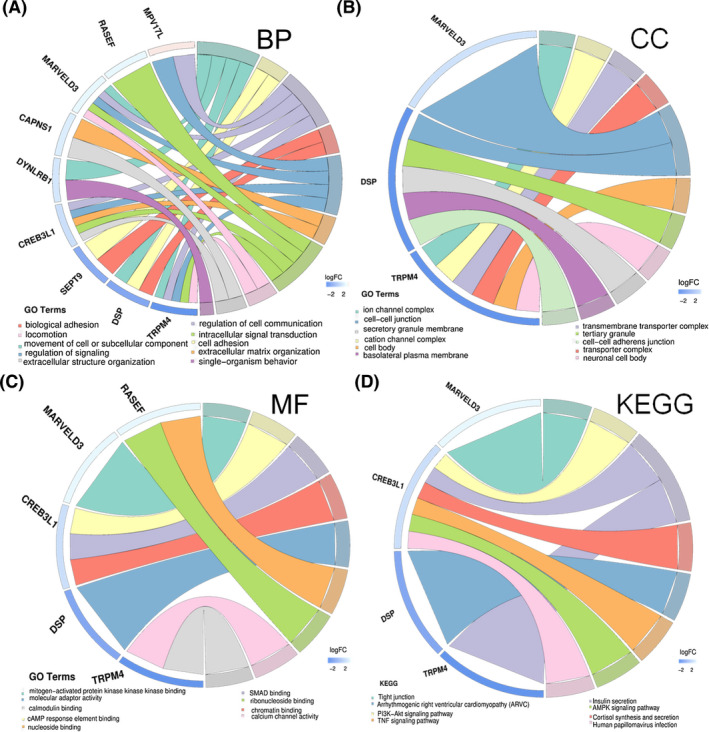
Results: The constructed miRNA-mRNA network included 87 functionally DEMs, 482 target mRNAs and 1850 paired miRNA-mRNA regulatory interactions. Specifically, five miRNAs (miR-141-3p, miR-363-3p, miR-577, miR-767-5p, miR-96-5p) were gradually decreased and two miRNAs (miR-493-5p, miR-592) were gradually increased from normal endometria to eutopic endometria, and then ectopic endometria tissues. Importantly, miR-141-3p, miR-363-3p and miR-96-5p belonged to the miR-200 family, miR-106a-363 cluster and miR-183/96/182 cluster, respectively. Their target mRNAs were mainly associated with cell adhesion, locomotion and binding, which are suggested to play vital regulatory roles in the pathogenesis of ovarian endometriosis.
Conclusions: Integrated bioinformatic analysis of the miRNA-mRNA co-expression network defines the crucial roles of the miR-200 family, miR-106a-363 cluster and miR-183/96/182 cluster in the pathogenesis of ovarian endometriosis. Further in-depth functional studies are needed to unveil the molecular mechanisms of these miRNAs, and may provide clues for the optimization of therapeutic strategies for ovarian endometriosis.
Keywords: expression profiling; integrative analysis; miRNAs; ovarian endometriosis; pathogenesis.
© 2022 The Authors. Acta Obstetricia et Gynecologica Scandinavica published by John Wiley & Sons Ltd on behalf of Nordic Federation of Societies of Obstetrics and Gynecology (NFOG).
Conflict of interest statement
None.
Figures
Similar articles
-
Integration analysis of microRNA and mRNA paired expression profiling identifies deregulated microRNA-transcription factor-gene regulatory networks in ovarian endometriosis.Reprod Biol Endocrinol. 2018 Jan 22;16(1):4. doi: 10.1186/s12958-017-0319-5. Reprod Biol Endocrinol. 2018. PMID: 29357938 Free PMC article.
-
Peritoneal fluid modifies the microRNA expression profile in endometrial and endometriotic cells from women with endometriosis.Hum Reprod. 2015 Oct;30(10):2292-302. doi: 10.1093/humrep/dev204. Epub 2015 Aug 25. Hum Reprod. 2015. PMID: 26307093
-
[Differential expression of microRNA in eutopic endometrium tissue during implantation window for patients with endometriosis related infertility].Zhonghua Fu Chan Ke Za Zhi. 2016 Jun 25;51(6):436-41. doi: 10.3760/cma.j.issn.0529-567X.2016.06.007. Zhonghua Fu Chan Ke Za Zhi. 2016. PMID: 27356479 Chinese.
-
Circulating microRNAs as Non-Invasive Biomarkers in Endometriosis Diagnosis-A Systematic Review.Biomedicines. 2024 Apr 17;12(4):888. doi: 10.3390/biomedicines12040888. Biomedicines. 2024. PMID: 38672242 Free PMC article. Review.
-
Promising therapeutic targets of endometriosis obtained from microRNA studies.Med Mol Morphol. 2022 Jun;55(2):85-90. doi: 10.1007/s00795-021-00308-3. Epub 2021 Nov 30. Med Mol Morphol. 2022. PMID: 34846581 Review.
Cited by
-
Downregulation of DROSHA: Could It Affect miRNA Biogenesis in Endometriotic Menstrual Blood Mesenchymal Stem Cells?Int J Mol Sci. 2023 Mar 22;24(6):5963. doi: 10.3390/ijms24065963. Int J Mol Sci. 2023. PMID: 36983035 Free PMC article.
-
Differential expression of serum mir-363-3p in patients with polycystic ovary syndrome and its predictive value for their pregnancy.BMC Womens Health. 2023 May 15;23(1):264. doi: 10.1186/s12905-023-02337-9. BMC Womens Health. 2023. PMID: 37189071 Free PMC article.
-
Upregulation of miR-183 inhibits the invasion and migration of endometrial stromal cells in endometriosis patients by downregulating Ezrin.Front Oncol. 2025 Jun 24;15:1537528. doi: 10.3389/fonc.2025.1537528. eCollection 2025. Front Oncol. 2025. PMID: 40630207 Free PMC article.
-
miRNA profiling of chicken follicles during follicular development.Sci Rep. 2024 Jan 26;14(1):2212. doi: 10.1038/s41598-024-52716-x. Sci Rep. 2024. PMID: 38278859 Free PMC article.
References
-
- Johnson NP, Hummelshoj L, Adamson GD, et al. World endometriosis society consensus on the classification of endometriosis. Hum Reprod. 2017;32:315‐324. - PubMed
-
- Liang Y, Yao S. Potential role of estrogen in maintaining the imbalanced sympathetic and sensory innervation in endometriosis. Mol Cell Endocrinol. 2016;424:42‐49. - PubMed
-
- Chapron C, Marcellin L, Borghese B, Santulli P. Rethinking mechanisms, diagnosis and management of endometriosis. Nat Rev Endocrinol. 2019;15:666‐682. - PubMed
MeSH terms
Substances
LinkOut - more resources
Full Text Sources
Medical
