. 2022 Sep;111(6):1701-1716.
doi: 10.1111/tpj.15918. Epub 2022 Aug 11.

Rearrangement with the nkd2 promoter contributed to allelic diversity of the r1 gene in maize (Zea mays)

Affiliations

Rearrangement with the nkd2 promoter contributed to allelic diversity of the r1 gene in maize (Zea mays)

Hao Wu et al. Plant J. 2022 Sep.

Abstract

The maize red1 (r1) locus regulates anthocyanin accumulation and is a classic model for allelic diversity; changes in regulatory regions are responsible for most of the variation in gene expression patterns. Here, an intrachromosomal rearrangement between the distal upstream region of r1 and the region of naked endosperm 2 (nkd2) upstream to the third exon generated a nkd2 null allele lacking the first three exons, and the R1-st (stippled) allele with a novel r1 5' promoter region homologous to 5' regions from nkd2-B73. R1-sc:124 (an R1-st derivative) shows increased and earlier expression than a standard R1-g allele, as well as ectopic expression in the starchy endosperm compartment. Laser capture microdissection and RNA sequencing indicated that ectopic R1-sc:124 expression impacted expression of genes associated with RNA modification. The expression of R1-sc:124 resembled nkd2-W22 expression, suggesting that nkd2 regulatory sequences may influence the expression of R1-sc:124. The r1-sc:m3 allele is derived from R1-sc:124 by an insertion of a Ds6 transposon in intron 4. This insertion blocks anthocyanin regulation by causing mis-splicing that eliminates exon 5 from the mRNA. This allele serves as an important launch site for Ac/Ds mutagenesis studies, and two Ds6 insertions believed to be associated with nkd2 mutant alleles were actually located in the r1 5' region. Among annotated genomes of teosinte and maize varieties, the nkd2 and r1 loci showed conserved overall gene structures, similar to the B73 reference genome, suggesting that the nkd2-r1 rearrangement may be a recent event.

Keywords: Zea mays; aleurone; anthocyanin; inversion; kernel.


Conflict of interest statement

The authors declare no conflicts of interest with this research.

Figures

Figure 1
Figure 1
Sequence polymorphisms at the nkd2 locus between purple (R1‐g) and yellow (r1‐sc:m3) W22 variants. (a) No nkd2 transcript is detectable in r1‐sc:m3 endosperm using primers that amplify a product from R1‐g RNA or genomic DNA from either line. GAPDH control RT‐PCR demonstrated intact RNA in each sample. DAP, days after pollination. (b) Gene structure of nkd2 in B73 RefGen_v4 and in W22 R1‐g. Arrows represent intron, gray represents untranslated regions and black coding regions. Purple lines represent PCR products mentioned in (c,d). Orange lines represent sequenced regions of W22 r1‐sc:m3 mapped to the reference nkd2 locus. Parentheses and triangle represent gaps and an insertion, respectively. (c) Agarose gel showing different amplification patterns of 5 nkd2 fragments in the two W22 variants. (d) PCR tests of nkd2 gene integrity suggest that sequences from the 5′ region are not contiguous with 3′ in the r1‐sc:m3 W22 variant. (e) Nanopore long read assembly and alignments of contig #608677 to B73 nkd2. Color‐coded histograms indicate nucleotide conservation, with green bar representing highly conserved regions and red/yellow bar representing diverse regions.
Figure 2
Figure 2
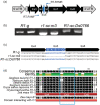
Chromosomal sequences rearranged between the nkd2 and r1 loci. (a) Architecture of the upstream region of nkd2‐B73, R1‐sc and R1‐p. The R1‐sc upstream region showed six blocks based on homology with corresponding regions at nkd2 and R1‐p. Yellow blocks are found in both nkd2 and r1 alleles. Yellow, purple, and blue lines with primer names represent PCR amplicons to test the location, existence or integrity of corresponding regions. (b) Agarose gel showing amplification products from the 5′ regions of different r1 alleles. (c) Alignment of Nanopore long read contig #60167 with R1‐sc promoter and 5′ UTR. Color‐coded histograms indicate nucleotide conservation, with green bars representing identity. (d) The 5′ portion of contig #608677 (Figure 1e), that did not match nkd2, showed homology to sequences located about 11 kb upstream of r1 in B73. This is designated block 7. (e) Inferred chromosome structure in R1‐sc. (f) Agarose gel showing products of PCR with primers Ynkd2F and SeqN2R5 (shown in e) confirming the proximity of block 7 to the nkd2 locus.
Figure 3
Figure 3
Ds insertions at r1 locus. (a) Architecture of r1 locus and Ds6 insertions in r1‐sc:m3 and two alleles originally ascribed as nkd2 mutants, R1‐Ds0766 and r1‐ Ds0297. Red arrows show PCR primers used for detecting Ds elements. Hatch marks denote chromosomal regions that were omitted from the figure for the sake of space. (b) Agarose gel shows PCR amplification products that confirm architecture and insertion sites shown in (a), compared with R1‐g. The primer pairs tested the integrity of nkd2 (N23NF3/N23N), the rearrangement of nkd2 and r1 (Ynkd2F3/Ynkd2R), and the Ds6 insertions in r1‐Ds0766 (nkd2‐F/R and nkd2‐F/W22‐Ds), r1‐Ds0297 (Rst‐F/R and W22‐Ds/Rst‐R), and r1‐sc:m3 (Rsc1‐DsF/R and Rsc1‐DsF/JGp3). (c) Sequences of intron 4 from several r1 alleles at the site of the Ds6 insertion in r1‐sc:m3. R1‐sc:Ds0766, and r1‐sc:Ds0297 contain putative Ds footprints suggesting transposition from this donor site contributed to the promoter insertions.
Figure 4
Figure 4
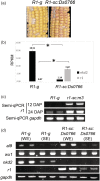
Expression of r1 in lines with R1‐sc:124 derivative alleles. (a) 16 days after pollination (DAP) cobs of purple‐kernel W22 R1‐g versus R1‐sc:Ds0766 at. The R1‐sc allele confers early anthocyanin accumulation. (b) Expression of nkd2 and r1 in W22 R1‐g and R1‐sc:Ds0766 endosperms at 16 DAP. The numbers at the top of bars represent RPKM values. Error bars represent standard error of RPKM, and asterisk marks the significance at P < 0.0001 by Student's t‐test. (c) Semi‐qRT‐PCR testing the expression of r1 in R1‐g and r1‐sc:m3 at 12 and 24 DAP with GAPDH as internal control. (d) Semi‐qRT‐PCR testing expression of R1‐g and R1‐sc:Ds0766, compared with nkd2, in starchy endosperm (SE) compartment versus whole endosperm (WE) at 16 DAP. Marker genes included al9 (AL), ss‐I (SE), and GAPDH (constitutive control).
Figure 5
Figure 5
Ds6 causes mis‐splicing of the r1‐sc:m3 transcript. (a) Architecture of r1 canonical transcript. Blue arrow represents exon 5 (Ex5), which is mis‐spliced out in r1‐sc:m3 transcripts. Thin blue arrows represent a primer pair to amplify the region flanking exon 5. UTR, untranslated region. (b) Agarose gel showing size differences between R1‐g, r1‐sc:m3, and R1‐sc:Ds0766 PCR amplicons from the region containing exon 5 (primer pair RT‐R1MF/RT‐R1MR). (c) Sequence alignment between R1‐g, r1‐sc:m3, and R1‐sc:Ds0766 at the Ex5‐flanking region. Exon 5 is missing from r1‐sc:m3 transcripts. (d) Amino acid sequence conservation at the exon 5 region among R1 homologous proteins from selected grass species and the maize syntelog B1.
Figure 6
Figure 6
Integrity of the nkd2 gene in select r1 alleles and Zea mays genomes. (a) PCR test for the presence of an intact nkd2 gene or the nkd2‐r1 rearrangement in r1 alleles R1‐g, r1‐sc:m3, R1‐st (2‐COOP), R1‐st (Bolivia781), and R1‐mb (Pisccorunto, and R1‐nj. All the R1‐st or ‐mb alleles contained the rearrangement but not R1‐g nor R1‐nj. (b) Alignment of the nkd2 locus among teosinte and maize lines with publicly assembly genome assemblies. All lines appeared to contain an intact nkd2 locus with all the exons.
Figure 7
Figure 7
Laser capture microdissection RNA‐sequencing of R1‐g, r1‐m3, and R1‐sc aleurone (AL) and starchy endosperm (SE). (a,b) Expression of (a) R1 and (b) NKD2 genes in the AL and SE among the three genotypes. Normalized expressed values are measured by transcript per million (TPM). Pairwise t‐test was used to compare means of three biological replicates. Significance levels were marked by single (<0.05), double (<0.01) or triple (<0.001) asterisks and error bars represent standard errors. (c,d) Differentially expressed genes (DEGs) of pair‐wise comparisons among the three genotypes in AL (c) and SE (d). (e) Expression heatmap of selected DEGs by functions among the three genotypes in AL and SE. Overlap of DEGs among the three pairwise comparisons in (f) AL and (g) SE. (h) Number of significant (false discovery rate <0.05) differential splicing events by pairwise genotype comparison. A3SS, alternative 3′ splice site; A5SS, alternative 5′ splice site; AltEnd, alternative end exon; AltStart, alternative start exon; Cassette, skipped exon; Cassette_multi, multiple adjacent cassette exons; IR, intron retention; MXE, mutually exclusive exons.
Figure 8
Figure 8
Summary of the rearrangement between r1 and nkd2 loci. Orange or gold colors represent regions originally associated with nkd2 whereas purple or lavender represents regions from the r1 locus. Dashed lines represent regions that were deleted in the rearrangement. Hatch marks indicate regions that were omitted from the figure for the sake of space. UTR, untranslated region.

Similar articles

References

    1. Abdel‐Latif, A. & Osman, G. (2017) Comparison of three genomic DNA extraction methods to obtain high DNA quality from maize. Plant Methods, 13, 1. - PMC - PubMed
    1. Ahern, K.R. , Deewatthanawong, P. , Schares, J. , Muszynski, M. , Weeks, R. , Vollbrecht, E. et al. (2009) Regional mutagenesis using dissociation in maize. Methods, 49, 248–254. - PubMed
    1. Alleman, M. & Kermicle, J.L. (1993) Somatic variegation and germinal mutability reflect the position of transposable element dissociation within the maize R gene. Genetics, 135, 189–203. - PMC - PubMed
    1. Anders, S. , Pyl, P.T. & Huber, W. (2015) HTSeq‐‐a python framework to work with high‐throughput sequencing data. Bioinformatics, 31, 166–169. - PMC - PubMed
    1. Ashman, R.B. (1960) Stippled aleurone in maize. Genetics, 45, 19–34. - PMC - PubMed

Publication types