

Enhancement of Proteome Coverage by Ion Mobility Fractionation Coupled to PASEF on a TIMS-QTOF Instrument
- PMID: 35876248
- PMCID: PMC10653119
- DOI: 10.1021/acs.jproteome.2c00336
Enhancement of Proteome Coverage by Ion Mobility Fractionation Coupled to PASEF on a TIMS-QTOF Instrument
Abstract
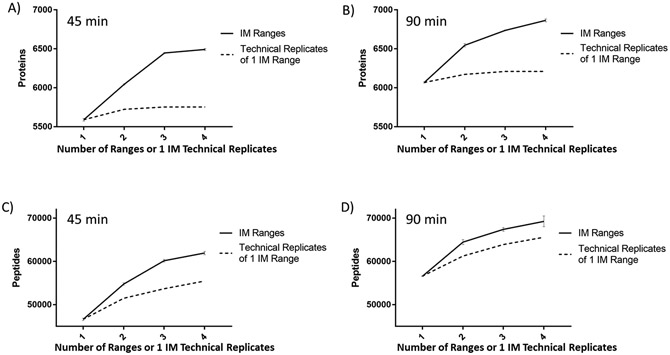
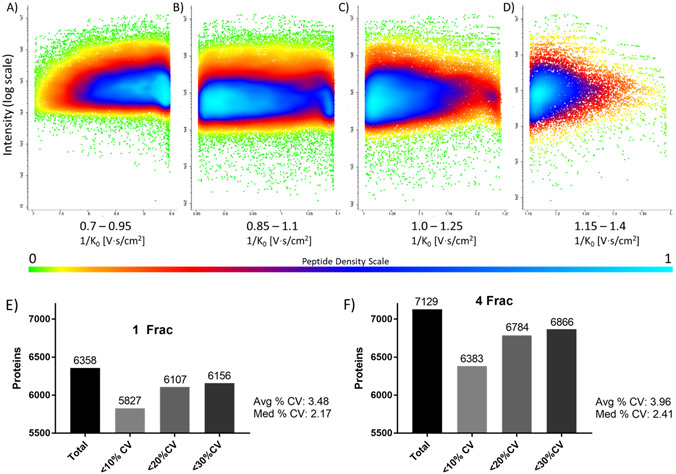
Trapped ion-mobility spectrometry (TIMS) was used to fractionate ions in the gas phase based on their ion mobility (V s/cm2), followed by parallel accumulation-serial fragmentation (PASEF) using a quadrupole time-of-flight instrument to determine the effect on the depth of proteome coverage. TIMS fractionation (up to four gas-phase fractions) coupled to data-dependent acquisition (DDA)-PASEF resulted in the detection of ∼7000 proteins and over 70,000 peptides overall from 200 ng of human (HeLa) cell lysate per injection using a commercial 25 cm ultra high performance liquid chromatography (UHPLC) column with a 90 min gradient. This result corresponded to ∼19 and 30% increases in protein and peptide identifications, respectively, when compared to a default, single-range TIMS DDA-PASEF analysis. Quantitation precision was not affected by TIMS fractionation as demonstrated by the average and median coefficient of variation values that were less than 4% upon label-free quantitation of technical replicates. TIMS fractionation was utilized to generate a DDA-based spectral library for downstream data-independent acquisition (DIA) analysis of lower sample input using a shorter LC gradient. The TIMS-fractionated library, consisting of over 7600 proteins and 82,000 peptides, enabled the identification of ∼4000 and 6600 proteins from 10 and 200 ng of human (HeLa) cell lysate input, respectively, with a 20 min gradient, single-shot DIA analysis. Data are available in ProteomeXchange: identifier PXD033129.
Keywords: DDA-PASEF; DIA-PASEF; gas-phase fractionation; ion mobility; proteomics; spectral library; timsTOF Pro.
Figures


Similar articles
-
Online Parallel Accumulation-Serial Fragmentation (PASEF) with a Novel Trapped Ion Mobility Mass Spectrometer.Mol Cell Proteomics. 2018 Dec;17(12):2534-2545. doi: 10.1074/mcp.TIR118.000900. Epub 2018 Nov 1. Mol Cell Proteomics. 2018. PMID: 30385480 Free PMC article.
-
High-Throughput Mass Spectrometry-Based Proteomics with dia-PASEF.Methods Mol Biol. 2022;2456:15-27. doi: 10.1007/978-1-0716-2124-0_2. Methods Mol Biol. 2022. PMID: 35612732
-
Trapped Ion Mobility Spectrometry and Parallel Accumulation-Serial Fragmentation in Proteomics.Mol Cell Proteomics. 2021;20:100138. doi: 10.1016/j.mcpro.2021.100138. Epub 2021 Aug 17. Mol Cell Proteomics. 2021. PMID: 34416385 Free PMC article. Review.
-
Four-dimensional proteomics analysis of human cerebrospinal fluid with trapped ion mobility spectrometry using PASEF.Proteomics. 2023 May;23(10):e2200507. doi: 10.1002/pmic.202200507. Epub 2023 Feb 19. Proteomics. 2023. PMID: 36752121
-
Eleven shades of PASEF.Expert Rev Proteomics. 2024 Sep-Oct;21(9-10):367-376. doi: 10.1080/14789450.2024.2413092. Epub 2024 Oct 24. Expert Rev Proteomics. 2024. PMID: 39435569 Review.
Cited by
-
[Microbial metaproteomics--From sample processing to data acquisition and analysis].Se Pu. 2024 Jul;42(7):658-668. doi: 10.3724/SP.J.1123.2024.02009. Se Pu. 2024. PMID: 38966974 Free PMC article. Review. Chinese.
-
Uncommon posttranslational modifications in proteomics: ADP-ribosylation, tyrosine nitration, and tyrosine sulfation.Mass Spectrom Rev. 2024 Mar-Apr;43(2):289-326. doi: 10.1002/mas.21811. Epub 2022 Sep 27. Mass Spectrom Rev. 2024. PMID: 36165040 Free PMC article. Review.
-
Deep proteomics reveals incorporation of unedited proteins into mitochondrial protein complexes in Arabidopsis.Plant Physiol. 2024 May 31;195(2):1180-1199. doi: 10.1093/plphys/kiad655. Plant Physiol. 2024. PMID: 38060994 Free PMC article.
-
Deep Proteome Coverage of Microglia Using a Streamlined Data-Independent Acquisition-Based Proteomic Workflow: Method Consideration for a Phenotypically Diverse Cell Type.Proteomes. 2024 Nov 27;12(4):35. doi: 10.3390/proteomes12040035. Proteomes. 2024. PMID: 39728916 Free PMC article.
-
Liquid-phase separations coupled with ion mobility-mass spectrometry for next-generation biopharmaceutical analysis.Expert Rev Proteomics. 2024 May-Jun;21(5-6):259-270. doi: 10.1080/14789450.2024.2373707. Epub 2024 Jul 1. Expert Rev Proteomics. 2024. PMID: 38934922 Free PMC article. Review.
References
-
- Link AJ; Eng J; Schieltz DM; Carmack E; Mize GJ; Morris DR; Garvik BM; Yates JR 3rd, Direct analysis of protein complexes using mass spectrometry. Nat Biotechnol 1999, 17 (7), 676–82. - PubMed
-
- Washburn MP; Wolters D; Yates JR 3rd, Large-scale analysis of the yeast proteome by multidimensional protein identification technology. Nat Biotechnol 2001, 19 (3), 242–7. - PubMed
-
- Spahr CS; Davis MT; McGinley MD; Robinson JH; Bures EJ; Beierle J; Mort J; Courchesne PL; Chen K; Wahl RC; Yu W; Luethy R; Patterson SD, Towards defining the urinary proteome using liquid chromatography-tandem mass spectrometry. I. Profiling an unfractionated tryptic digest. Proteomics 2001, 1 (1), 93–107. - PubMed
-
- Yi EC; Marelli M; Lee H; Purvine SO; Aebersold R; Aitchison JD; Goodlett DR, Approaching complete peroxisome characterization by gas-phase fractionation. Electrophoresis 2002, 23 (18), 3205–16. - PubMed
Publication types
MeSH terms
Substances
Grants and funding
LinkOut - more resources
Full Text Sources
