. 2022 Oct 17;61(42):e202206919.
doi: 10.1002/anie.202206919. Epub 2022 Aug 23.

resPAINT: Accelerating Volumetric Super-Resolution Localisation Microscopy by Active Control of Probe Emission

Affiliations

resPAINT: Accelerating Volumetric Super-Resolution Localisation Microscopy by Active Control of Probe Emission

Edward W Sanders et al. Angew Chem Int Ed Engl. .

Abstract

Points for accumulation in nanoscale topography (PAINT) allows practically unlimited measurements in localisation microscopy but is limited by background fluorescence at high probe concentrations, especially in volumetric imaging. We present reservoir-PAINT (resPAINT), which combines PAINT and active control of probe photophysics. In resPAINT, an activatable probe "reservoir" accumulates on target, enabling a 50-fold increase in localisation rate versus conventional PAINT, without compromising contrast. By combining resPAINT with large depth-of-field microscopy, we demonstrate super-resolution imaging of entire cell surfaces. We generalise the approach by implementing various switching strategies and 3D imaging techniques. Finally, we use resPAINT with a Fab to image membrane proteins, extending the operating regime of PAINT to include a wider range of biological interactions.

Keywords: Biophysics; Localisation Microscopy; PAINT; Single-Molecule Imaging; Super-Resolution Microscopy.


Conflict of interest statement

The authors declare no conflict of interest.

Figures

Figure 1
Figure 1
resPAINT greatly enhances localisation rates for PAINT. a) HILO: 3D SMLM is often performed using highly inclined and laminated optical sheet (HILO) excitation as this allows some optical sectioning. When combined with the DHPSF this enables imaging of a large DOF of up to 4 μm. PALM: PALM uses photoactivation of bound probes for SMLM, which achieves high contrast but finite localisation numbers. PAINT: In PAINT, probes transiently bind to targets, achieving unlimited localisations, although with increased background. resPAINT: With resPAINT, we combine active control of probe emission with PAINT to achieve practically unlimited localisations and high contrast. As probes are non‐fluorescent, much higher concentrations can be used. This concentrates probes on target that can be activated and photobleached to improve localisation rates without increasing the background (k a—association constant, k b—dissociation constant, k s—probe switching constant, k PB—photobleaching constant). b) Representative SMLM time‐series taken on fixed T cells using PAINT (WGA‐AF555, 0.1 nM) and resPAINT (WGA‐PAJF549, 100 nM) showing the increase in rate for similar backgrounds. In the DHPSF a point source appears as a pair of lobes, where the angle between the lobes represents depth. c) Quantification of (b), rates were averaged over 1000 frames and n=5 cells for each condition. Error bars indicate s.d. d) Operational regimes of PAINT and resPAINT with DHPSF imaging for a variety of targets (see Supporting Information Note 1 for details).
Figure 2
Figure 2
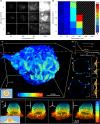
resPAINT for whole‐cell 3D super‐resolution imaging of the cell membrane. a) Representative resPAINT imaging of fixed T cells, using varying photoactivation powers and probe concentrations. b) Quantification of localisation rate in (a), highlighting identified optimal conditions (100 nM, 0.6 W cm−2 activation power). n=5 cells for each condition. The hatched region indicates the area above threshold (background>92 photons). c) 3D super‐resolution image of the membrane of a T cell acquired using resPAINT with PAJF549 and DHPSF. The image comprises 1 400 000 localisations, collected over 200 000 frames per z‐slice at 30 ms exposure time, and was stitched together using four 4 μm z‐slices (3.5 μm steps). The colour represents localisation density within 200 nm radius. The inset cartoon shows the T cell suspended in agarose gel. d) Fourier shell correlation (FSC) estimated isotropic resolution in (c) as 65 nm (1/7 cutoff). e) A y‐x slice of (c) and corresponding line plot (highlighted in white) through the microvilli (width=240 nm). f) As (e) for a y‐z slice (microvilli width=215 nm). g) As in (c), coloured by height, showing 4 rotated views of a T cell that has interacted with a PLL‐coated coverslip. Inset shows a cartoon of surface interactions.
Figure 3
Figure 3
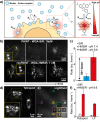
resPAINT using a spontaneously blinking probe. a) Left: Cartoon demonstrating resPAINT using a spontaneously blinking probe. Right: Schematic showing pH dependency of K cyc. b) Representative SMLM time‐series. Top: Fixed T cell imaged with PAINT (WGA‐SiR, 10 pM). Bottom: Another fixed T cell imaged with resPAINT (WGA‐HMSiR, 1 nM, pH 9.6). Display contrast was adjusted individually for each condition to aid interpretation. c) Quantification of localisation rate under background‐matched conditions. d) Representative resPAINT images taken on fixed T cells using the tetrapod PSF. e) Representative resPAINT images taken on fixed T cells using single‐molecule light‐field microscopy, inset shows one molecule viewed from 5 angles. f) Quantification of (d), (e) showing the improvement in localisation rate afforded by resPAINT. n=5 cells for each condition. Error bars indicate s.d.
Figure 4
Figure 4
resPAINT with a Fab. a) Cartoon of resPAINT with a Fab. Inset: schematic of Fab cleaved from antibody that has suitable kinetics for resPAINT. b) Representative SMLM time‐series with fixed T cells using conventional PAINT (Fab‐SiR, 66 pM) and resPAINT (Fab‐HMSiR, 600 nM, pH 9.6). c) Quantification of localisation rate as for PAINT, resPAINT and a mouse cell control. n=5 cells for each condition. Error bars indicate s.d.

References

    1. Thevathasan J. V., Kahnwald M., Cieśliński K., Hoess P., Peneti S. K., Reitberger M., Heid D., Kasuba K. C., Hoerner S. J., Li Y., Wu Y.-L., Mund M., Matti U., Pereira P. M., Henriques R., Nijmeijer B., Kueblbeck M., Sabinina V. J., Ellenberg J., Ries J., Nat. Methods 2019, 16, 1045–1053. - PMC - PubMed
    1. Pavani S. R. P., Piestun R., Opt. Express 2008, 16, 3484–3489. - PubMed
    1. Pavani S. R. P., Thompson M. A., Biteen J. S., Lord S. J., Liu N., Twieg R. J., Piestun R., Moerner W. E., Proc. Natl. Acad. Sci. USA 2009, 106, 2995–2999. - PMC - PubMed
    1. Shechtman Y., Weiss L. E., Backer A. S., Sahl S. J., Moerner W. E., Nano Lett. 2015, 15, 4194–4199. - PMC - PubMed
    1. Sims R. R., Rehman S. A., Lenz M. O., Benaissa S. I., Bruggeman E., Clark A., Sanders E. W., Ponjavic A., Ponjavic A., Ponjavic A., Muresan L., Lee S. F., O'Holleran K., Optica 2020, 7, 1065–1072.

Publication types