

Disrupted and Elevated Circadian Secretion of Glucagon-Like Peptide-1 in a Murine Model of Type 2 Diabetes
- PMID: 35876276
- PMCID: PMC9368029
- DOI: 10.1210/endocr/bqac118
Disrupted and Elevated Circadian Secretion of Glucagon-Like Peptide-1 in a Murine Model of Type 2 Diabetes
Abstract
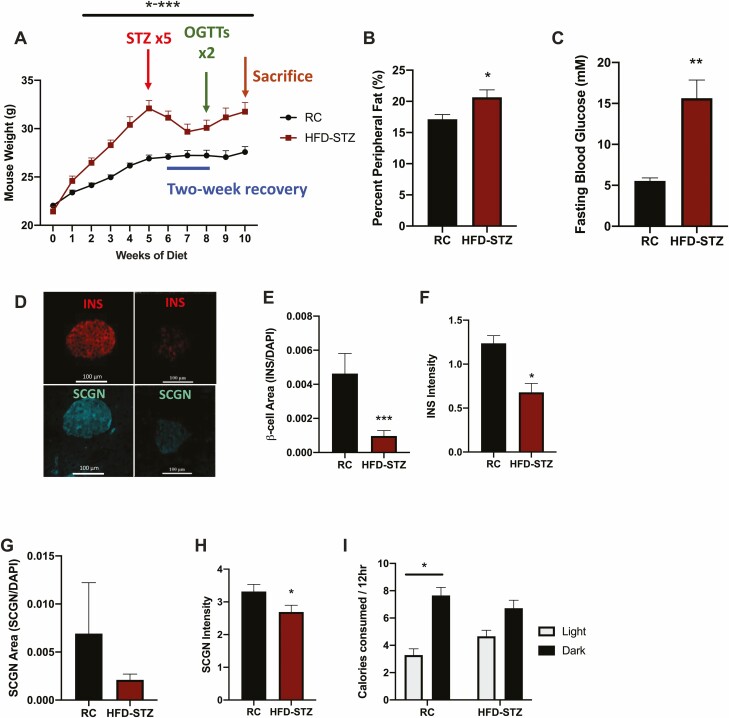
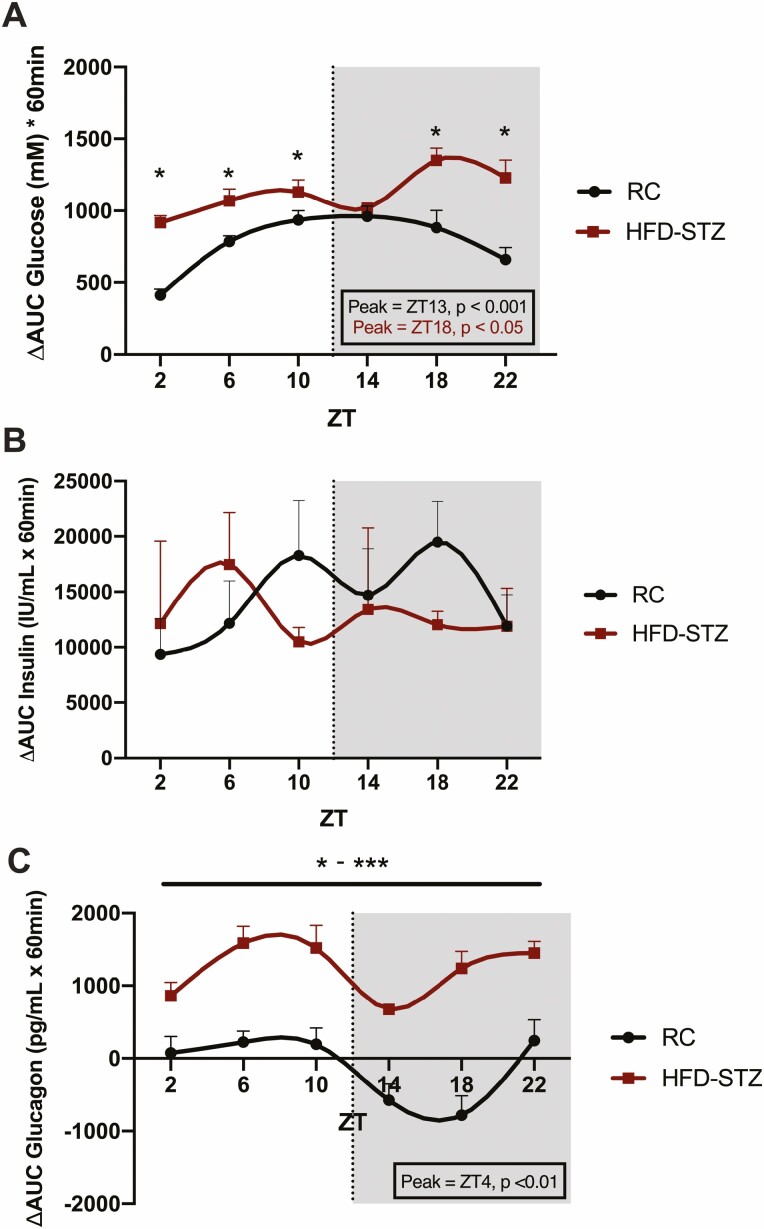
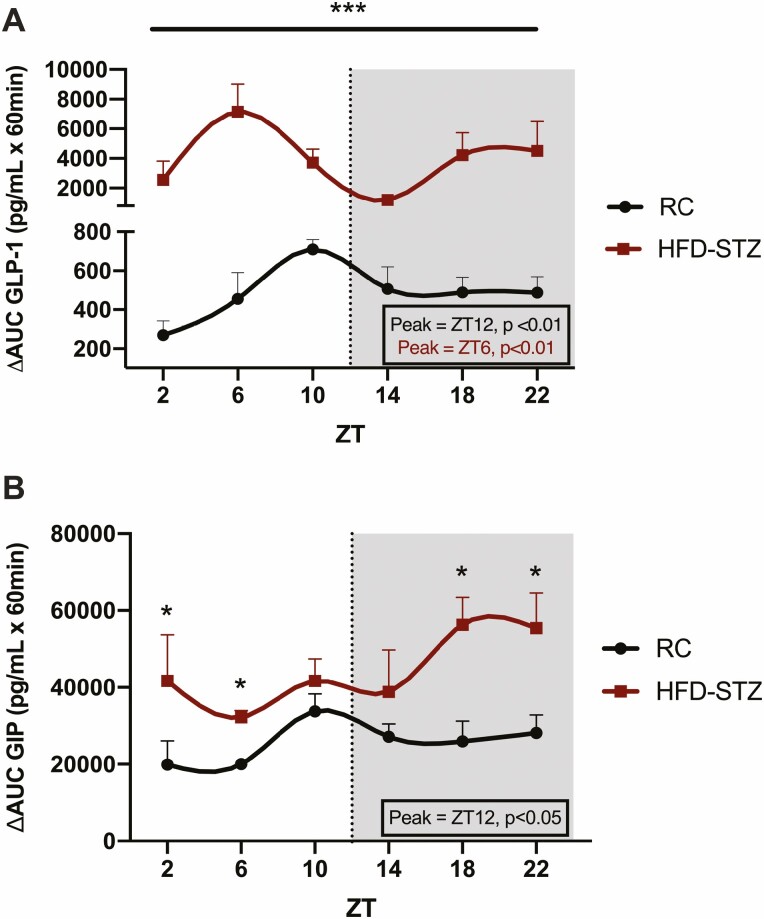
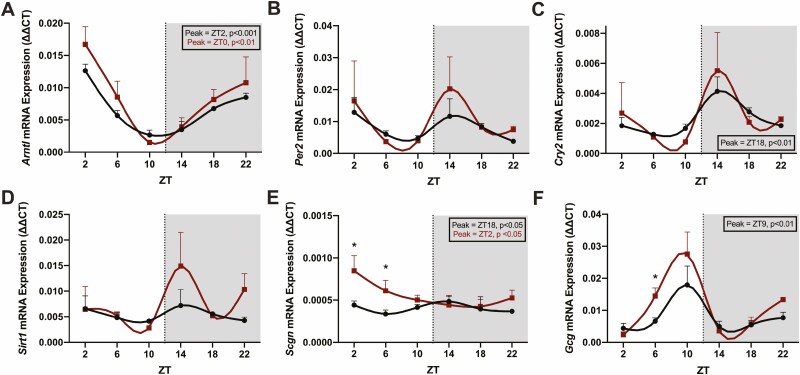
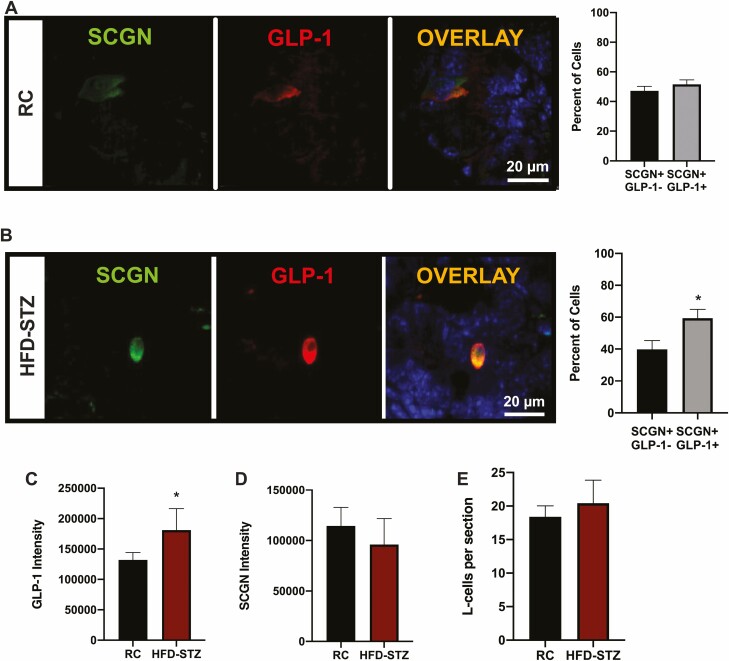
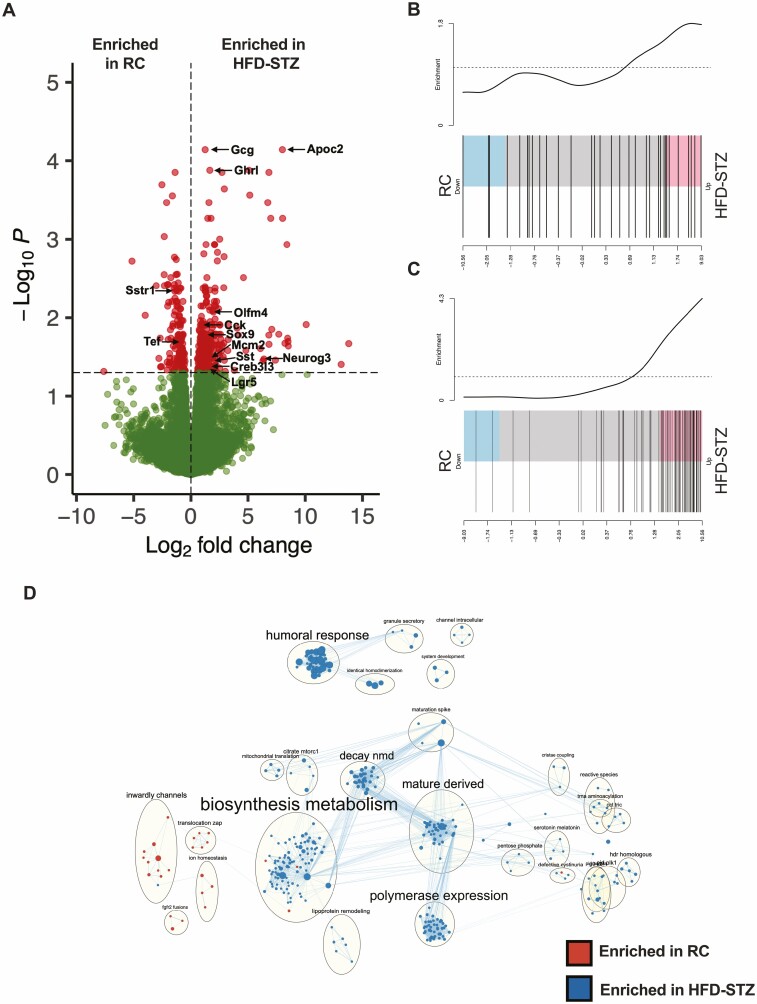
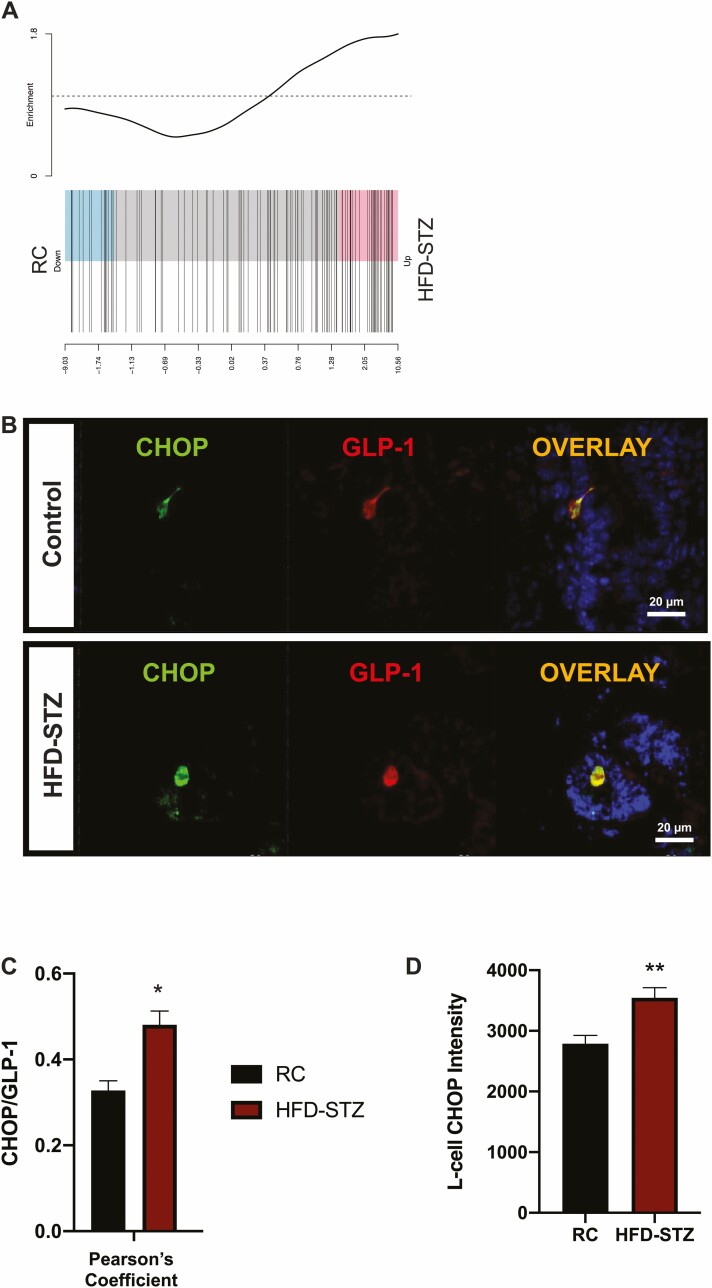
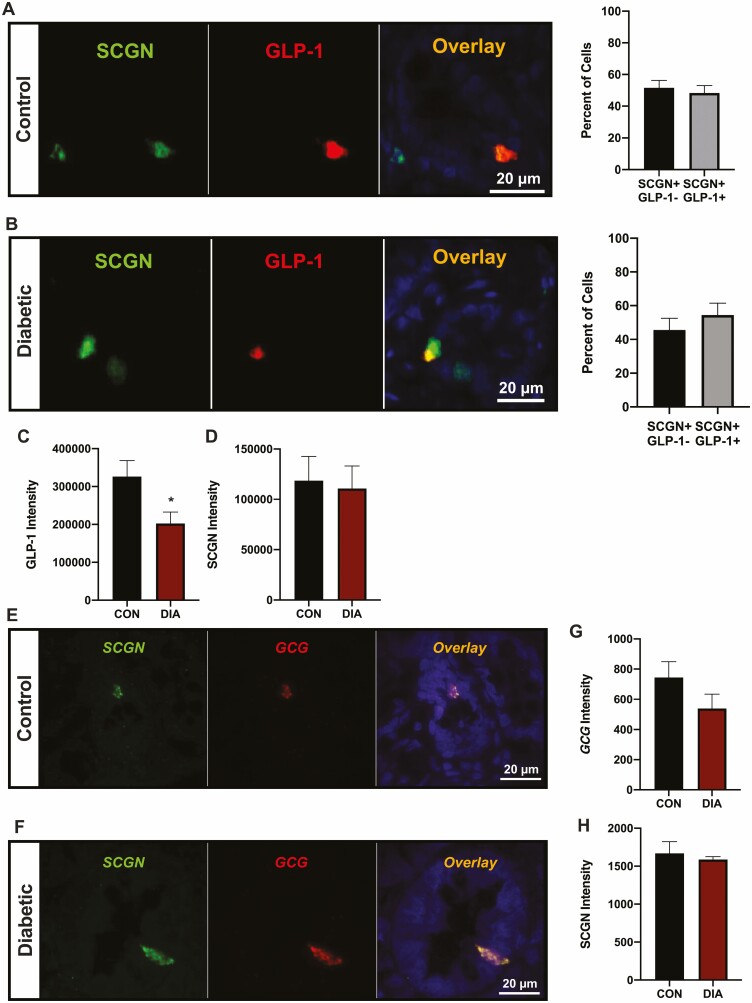
Metabolism and circadian rhythms are intimately linked, with circadian glucagon-like peptide-1 (GLP-1) secretion by the intestinal L-cell entraining rhythmic insulin release. GLP-1 secretion has been explored in the context of obesogenic diets, but never in a rodent model of type 2 diabetes (T2D). There is also considerable disagreement regarding GLP-1 levels in human T2D. Furthermore, recent evidence has demonstrated decreased expression of the β-cell exocytotic protein secretagogin (SCGN) in T2D. To extend these findings to the L-cell, we administered oral glucose tolerance tests at 6 time points in 4-hour intervals to the high-fat diet/streptozotocin (HFD-STZ) mouse model of T2D. This revealed a 10-fold increase in peak GLP-1 secretion with a phase shift of the peak from the normal feeding period into the fasting-phase. This was accompanied by impairments in the rhythms of glucose, glucagon, mucosal clock genes (Arntl and Cry2), and Scgn. Immunostaining revealed that L-cell GLP-1 intensity was increased in the HFD-STZ model, as was the proportion of L-cells that expressed SCGN; however, this was not found in L-cells from humans with T2D, which exhibited decreased GLP-1 staining but maintained their SCGN expression. Gcg expression in isolated L-cells was increased along with pathways relating to GLP-1 secretion and electron transport chain activity in the HFD-STZ condition. Further investigation into the mechanisms responsible for this increase in GLP-1 secretion may give insights into therapies directed toward upregulating endogenous GLP-1 secretion.
Keywords: GIP; GLP-1; diurnal; enteroendocrine; glucose; insulin.
© The Author(s) 2022. Published by Oxford University Press on behalf of the Endocrine Society. All rights reserved. For permissions, please e-mail: journals.permissions@oup.com.
Figures
Similar articles
-
The core clock gene, Bmal1, and its downstream target, the SNARE regulatory protein secretagogin, are necessary for circadian secretion of glucagon-like peptide-1.Mol Metab. 2020 Jan;31:124-137. doi: 10.1016/j.molmet.2019.11.004. Epub 2019 Nov 21. Mol Metab. 2020. PMID: 31918914 Free PMC article.
-
The Cytoskeletal Transport Protein, Secretagogin, Is Essential for Diurnal Glucagon-like Peptide-1 Secretion in Mice.Endocrinology. 2022 Oct 11;163(11):bqac142. doi: 10.1210/endocr/bqac142. Endocrinology. 2022. PMID: 36036556
-
L-cell Arntl is required for rhythmic glucagon-like peptide-1 secretion and maintenance of intestinal homeostasis.Mol Metab. 2021 Dec;54:101340. doi: 10.1016/j.molmet.2021.101340. Epub 2021 Sep 11. Mol Metab. 2021. PMID: 34520858 Free PMC article.
-
Glucose-dependent insulinotropic polypeptide: effects on insulin and glucagon secretion in humans.Dan Med J. 2016 Apr;63(4):B5230. Dan Med J. 2016. PMID: 27034187 Review.
-
The entero-insular axis: implications for human metabolism.Clin Chem Lab Med. 2008;46(1):43-56. doi: 10.1515/CCLM.2008.008. Clin Chem Lab Med. 2008. PMID: 18020966 Review.
Cited by
-
Circadian secretion rhythm of GLP-1 and its influencing factors.Front Endocrinol (Lausanne). 2022 Dec 2;13:991397. doi: 10.3389/fendo.2022.991397. eCollection 2022. Front Endocrinol (Lausanne). 2022. PMID: 36531506 Free PMC article. Review.
References
-
- Campbell JEE, Drucker DJJ. Pharmacology, physiology, and mechanisms of incretin hormone action. Cell Metab. 2013;17(6):819-837. - PubMed
-
- Gil-Lozano M, Mingomataj EL, Wu WK, Ridout SA, Brubaker PL. Circadian secretion of the intestinal hormone GLP-1 by the rodent L cell. Diabetes. 2014;63(11):3674-3685. - PubMed
Publication types
MeSH terms
Substances
Grants and funding
LinkOut - more resources
Full Text Sources
Medical
