

Influence of weighted downhill running training on serial sarcomere number and work loop performance in the rat soleus
- PMID: 35876382
- PMCID: PMC9346294
- DOI: 10.1242/bio.059491
Influence of weighted downhill running training on serial sarcomere number and work loop performance in the rat soleus
Abstract
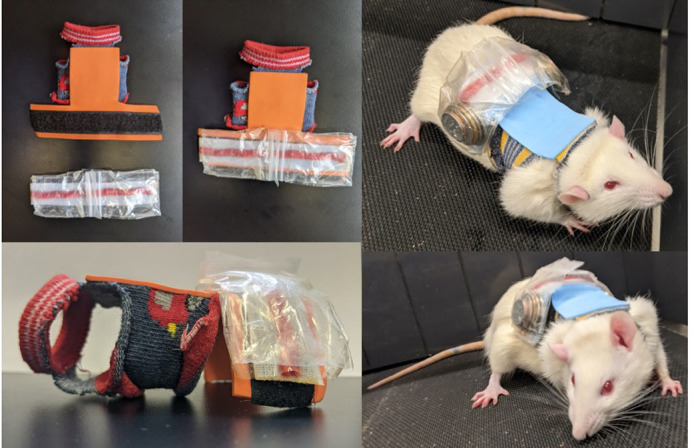
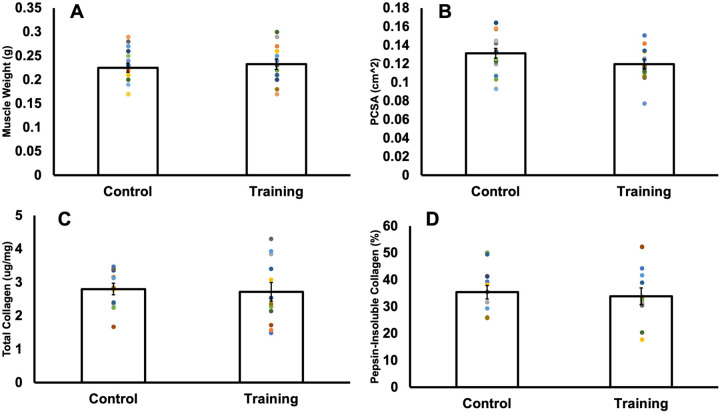
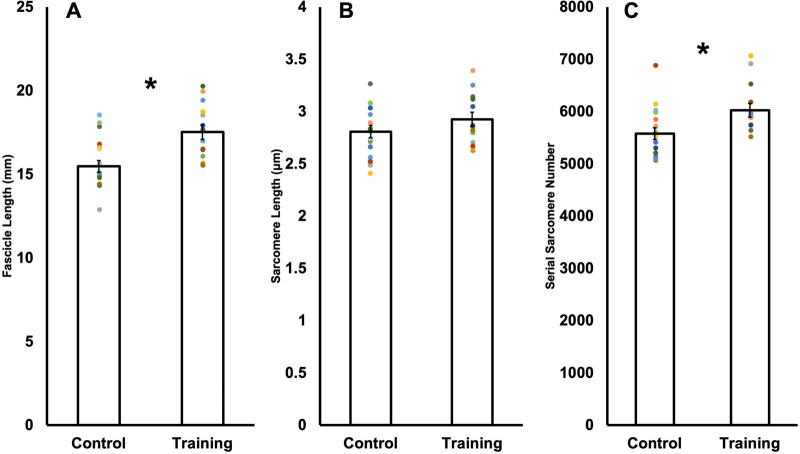
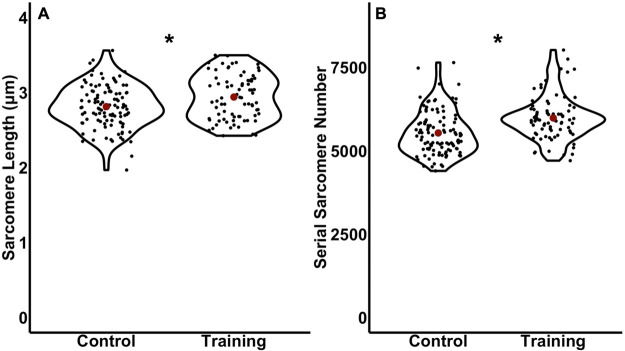
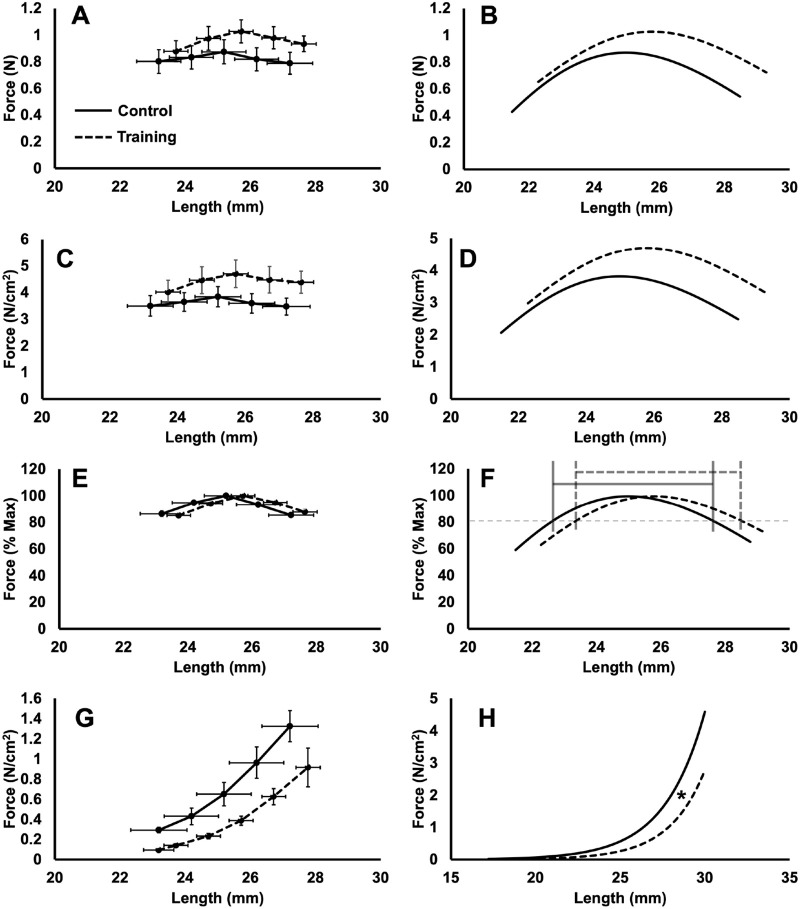
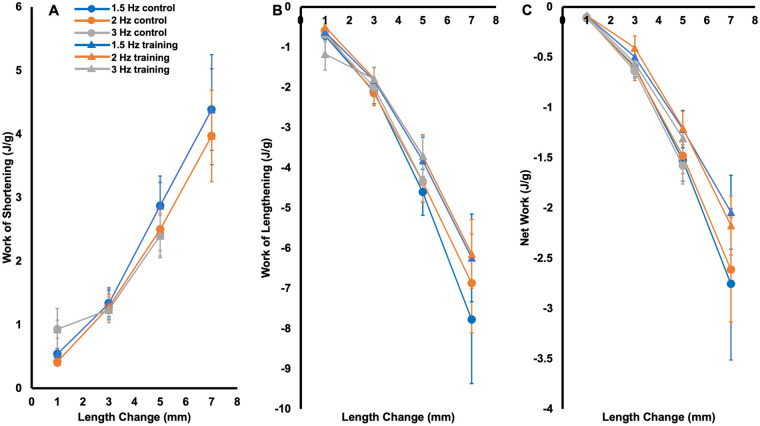
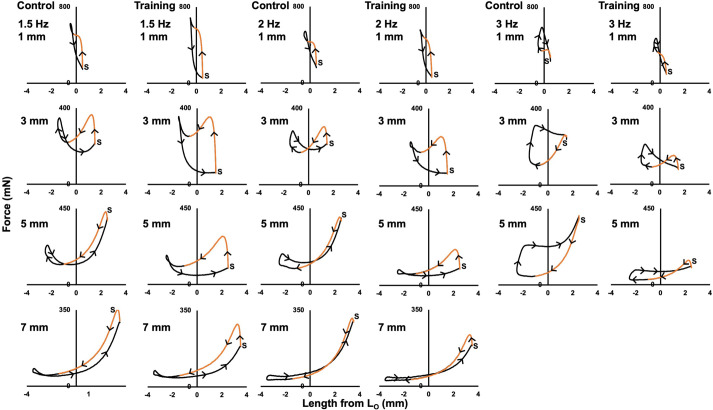
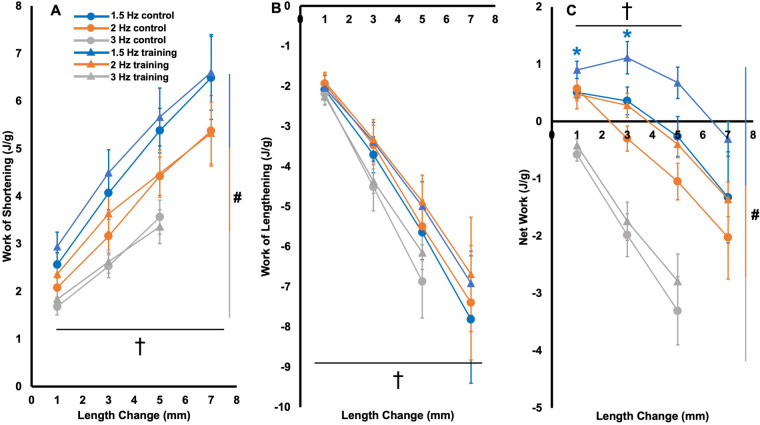
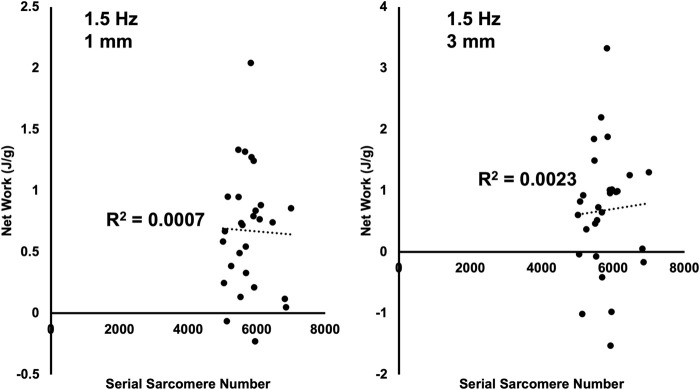
Increased serial sarcomere number (SSN) has been observed in rats following downhill running training due to the emphasis on active lengthening contractions; however, little is known about the influence on dynamic contractile function. Therefore, we employed 4 weeks of weighted downhill running training in rats, then assessed soleus SSN and work loop performance. We hypothesised trained rats would produce greater net work output during work loops due to a greater SSN. Thirty-one Sprague-Dawley rats were assigned to a training or sedentary control group. Weight was added during downhill running via a custom-made vest, progressing from 5-15% body mass. Following sacrifice, the soleus was dissected, and a force-length relationship was constructed. Work loops (cyclic muscle length changes) were then performed about optimal muscle length (LO) at 1.5-3-Hz cycle frequencies and 1-7-mm length changes. Muscles were then fixed in formalin at LO. Fascicle lengths and sarcomere lengths were measured to calculate SSN. Intramuscular collagen content and crosslinking were quantified via a hydroxyproline content and pepsin-solubility assay. Trained rats had longer fascicle lengths (+13%), greater SSN (+8%), and a less steep passive force-length curve than controls (P<0.05). There were no differences in collagen parameters (P>0.05). Net work output was greater (+78-209%) in trained than control rats for the 1.5-Hz work loops at 1 and 3-mm length changes (P<0.05), however, net work output was more related to maximum specific force (R2=0.17-0.48, P<0.05) than SSN (R2=0.03-0.07, P=0.17-0.86). Therefore, contrary to our hypothesis, training-induced sarcomerogenesis likely contributed little to the improvements in work loop performance. This article has an associated First Person interview with the first author of the paper.
Keywords: Collagen; Dynamic performance; Eccentric training; Force-length relationship; Muscle architecture; Sarcomerogenesis.
© 2022. Published by The Company of Biologists Ltd.
Conflict of interest statement
Competing interests The authors declare no competing or financial interests.
Figures
Similar articles
-
Ultrasonographic measurements of fascicle length overestimate adaptations in serial sarcomere number.Exp Physiol. 2023 Oct;108(10):1308-1324. doi: 10.1113/EP091334. Epub 2023 Aug 23. Exp Physiol. 2023. PMID: 37608723 Free PMC article.
-
The influence of training-induced sarcomerogenesis on the history dependence of force.J Exp Biol. 2020 Aug 13;223(Pt 15):jeb218776. doi: 10.1242/jeb.218776. J Exp Biol. 2020. PMID: 32561632
-
Age-related blunting of serial sarcomerogenesis and mechanical adaptations following 4 wk of maximal eccentric resistance training.J Appl Physiol (1985). 2024 May 1;136(5):1209-1225. doi: 10.1152/japplphysiol.00041.2024. Epub 2024 Mar 21. J Appl Physiol (1985). 2024. PMID: 38511212
-
The importance of serial sarcomere addition for muscle function and the impact of aging.J Appl Physiol (1985). 2023 Aug 1;135(2):375-393. doi: 10.1152/japplphysiol.00205.2023. Epub 2023 Jul 6. J Appl Physiol (1985). 2023. PMID: 37410905 Review.
-
The influence of longitudinal muscle fascicle growth on mechanical function.J Appl Physiol (1985). 2022 Jul 1;133(1):87-103. doi: 10.1152/japplphysiol.00114.2022. Epub 2022 May 19. J Appl Physiol (1985). 2022. PMID: 35608202 Review.
Cited by
-
Ultrasonographic measurements of fascicle length overestimate adaptations in serial sarcomere number.Exp Physiol. 2023 Oct;108(10):1308-1324. doi: 10.1113/EP091334. Epub 2023 Aug 23. Exp Physiol. 2023. PMID: 37608723 Free PMC article.
-
Age-related differences in the loss and recovery of serial sarcomere number following disuse atrophy in rats.Skelet Muscle. 2024 Aug 2;14(1):18. doi: 10.1186/s13395-024-00351-5. Skelet Muscle. 2024. PMID: 39095894 Free PMC article.
-
Submaximal eccentric resistance training increases serial sarcomere number and improves dynamic muscle performance in old rats.Physiol Rep. 2024 Oct;12(19):e70036. doi: 10.14814/phy2.70036. Physiol Rep. 2024. PMID: 39362825 Free PMC article.
-
Influence of 4 weeks of downhill running on calcium sensitivity of rat single muscle fibers.Physiol Rep. 2022 Oct;10(19):e15450. doi: 10.14814/phy2.15450. Physiol Rep. 2022. PMID: 36222183 Free PMC article.
-
Collagen architecture and biomechanics of gracilis and adductor longus muscles from children with cerebral palsy.J Physiol. 2024 Jul;602(14):3489-3504. doi: 10.1113/JP285988. Epub 2024 Jun 20. J Physiol. 2024. PMID: 39008710 Free PMC article.
References
Publication types
MeSH terms
Grants and funding
LinkOut - more resources
Full Text Sources
