. 2022 Oct;9(28):e2202014.
doi: 10.1002/advs.202202014. Epub 2022 Jul 25.

Nanodiamond-Quantum Sensors Reveal Temperature Variation Associated to Hippocampal Neurons Firing

Affiliations

Nanodiamond-Quantum Sensors Reveal Temperature Variation Associated to Hippocampal Neurons Firing

Giulia Petrini et al. Adv Sci (Weinh). 2022 Oct.

Erratum in

Abstract

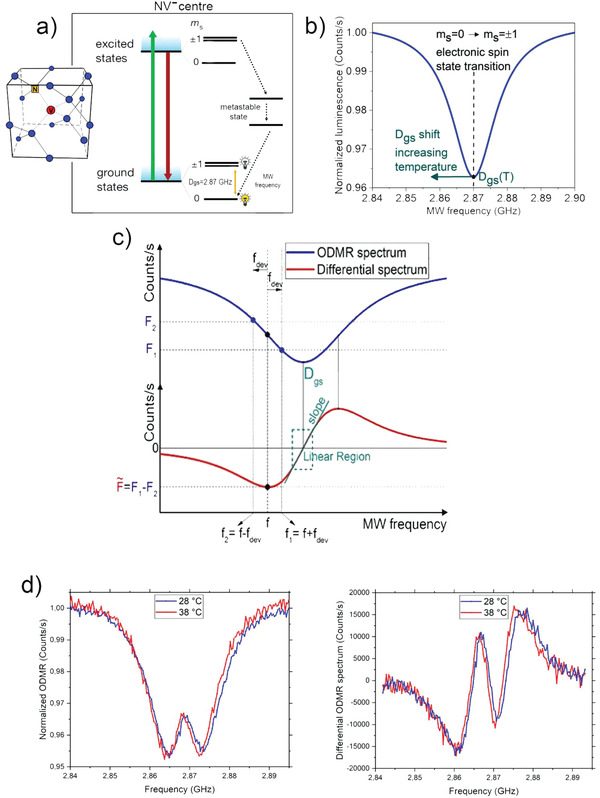
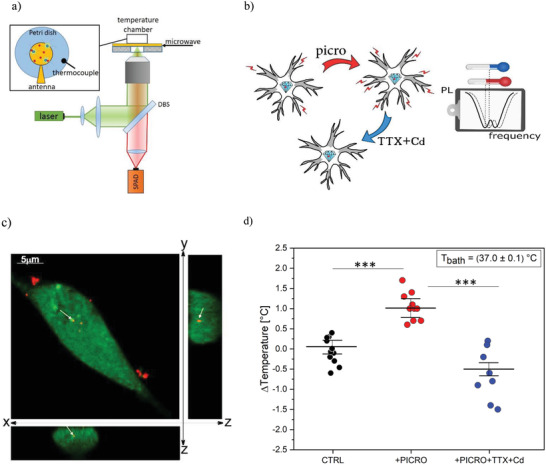
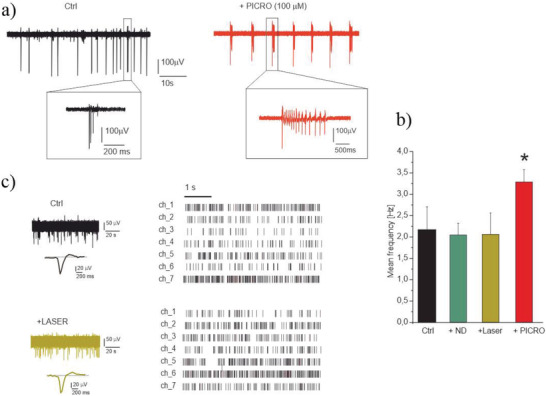
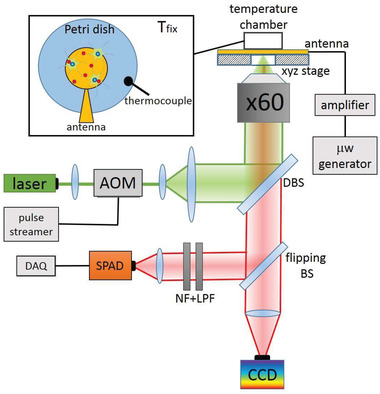
Temperature is one of the most relevant parameters for the regulation of intracellular processes. Measuring localized subcellular temperature gradients is fundamental for a deeper understanding of cell function, such as the genesis of action potentials, and cell metabolism. Notwithstanding several proposed techniques, at the moment detection of temperature fluctuations at the subcellular level still represents an ongoing challenge. Here, for the first time, temperature variations (1 °C) associated with potentiation and inhibition of neuronal firing is detected, by exploiting a nanoscale thermometer based on optically detected magnetic resonance in nanodiamonds. The results demonstrate that nitrogen-vacancy centers in nanodiamonds provide a tool for assessing various levels of neuronal spiking activity, since they are suitable for monitoring different temperature variations, respectively, associated with the spontaneous firing of hippocampal neurons, the disinhibition of GABAergic transmission and the silencing of the network. Conjugated with the high sensitivity of this technique (in perspective sensitive to < 0.1 °C variations), nanodiamonds pave the way to a systematic study of the generation of localized temperature gradients under physiological and pathological conditions. Furthermore, they prompt further studies explaining in detail the physiological mechanism originating this effect.

Keywords: ODMR; intracellular nanoscale sensing; nanodiamonds; nitrogen-vacancy (NV) centers.


Conflict of interest statement

The authors declare no conflict of interest.

Figures

Figure 1
Figure 1
a) NV state transition that occurs after laser excitation and MW excitation. The coupling of the states |m s = ±1>; with the metastable level generates a statistically lower PL emission than the |m s = 0 >. b) PL collected from the NV center as a function of the MW frequency. A dip in correspondence of the zero‐field splitting D gs (resonance frequency of the undisturbed NV center, at room temperature) can be observed. c) Sketch of the differential measurement. From the ODMR spectrum (upper part of the figure) the differential spectrum (lower part of the figure) is derived taking, for every value of the microwave (MW) frequency, the difference F=F1F2 in PL between two points (F 1,F 2) separated by 2fdev. F is zero at the two extremes of the spectrum and at the resonant frequency D gs. Around D gs there is a region where ΔF depends linearly on ΔD gs through the differential spectrum slope. d) Example of ODMR and differential ODMR spectra at two different temperatures.
Figure 2
Figure 2
Illustration of the experiment. a) Simplified scheme of single‐photon confocal ODMR setup. b) The ODMR measurements are performed under control conditions (CTRL), after stimulation with picrotoxin and after the addition of TTX+Cd. The frequency shift in the ODMR spectrum (dashed line) is associated with the temperature variation recorded by the ND sensor. c) Confocal fluorescence micrograph of hippocampal neurons incubated with 0.6 µg mL−1 ND for 5 h. The cytoplasm is stained in green, the red emission is from NDs. The entire field and cross‐sections (XZ and YZ) are shown. White arrows show one internalized ND. d) Boxplot of temperature variations with standard deviations in the presence of saline Tyrode solution (CTRL, black circles), after addition of picrotoxin (PICRO, red circles), after addition of tetrodotoxin and cadmium chloride (TTX+Cd, blue circles), see text for details. Statistical difference is indicated by the asterisks (***, p < 0.0001)
Figure 3
Figure 3
Laser exposure does not affect the hippocampal neurons. a) modulation of the firing activity by PICRO (MEA recordings): representative traces from the same electrode under control condition, + PICRO. Insets: higher magnification of single spikes and bursts. b) Histogram of mean frequency in the different experimental conditions. The statistical difference of PICRO respect to other conditions is indicated (p < 0.05, *). c) Left: Representative traces in control condition and after laser irradiation and (right) corresponding raster plot. In the raster plot, 7 representative channels (ch_1÷ch_7) are shown.
Figure 4
Figure 4
Experimental setup scheme. AOM: acousto‐optic modulator, DBS: dichroic beam splitter, LPF: long‐pass filter, NF: notch filter, DAQ: data acquisition board. SPAD: single‐photon avalanche diode. The cells are cultured on a Petri dish, placed inside an incubator (temperature chamber), which can be moved by means of a three‐axis piezoelectric system (xyz stage). The temperature inside the closed incubation chamber is controlled by a PID and measured by a thermocouple.
Figure 5
Figure 5
Validation of temperature detection by ND sensor. The legend box shows the temperature values recorded by the thermocouple. The box plot shows the temperature values recorded by the ND sensor. The mean and its uncertainty (standard deviation divided by the square root of repeated measurements) are reported as horizontal lines in each data set (N = 10, 60 s acquisition). The starting point is highlighted as an asterisk. The incubator temperature at the end of the cycle is consistent with the initial temperature within the incubator stability (0.1 °C).

Similar articles

Cited by

References

    1. Robert C., Hue I., McGraw S., Gagné D., Sirard M. A., Quantification of Cyclin B1 and P34cdc2 in Bovine Cumulus‐Oocyte Complexes and Expression Mapping of Genes Involved in the Cell Cycle by Complementary DNA Macroarrays, Vol. 67, Sinauer Associates, Inc., Sunderland, MA, 2002, pp. 1456. - PubMed
    1. O'Leary T., Marder E., Curr. Biol. 2016, 26, 2935. - PMC - PubMed
    1. Bui L., Glavinović M. I., Cogn. Neurodyn. 2014, 8, 277. - PMC - PubMed
    1. Margineanu D. G., Schoffeniels E., Proc. Natl. Acad. Sci. USA 1977, 74, 3810. - PMC - PubMed
    1. Howarth J. V., Ritchie J. M., Stagg D., Proc. R. Soc. London, Ser. B 1979, 205, 347. - PubMed

Publication types

LinkOut - more resources