. 2022 Aug 30;13(4):e0148122.
doi: 10.1128/mbio.01481-22. Epub 2022 Jul 25.

The Histidine Kinase CckA Is Directly Inhibited by a Response Regulator-like Protein in a Negative Feedback Loop

Affiliations

The Histidine Kinase CckA Is Directly Inhibited by a Response Regulator-like Protein in a Negative Feedback Loop

Benjamín Vega-Baray et al. mBio. .

Abstract

In alphaproteobacteria, the two-component system (TCS) formed by the hybrid histidine kinase CckA, the phosphotransfer protein ChpT, and the response regulator CtrA is widely distributed. In these microorganisms, this system controls diverse functions such as motility, DNA repair, and cell division. In Caulobacterales and Rhizobiales, CckA is regulated by the pseudo- histidine kinase DivL, and the response regulator DivK. However, this regulatory circuit differs for other bacterial groups. For instance, in Rhodobacterales, DivK is absent and DivL consists of only the regulatory PAS domain. In this study, we report that, in Rhodobacter sphaeroides, the kinase activity of CckA is inhibited by Osp, a single domain response regulator (SDRR) protein that directly interacts with the transmitter domain of CckA. In vitro, the kinase activity of CckA was severely inhibited with an equimolar amount of Osp, whereas the phosphatase activity of CckA was not affected. We also found that the expression of osp is activated by CtrA creating a negative feedback loop. However, under growth conditions known to activate the TCS, the increased expression of osp does not parallel Osp accumulation, indicating a complex regulation. Phylogenetic analysis of selected species of Rhodobacterales revealed that Osp is widely distributed in several genera. For most of these species, we found a sequence highly similar to the CtrA-binding site in the control region of osp, suggesting that the TCS CckA/ChpT/CtrA is controlled by a novel regulatory circuit that includes Osp in these bacteria. IMPORTANCE The two-component systems (TCS) in bacteria in its simplest architecture consist of a histidine kinase (HK) and a response regulator (RR). In response to a specific stimulus, the HK is activated and drives phosphorylation of the RR, which is responsible of generating an adaptive response. These systems are ubiquitous among bacteria and are frequently controlled by accessory proteins. In alphaproteobacteria, the TCS formed by the HK CckA, the phosphotransferase ChpT, and the RR CtrA is widely distributed. Currently, most of the information of this system and its regulatory proteins comes from findings carried out in microorganisms where it is essential. However, this is not the case in many species, and studies of this TCS and its regulatory proteins are lacking. In this study, we found that Osp, a RR-like protein, inhibits the kinase activity of CckA in a negative feedback loop since osp expression is activated by CtrA. The inhibitory role of Osp and the similar action of the previously reported FixT protein, suggests the existence of a new group of RR-like proteins whose main function is to interact with the HK and prevent its phosphorylation.

Keywords: CckA; Osp; Rhodobacter sphaeroides; Roseobacteraceae; bacterial signal transduction; hybrid histidine kinase; two-component systems.


Conflict of interest statement

The authors declare no conflict of interest.

Figures

FIG 1
FIG 1
(A) Isolation of a spontaneous Fla2 mutant + from a non-motile strain (SP20) inoculated on a soft agar plate and incubated for 7 days at 30°C. The arrow indicates the bulge caused by the swimmer cells emerging from the colony. (B) Swimming phenotype of the Fla2+ mutant strain BV6 after purification, as controls strains AM1 and SP20 were included. The AM1 strain expresses the constitutive version of CckA, CckAL391F. The gene encoding this mutant version of CckA is represented as cckA*. Plates containing Sistrom’s minimal medium with 0.1 mM succinic acid as a carbon source were inoculated with cells from a saturated culture and incubated for 60 h. (C) Anti-FlaA Western blot analysis of total cell extracts of strains LC7 (ΔctrA::Hyg) (lane 1), AM1 (lane 2), BV6 to BV9 (lanes 3 to 6). Migration of the molecular mass markers is shown at the right and values expressed in kDa. (D) Transmission electron microscopy of BV6 cells showing the presence of flagella. For the cell on the left, the flagellar filament is indicated with a black arrowhead and an open arrowhead indicates the presence of two flagellar hooks that remain attached to the cell body when the flagellar filament was broken during manipulation.
FIG 2
FIG 2
Swimming plates of mutant strains SP20 (A) and SP13 (B) carrying the osp::Hyg allele. Mutant strains were complemented using plasmid pRK_osp. Control strains carry the empty plasmid pRK415. The AM1 strain expresses the constitutive version of CckA, CckAL391F. The gene encoding this mutant version of CckA is represented as cckA*. Plates containing Sistrom’s minimal medium supplemented with 1 μg mL−1 tetracycline and 0.1 mM succinic acid as a carbon source were incubated for 60 h under photoheterotrophic conditions. The diameter of the swimming rings was determined from at least three independent experiments. For panel A, AM1 = 1.85 cm SD ± 0.11; SP20 = 1.3 cm SD ± 0.04; BV10 = 2.58 cm SD ± 0.12; BV10/pRK_osp = 1.48 cm SD ± 0.05. A significant difference of P < 0.01 for SP20, BV10 and BV10/pRK_osp versus AM1 and BV10 versus BV10/pRK_osp was determined by one-way analysis of variance. For panel B, AM1 = 1.87 cm SD ± 0.03; SP13 = 1.33 cm SD ± 0.14; BV11 = 1.97 cm SD ± 0.05; BV11/pRK_osp = 1.49 cm SD ± 0.19. A significant difference of P < 0.01 for SP13, and BV11/pRK_osp versus AM1; and BV11 versus BV11/pRK_09785 was determined using the same statistical test.
FIG 3
FIG 3
(A) Swimming plate of AM1 and its derivative BV12 (AM1 osp::Hyg) strains carrying an empty plasmid pRK415 or pRK_osp. Plates containing Sistrom’s minimal medium supplemented with 1 μg mL−1 tetracycline and 0.1 mM succinic acid as a carbon source were incubated for 60 h. The diameter of the swimming rings was determined from at least three independent experiments. AM1 = 1.89 cm SD ± 0.06; AM1/pRK_osp = 1.17 cm SD ± 0.05; BV12 = 2.59 cm SD ± 0.28; BV12/pRK_osp = 1.68 cm SD ± 0.24. A significant difference of P < 0.01 for AM1/pRK_osp versus AM1; BV12/pRK_osp versus BV12 and BV12 versus AM1 was determined by one-way analysis of variance. (B) β-glucuronidase activity driven by the chromosomal fusion mcpB::uidA-aadA present in JHV3 was determined from strains carrying pRK415 or pRK_osp. Total cell extracts were obtained from cultures grown photoheterotrophically in Sistrom’s minimal medium supplemented with 0.2% cas amino acids as a carbon source. Activity is expressed as picomoles of methylumbelliferone formed per minute per milligram of protein. A significant difference of P < 0.01 for JHV3/pRK415 versus JHV3/pRK_osp was determined using a two-tailed t test.
FIG 4
FIG 4
(A) Amino acid alignment of Osp and CheY from E. coli. The secondary structure features that conform the canonical structure of typical RRs is shown above and below the amino acid sequences of Osp and CheY. Conserved functional residues present in RRs are boxed in pink. The blue bars represent α-helixes, and yellow arrows β-strands. Secondary structure predictions were obtained using Psipred (84) and protein homology was evaluated using Swiss-Model (85) and the crystal structure of CheY (PDB 6TG7). (B) Swimming plate of BV12 strain carrying pRK_osp or pRK_osp D51N. Strains AM1 and BV12 carrying pRK415 were included as controls. Plates containing Sistrom’s minimal medium supplemented with 1 μg mL−1 tetracycline and 0.1 mM succinic acid as a carbon source were incubated for 60 h. The diameter of the swimming rings was determined from at least three independent experiments, AM1 = 1.82 cm SD ± 0.13; BV12 = 2.5 cm SD ± 0.25; BV12/pRK_osp = 1.64 cm SD ± 0.25; BV12/pRK_osp D51N = 1.12 cm SD ± 0.1. A significant difference of P < 0.01 for BV12/pRK_osp and BV12/pRK_osp D51N versus BV12 was determined by one-way analysis of variance. (C) Genomic context of RSWS8N_09785 (osp). NCBI BLASTP and HHpred (86) analyses for homology detection were performed.
FIG 5
FIG 5
(A) β-glucuronidase activity expressed from the regulatory region of osp fused to the reporter gene uidA, in pRK415. The plasmid carrying this fusion was introduced into strains AM1 and LC7 (ΔctrA::Hyg), and the amount of β-glucuronidase was determined from three independent assays. Cell extracts were obtained from cultures grown heterotrophically (solid filled columns) or photoheterotrophically (pattern filled columns) in Sistrom’s minimal medium containing 15 or 0.1 mM succinic acid as a carbon source. *Activity is expressed as picomoles of methylumbelliferone formed per minute per milligram of protein. Standard deviations are shown. A significant difference of P < 0.01 for LC7/pRK_osp::uidA-aadA versus AM1/pRK_osp::uidA-aadA under all growth conditions was determined by one-way analysis of variance. (B) Sequence of the upstream region of osp showing the putative CtrA-binding site (yellow boxes). The predicted ribosome-binding site is underlined, and the start translation site is shown (pink box). (C) Alignment of the regulatory region of osp in the indicated organisms. The sequences matching with the consensus CtrA-binding site are highlighted in yellow. The translation codon is highlighted in pink. The conserved nucleotides after the CtrA-binding motif are indicated by an asterisk. Conserved nucleotides of the putative -35 and -10 promoter regions are underlined. The possible transcriptional start site is indicated by a curved arrow.
FIG 6
FIG 6
CckA phosphorylation using [γ-32P]ATP in the presence of different concentrations of Osp. (A) 2.5 μM CckA was incubated with increasing concentrations of Osp (0, 2.5 μM, 5 μM and 10 μM) and [γ-32P]ATP for 30 min and subjected to SDS-PAGE. The presence of CckA-32P was detected by phosphorImager visualization (upper part of the figure). The proteins used for the experiment were mixed, and an aliquot was analyzed by SDS-PAGE followed by Coomassie brilliant blue staining (shown below). (B) 2.5 μM CckA was incubated with increasing concentrations of Osp (0, 0.625 μM, 1.25 μM, 2.5 μM, 5 μM, and 10 μM) and [γ-32P]ATP for 30 min the mixture was subjected to SDS-PAGE. Quantification of the amount of CckA phosphorylated in the presence of the indicated concentration of Osp. The images shown correspond to representative experiments from three independent assays.
FIG 7
FIG 7
Phosphorelay reconstitution in the presence or absence of Osp. 2.5 μM of the purified components were mixed and the reaction was initiated by adding [γ-32P]ATP. The presence or absence of the various proteins in the reaction medium is indicated by a plus or a minus symbol. The image shown corresponds to a representative experiment from three independent assays.
FIG 8
FIG 8
Time course assay of CckA dephosphorylation in the absence or presence of Osp. The presence of CckA-32P was detected by phosphorImager visualization. 2.5 μM CckA was phosphorylated and remaining ATP was removed by column-filtration chromatography, the protein was mixed with buffer or with 2.5 μM Osp, and at the indicated time points, samples were analyzed by SDS-PAGE. Quantification of CckA-P is expressed as the ratio between the signal at a determined time divided by the signal at t = 0. The image shown corresponds to a representative experiment from three independent assays. A non-significant difference of P = 0.75 was determined for the slopes of the linear regression curves analyzed by a two-tailed t test.
FIG 9
FIG 9
(A) Effect of the presence of Osp on the phosphorylation reaction of CckAL391F and wild-type CckA. For these experiments, Osp was added at a 1:1 molar ratio to CckA. (B) Effect of Osp on the phosphorelay of the purified proteins CckA/ChpT/CtrA using CckAL391F or wild-type CckA. For this experiment, 2.5 μM each protein was used. (C) 2.5 μM CckA or CckAL391F was incubated with increasing concentrations of Osp (0, 2.5 μM, 5 μM and 10 μM) and [γ-32P]ATP for 30 min and subjected to SDS-PAGE. Quantitation by phosphorImager analysis of the amount of phosphorylated CckA or CckAL391F in the presence of the indicated Osp/CckA molar ratio. The images shown correspond to representative experiments from three independent assays.
FIG 10
FIG 10
(A) Domain architecture of CckA, the domains present in each construct are indicated below. (B) Interaction of Osp with CckA tested by the yeast double hybrid assay. Yeast cells were transformed with the pair of plasmids carrying the DNA binding domain of GAL4 (BD) fused to a CckA domain, and the activation domain (AD) of GAL4 fused to Osp. Under the column labeled BD, the CckA domain cloned in pGBKT7 plasmid is indicated. Protein-protein interactions were evaluated by testing histidine (H) and adenine (A) prototrophy. The letters L, W, H and A indicate the nutrient that is absent in the culture medium. LW indicates the absence of leucine and tryptophan in the culture medium. LWHA indicates the absence of leucine, tryptophan, histidine, and adenine. Positive and negative interactions between Osp and CckA are summarized at the far-right. Below the positive and negative interaction controls represented by GAL4AD-T (simian virus 40 large antigen T) and GAL4BD-Lam (lamin C) (−), and GAL4AD-T and GAL4BD-p53 (+) pairs are shown. The control experiments using AH109 yeast cells expressing the different versions of Gal4BD-CckA and GAL4AD-T (SV40 T-antigen) are shown in Fig. S5.
FIG 11
FIG 11
In vivo pull-down of Osp using His6-CckA. A cell extract obtained from E. coli cells over-expressing only His6-CckA (lane 1); only Osp without a His6X-tag (lane 2); or simultaneously both proteins i.e., His6-CckA and Osp without a His6X-tag (lane 3) were used to purify His6-CckA by affinity chromatography using Ni-NTA-agarose. The purified proteins were subjected to SDS-PAGE and visualized by Coomassie brilliant blue staining. It should be stressed that the over-expression of these proteins was carried out using the T7 promoter cloned upstream of each gene. Migration of the molecular mass markers is shown at the left and expressed in kDa.
FIG 12
FIG 12
Total cell extracts obtained from BV18 cells grown under the indicated conditions, were subjected to SDS-PAGE and tested by Western blotting analysis using anti-FLAG (A) and anti-FlgE (B) antibodies. The growth condition, and the concentration of succinic acid (mM) used as carbon source is indicated below. The migration of the molecular mass markers (kDa) is indicated at the left.
FIG 13
FIG 13
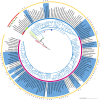
Phylogenetic distribution of osp in Rhodobacterales. Species phylogeny based on RpoC, the tree was generated by the neighbor joining method using clustal simple phylogeny and edited with iTOL. From inside to outside, color of the branches indicates the Order: Caulobacterales (red), Maricaulales (purple); Hyphomonadales (green), Rhodobacterales (blue). Circle below the species name indicates the Family: Caulobacteraceae (red), Maricaulaceae (purple), Hyphomonadaceae (green), Rodobacteraceae (blue), and Roseobacteraceae (magenta). In the circle depicting the species names, the presence of Osp is indicated by a blue background. The presence of DivK is represented by green squares above the species names, the presence of a long DivL (red) or a short DivL (yellow). The stars represent the presence of a putative CtrA-binding site in the regulatory region of osp. Green dot possible point of DivK loss, pink dot truncation of DivL (short DivL), blue dot represents earliest possible appearance of Osp. Complete information for each species, the GenBank accession number for each genome, the accession number for RpoC, Osp, and DivK are included in Table S2.

Similar articles

Cited by

References

    1. Gao R, Stock AM. 2009. Biological insights from structures of two-component proteins. Annu Rev Microbiol 63:133–154. doi:10.1146/annurev.micro.091208.073214. - DOI - PMC - PubMed
    1. Laub MT, Goulian M. 2007. Specificity in two-component signal transduction pathways. Annu Rev Genet 41:121–145. doi:10.1146/annurev.genet.41.042007.170548. - DOI - PubMed
    1. Buschiazzo A, Trajtenberg F. 2019. Two-component sensing and regulation: how do histidine kinases talk with response regulators at the molecular level? Annu Rev Microbiol 73:507–528. doi:10.1146/annurev-micro-091018-054627. - DOI - PubMed
    1. Brilli M, Fondi M, Fani R, Mengoni A, Ferri L, Bazzicalupo M, Biondi EG. 2010. The diversity and evolution of cell cycle regulation in alpha-proteobacteria: a comparative genomic analysis. BMC Syst Biol 4:52. doi:10.1186/1752-0509-4-52. - DOI - PMC - PubMed
    1. Quon KC, Marczynski GT, Shapiro L. 1996. Cell cycle control by an essential bacterial two-component signal transduction protein. Cell 84:83–93. doi:10.1016/s0092-8674(00)80995-2. - DOI - PubMed

Publication types