

LINC00839 promotes colorectal cancer progression by recruiting RUVBL1/Tip60 complexes to activate NRF1
- PMID: 35876654
- PMCID: PMC9442307
- DOI: 10.15252/embr.202154128
LINC00839 promotes colorectal cancer progression by recruiting RUVBL1/Tip60 complexes to activate NRF1
Abstract
The long noncoding RNA LINC00839 has been shown to be involved in the progression of some cancer types, such as bladder cancer, prostate cancer, breast cancer, and neuroblastoma. However, if LINC00839 has roles in colorectal cancer (CRC), it has not been elucidated so far. Here, we focus on the biological role and involved mechanisms of LINC00839 in CRC. We show that LINC00839 is selectively upregulated in CRC and locates to the nucleus. High expression of LINC00839 is associated with poor outcomes in CRC patients. Functional experiments show that LINC00839 promotes CRC proliferation, invasion, and metastasis in vitro and in vivo. Mechanistically, LINC00839 recruits Ruvb1 to the Tip60 complex and increases its acetylase activity. LINC00839 guides the complex to the NRF1 promoter and promotes acetylation of lysines 5 and 8 of histones H4, thereby upregulating the expression of NRF1. Subsequently, NRF1 activates mitochondrial metabolism and biogenesis, thereby promoting CRC progression. In summary, our study reports on a mechanism by which LINC00839 positively regulates NRF1, thus promoting mitochondrial metabolism and biogenesis, as well as CRC progression.
Keywords: LINC00839; NRF1; OXPHOS; Tip60 complex; histone acetylation.
© 2022 The Authors.
Figures
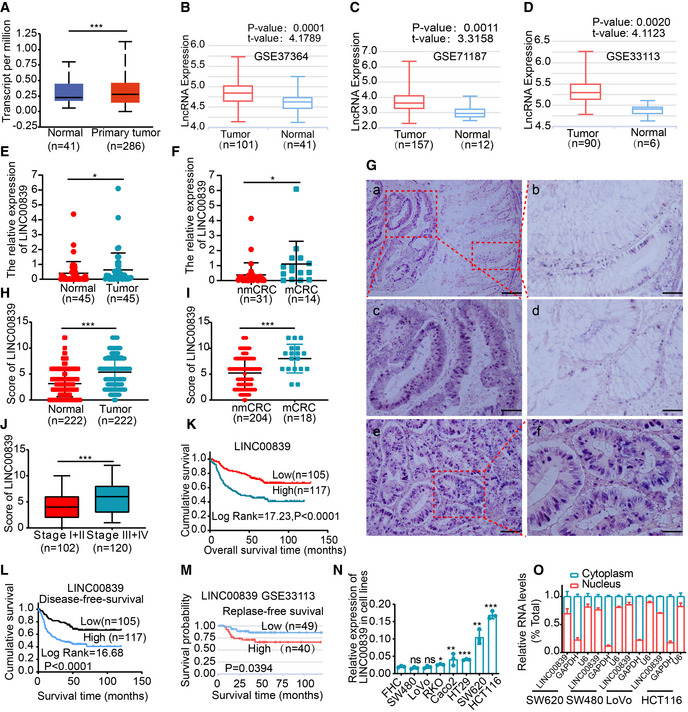
- A
The expression of LINC00839 in CRC tissues and normal mucosa tissues in the UALCAN database.
- B–D
The expression of LINC00839 in unpaired CRC and normal samples in the LnCAR database (GSE37364, GSE71187, and GSE33113).
- E, F
The expression levels of LINC00839 in tumor tissues and NATs from the CRC cohort (n = 45). nmCRC denotes CRC patients without metastases, and mCRC denotes CRC patients with metastases.
- G
Representative ISH staining of LINC00839 in paraffin‐embedded samples of CRC tumor tissues and NATs. (a) Expression of LINC00839 in tumor tissues and NATs. Scale bars, 100 μm. (b) Magnification of normal mucosal area and (c) magnification of the tumor area. Scale bars, 50 μm. (d) Weakly positive staining of LINC00839 in normal mucosa. Scale bars, 50 μm. (e) Strong positive staining of LINC00839 in tumors and (f) magnification of the local area. Scale bars, 100 μm.
- H
The expression score of the tumors and NATs in the ISH cohort (n = 222).
- I
Differential expression of LINC00839 in nonmetastatic CRC patients (nmCRC) and metastatic CRC patients (mCRC).
- J
Expression of LINC00839 in CRC patients with early‐stage (stage I and II) and advanced‐stage (stage III and IV) disease.
- K, L
Kaplan–Meier analysis of overall survival and disease‐free survival rate of the ISH CRC cohort.
- M
Kaplan–Meier analysis of the disease‐free survival rate of CRC patients in the LnCAR database (GSE33113).
- N
The expression of LINC00839 in a colon mucosa epithelial cell line (FHC) and CRC cell lines.
- O
The subcellular localization was determined by nucleocytoplasmic fractionation of several CRC cell lines.
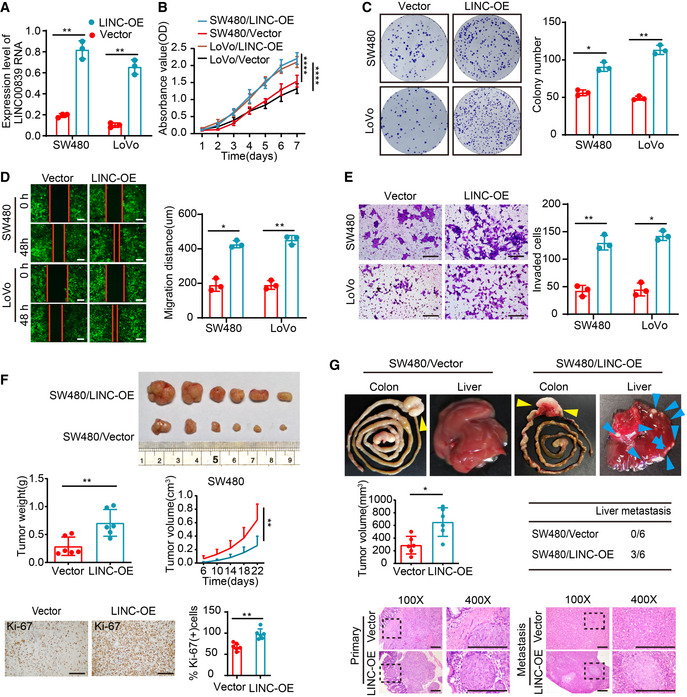
- A
Overexpression of LINC00839 in SW480 and LoVo cells was confirmed by qPCR (mean ± SD, Student's t‐test, n = 3 technical replicates).
- B
The proliferation of LINC00839‐overexpressing cells was determined by CCK8 assay (mean ± SD, ANOVA, n = 3 biological replicates).
- C
Colony formation assay was performed with LINC00839‐overexpressing cells and vector control cells.
- D
Wound‐healing assay was performed with LINC00839‐overexpressing cells and vector control cells. Scale bars, 100 μm.
- E
Matrigel invasion assay was performed with LINC00839‐overexpressing cells. Scale bars, 100 μm.
- F
The CDX model showing the effect of LINC00839 on tumor growth. Representative image of tumors harvested from the mouse model (upper panel), the quantitative analysis of tumor weight and tumor volume (medium panel), and representative images and quantification of IHC staining of Ki‐67 in tumors (bottom panel; n = 6 for each cohort, and the results are presented as the mean ± SD, Student's t‐test (medium
left and low right panel) and ANOVA (medium right). Scale bars, 100 μm (n = 6 biological replicates). - G
The CRC orthotopic mouse model revealed the effect of LINC00839 on tumor development. Representative images of primary tumors (yellow arrowheads) and liver metastasis (blue arrowheads) in the model (upper panel), analysis of tumor volume and the number of mice with liver metastasis (medium panel), and H&E staining of tumors and metastases (n = 6 for each cohort). Scale bars, 100 μm (n = 6 biological replicates).
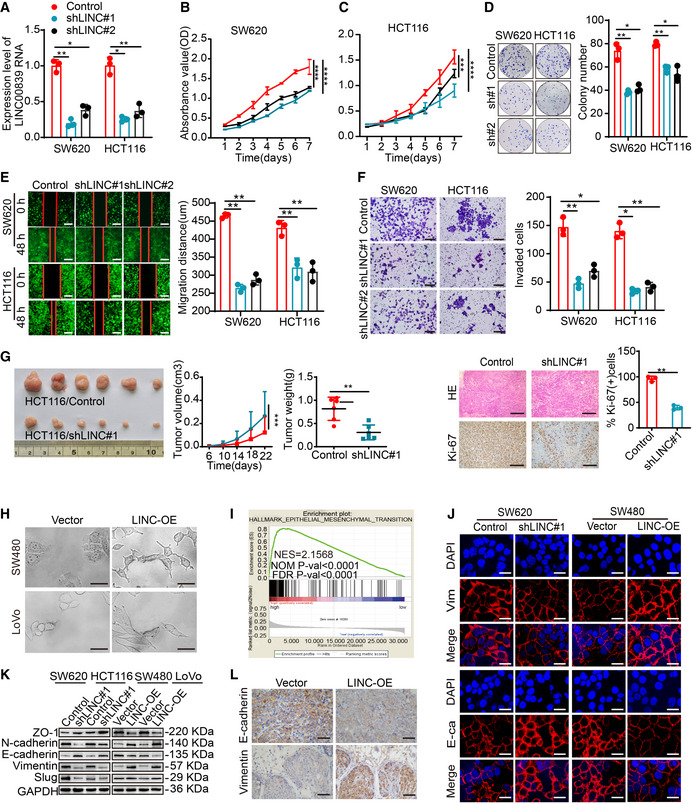
- A
Knockdown of LINC00839 was confirmed in SW620 and HCT116 cells by qPCR (mean ± SD, Student's t‐test, n = 3 technical replicates).
- B, C
Cell proliferation was measured by CCK8 assay in LINC00839‐knockdown SW620 and HCT116 cells (mean ± SD, ANOVA, n = 3 biological replicates).
- D
Colony formation was assessed in LINC00839‐knockdown SW620 and HCT116 cells.
- E
Wound‐healing assay was performed with LINC00839‐knockdown cells and control cells. Scale bars, 100 μm.
- F
Matrigel invasion assay was performed with LINC00839‐knockdown HCT116 and SW620 cells. Scale bars, 100 μm.
- G
The CDX model revealed the effect of LINC00839 on tumor growth. Representative image of tumors harvested from the mouse model (left panel), quantitative analysis of tumor weight and tumor volume (medium panel), and representative images and quantification of IHC staining of Ki‐67 in tumor tissues (left panel; n = 6 for each cohort; the results are presented as the mean ± SD and were analyzed by Student's t‐test (medium and right panel) and ANOVA (left panel)). Scale bars, 100 μm (n = 6 biological replicates).
- H
Cells overexpressing LINC00839 exhibited EMT‐like cell morphology: most cells lost their epithelial characteristics and exhibited a spindle‐shaped and fibroblast‐like morphology. Scale bars, 10 μm.
- I
GSEA showed the enrichment of epithelial–mesenchymal transition (EMT) signatures in the high HCT116 and SW620 cells expression group (TCGA cohort).
- J
IF staining of E‐cadherin and Vimentin in LINC00839‐overexpressing and LINC00839‐knockdown cells. Scale bars, 10 μm.
- K
Epithelial and mesenchymal marker expression in LINC00839‐overexpressing and LINC00839‐knockdown cells was measured by WB.
- L
Representative images of IHC staining of Vimentin and E‐cadherin in tumors from the orthotopic implantation model. Scale bars, 200 μm.
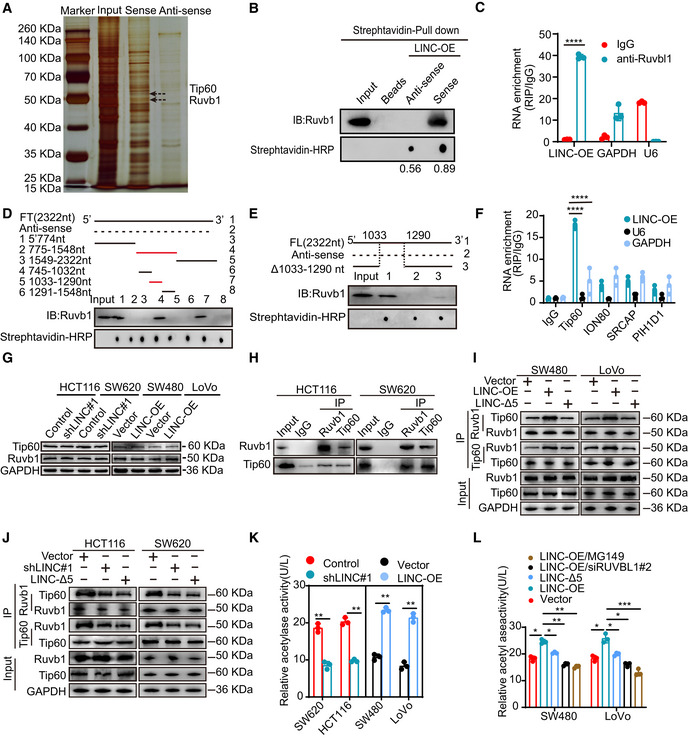
- A
An RNA pull‐down assay was performed to identify proteins that bind to LINC00839 in HCT116 cells.
- B
RNA pull‐down assay and WB showed that biotinylated LINC00839 can bind to Ruvb1 in HCT116 cells. Dot blot of RNA–protein interactions indicating equal amounts of RNA used in the assay.
- C
RIP experiments were performed to confirm the binding of LINC00839 to Ruvb1. IgG was used as a negative control antibody. Primers specific for U6 and GAPDH were used as negative control primers.
- D
Different fragments of LINC00839 (solid line) and its antisense sequence (dotted line) were used for the RNA pull‐down assay and the subsequent WB.
- E
Full‐length LINC00839, antisense sequence of LINC00839, and LINC00839 sequence lacking nucleotides 1,033–1,290 were used for the RNA pull‐down assay and the subsequent WB.
- F
RIP experiments were performed by incubating Tip60, INO80, SRCAP, and PIH1D1 antibodies with HCT116 cell lysates.
- G
The effect of LINC00839 on the expression of Tip60 and Ruvb1 was determined by WB.
- H
Interaction of endogenous Ruvb1 and Tip60 in CRC cells was confirmed by Co‐IP.
- I
The interaction between Ruvb1 and Tip60 in cells overexpressing wild‐type LINC00839 and LINC‐Δ5 was confirmed by Co‐IP.
- J
The interaction between Ruvb1 and Tip60 in LINC00839‐KD cells and cells expressing LINC‐Δ5 was confirmed by Co‐IP.
- K
Acetylase activity assays were performed with LINC00839‐overexpressing and LINC00839‐knockdown cells.
- L
Acetylase activity was measured in SW480 and LoVo cells subjected to different treatments.
- A
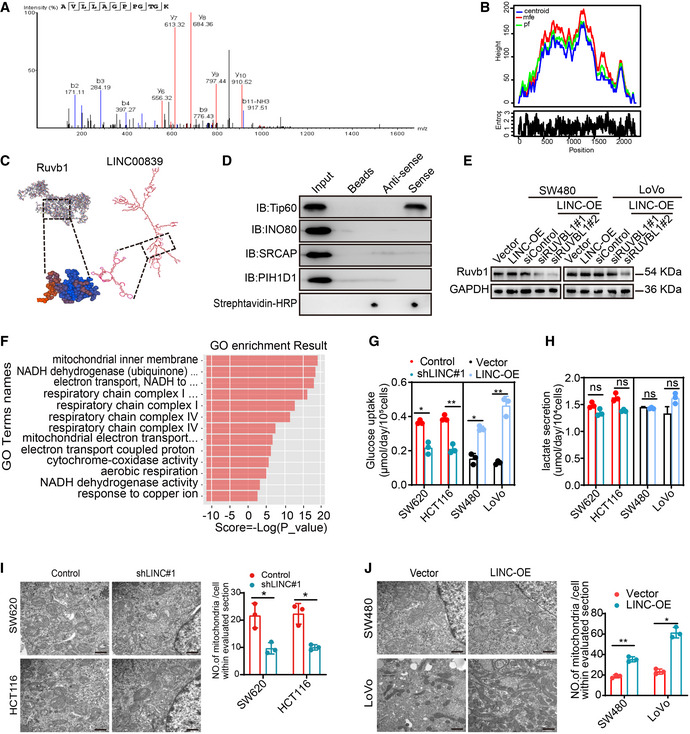
Ruvb1 was identified by LC–MS.
- B
The peak diagram of the centroid structure of LINC00839 was predicted by RNAfold.
- C
Pattern of the structure of LINC00839 and Ruvb1 and their binding.
- D
RNA pull‐down and WB assays were performed to confirm the specific interaction between some large multiprotein complexes and LINC00839. Dot blot of RNA–protein binding samples indicating that equal amounts of RNA were used in the assay.
- E
The Ruvb1 knockdown efficiency was confirmed by WB.
- F
GO enrichment analysis of the DEGs identified in the RNA‐seq.
- G
Glucose intake by LINC00839‐overexpressing cells and LINC00839‐KD cells was determined.
- H
Lactate secretion by LINC00839‐overexpressing cells and LINC00839‐KD cells was measured.
- I, J
The number of mitochondria in LINC00839‐knockdown cells and LINC00839‐overexpressing cells as confirmed by TEM. Scale bars, 500 nm.
- A
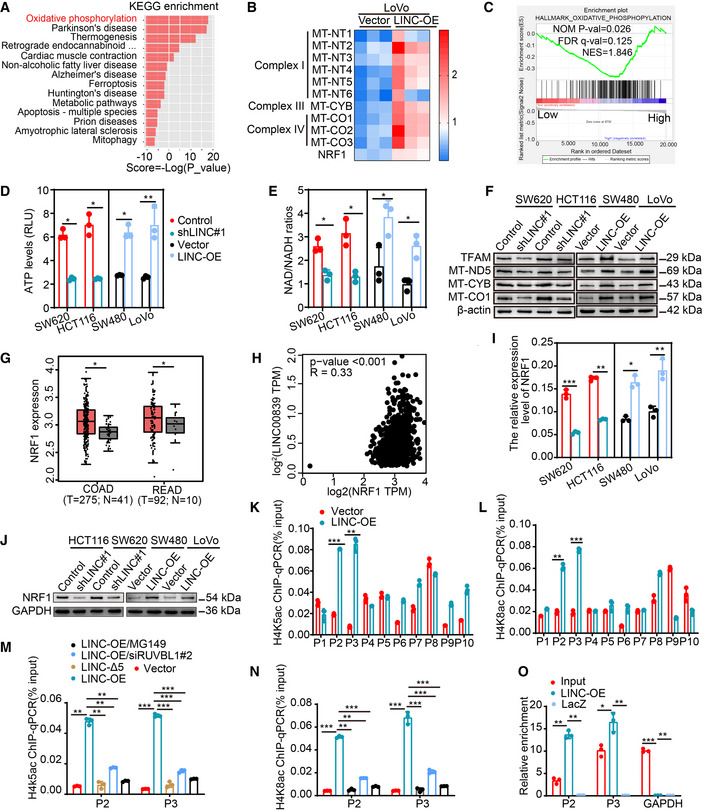
KEGG pathway analysis of the DEGs identified by RNA‐seq.
- B
Heatmap of DEGs related to OXPHOS and mitochondrial biogenesis. Expression levels are shown in log2 scale of normalized intensity values (see color gradient) ranging from low (blue) to high (red) expression.
- C
GSEA of LINC00839 in the OXPHOS pathway (GSE14333).
- D, E
The ATP levels and the NAD/NADH ratio were measured in LINC00839‐overexpressing and LINC00839‐KD cells (mean ± SD, Student's t‐test, n = 3 biological replicates).
- F
Expression of MT‐ND5, MT‐CYB, MT‐CO1, and TFAM in LINC00839‐overexpressing and LINC00839‐KD cells as determined by WB.
- G
Analysis of NRF1 expression in CRC tissues (T) and normal tissues (N) in the GEPIA database.
- H
Correlation analysis of LINC00839 and NRF1 mRNA levels in the TCGA and GTEx databases (Pearson).
- I, J
Expression of NRF1 in LINC00839‐overexpressing and LINC00839‐KD cells was measured by qPCR and WB.
- K, L
The enrichment of the NRF1 promoter (P1‐P10) by H4K5ac and H4K8ac antibodies in LINC00839‐overexpressing and control LoVo cells as determined by CHIP assay. Normal IgG was used as a negative control.
- M, N
The enrichment of the P2 and P3 fragments by H4K5ac and H4K8ac antibodies in LoVo cells as determined by CHIP assay. Normal IgG was used as a negative control.
- O
The enrichment of NRF1 with a probe targeting LINC00839 relative to a NC probe in HCT116 cells, as determined by ChIRP assay. LacZ served as a negative control (NC).
- A
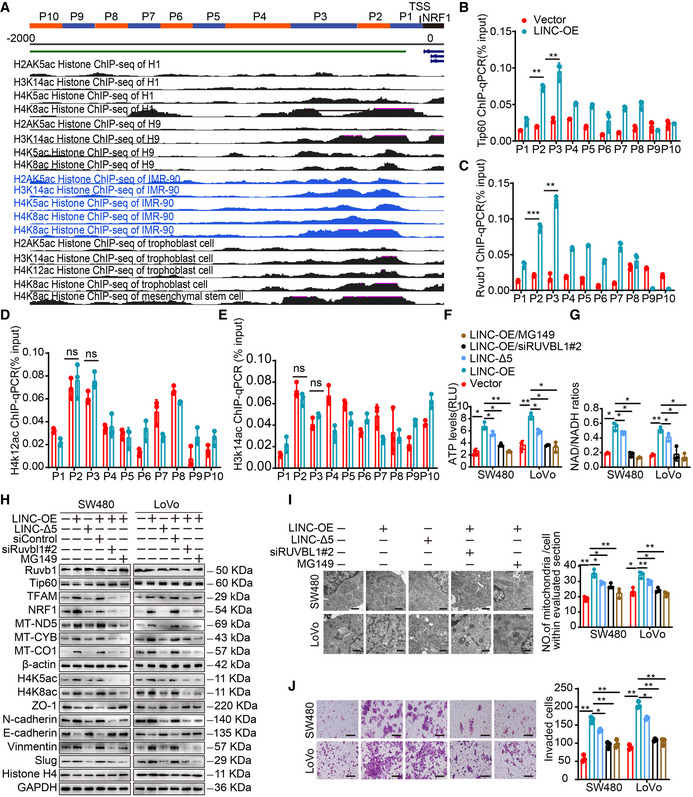
The pattern of 10 NRF1 promoter fragments (upper panel) and ChIP‐seq uniform peaks in the NRF1 promoter region was analyzed by ENCODE projects and visualized by UCSC Genome Browser (bottom panel).
- B–E
The enrichment of the NRF1 promoter (P1‐P10) by Tip60 (B), Ruvb1 (C), H4K12ac (D), and H3K14ac (E) antibodies in LINC00839‐overexpressing and control LoVo cells as determined by CHIP assay. Normal IgG was used as a negative control.
- F, G
ATP levels and NAD/NADH ratios in SW480 and LoVo cells were measured.
- H
Expression of genes related to mitochondrial biogenesis and EMT in SW480 and LoVo cells as determined by WB.
- I
The number of mitochondria in SW480 and LoVo cells was confirmed by TEM. Scale bars, 500 nm.
- J
Invasion of SW480 and LoVo cells was assessed by Matrigel invasion assay. Scale bars, 100 μm.
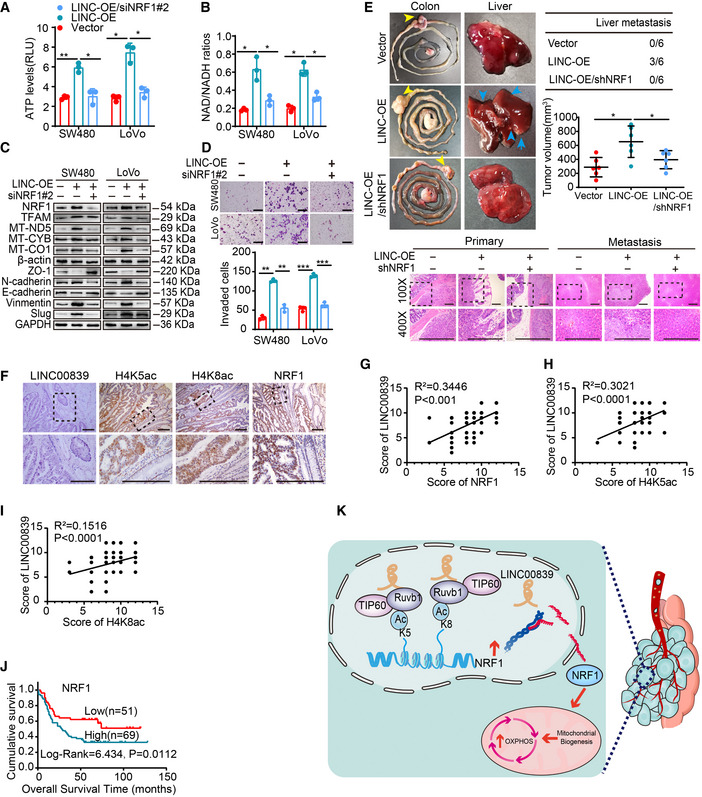
- A, B
ATP levels and NAD/NADH ratios were measured in SW480 and LoVo cells.
- C
Expression of genes related to mitochondrial biogenesis and EMT in SW480 and LoVo cells as determined by WB.
- D
Invasion of SW480 and LoVo cells was assessed by Matrigel invasion assay. Scale bars, 100 μm.
- E
Representative images of primary tumors (yellow arrowhead) and metastases in the orthotopic implantation models (n = 6 for each cohort, left panel). The number of mice with liver metastasis (blue arrowhead) was determined. The primary tumor volume in each group was calculated (right panel). H&E staining of tumors and metastases (bottom panel). Scale bars, 200 μm (n = 6 biological replicates).
- F
ISH staining of LINC00839 and IHC staining of NRF1, H4K5ac, and H4K8ac in paraffin‐embedded samples of CRC tumor tissues and NATs. Scale bars, 200 μm.
- G–I
Correlation analysis of the expression of LINC00839 and NRF1 (G), H4K5ac (H), and H4K8ac (I) in CRC patients (n = 120).
- J
Correlation of NRF1 expression with the overall survival rate in patients with CRC (n = 120). NRF1 expression was stratified as high and low according to the median expression level.
- K
A schematic illustration of the mechanism by which LINC00839 recruits the Ruvb1/Tip60 complex to acetylate histones at the NRF1 promoter and regulates CRC tumor progression via OXPHOS.
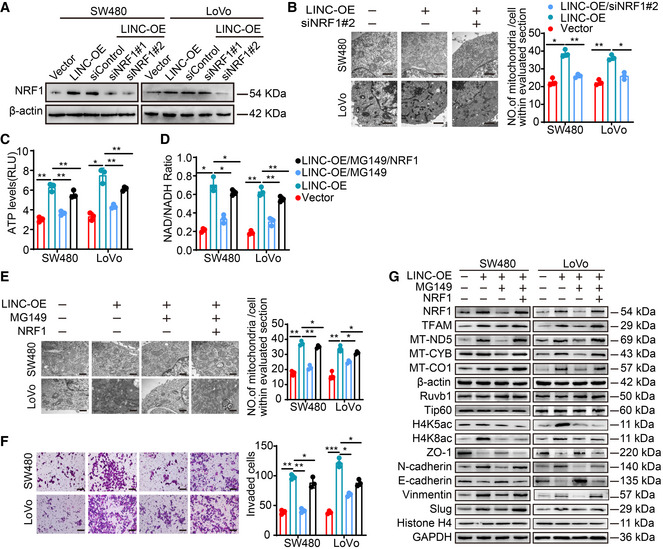
- A
The NRF1 knockdown efficiency was confirmed by WB.
- B
The number of mitochondria in SW480 and LoVo cells was confirmed by TEM. Scale bars, 500 nm.
- C, D
ATP levels and NAD/NADH ratios in SW480 and LoVo cells were determined.
- E
The number of mitochondria in SW480 and LoVo cells was confirmed by TEM. Scale bars, 500 nm.
- F
Invasion of SW480 and LoVo cells was determined by Matrigel invasion assay. Scale bars, 100 μm.
- G
Expression of genes related to mitochondrial biogenesis and EMT markers in SW480 and LoVo cells as determined by WB.
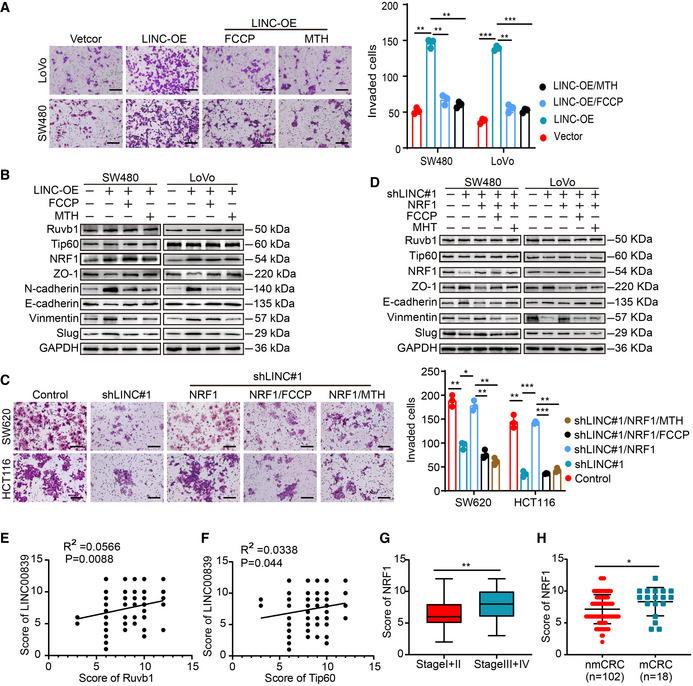
- A
Invasion of LINC00839‐overexpressing cells treated with FCCP and MTH was determined by Matrigel invasion assay. Scale bar, 100 μm.
- B
EMT marker expression levels in LINC00839‐overexpressing cells treated with FCCP and MTH were measured by WB.
- C
Invasion of LINC00839‐knockdown cells in which NRF1 was overexpressed and to which FCCP and MTH were added was measured by Matrigel invasion assay. Scale bar, 100 μm.
- D
EMT marker expression levels in LINC00839‐knockdown cells in which NRF1 was overexpressed and to which FCCP and MTH were added were measured by WB.
- E
The correlation between the expression of LINC00839 and Ruvb1 in the CRC cohort (n = 120, Pearson).
- F
The correlation between the expression of LINC00839 and Tip60 in the CRC cohort (n = 120, Pearson).
- G
The expression levels of NRF1 in patients with early‐stage (stage I and II) and advanced‐stage (stage III and IV) disease.
- H
Expression of NRF1 in nonmetastatic CRC patients (nmCRC) and metastatic CRC patients (mCRC).
References
-
- Ashton TM, McKenna WG, Kunz‐Schughart LA, Higgins GS (2018) Oxidative phosphorylation as an emerging target in cancer therapy. Clin Cancer Res 24: 2482–2490 - PubMed
Publication types
MeSH terms
Substances
Associated data
- Actions
- Actions
- Actions
- Actions
- Actions
LinkOut - more resources
Full Text Sources
Medical
Molecular Biology Databases
Miscellaneous
