. 2022 Aug 30;222(1):iyac106.
doi: 10.1093/genetics/iyac106.

Turning coldspots into hotspots: targeted recruitment of axis protein Hop1 stimulates meiotic recombination in Saccharomyces cerevisiae

Affiliations

Turning coldspots into hotspots: targeted recruitment of axis protein Hop1 stimulates meiotic recombination in Saccharomyces cerevisiae

Anura Shodhan et al. Genetics. .

Abstract

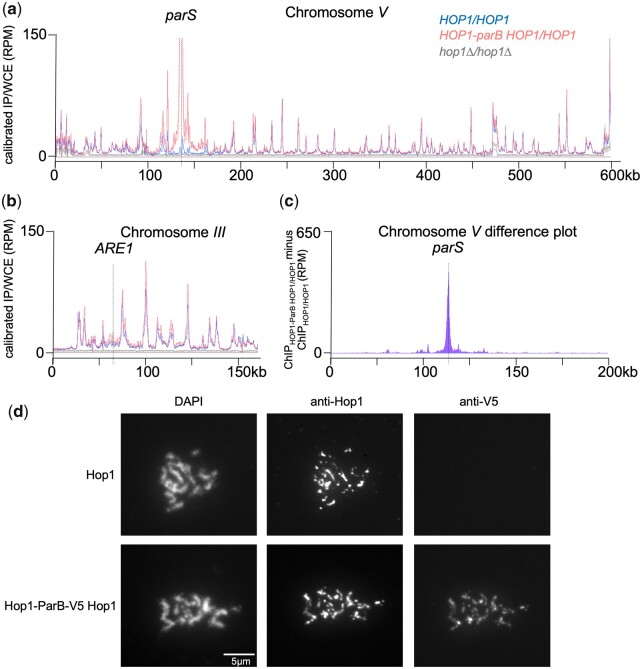
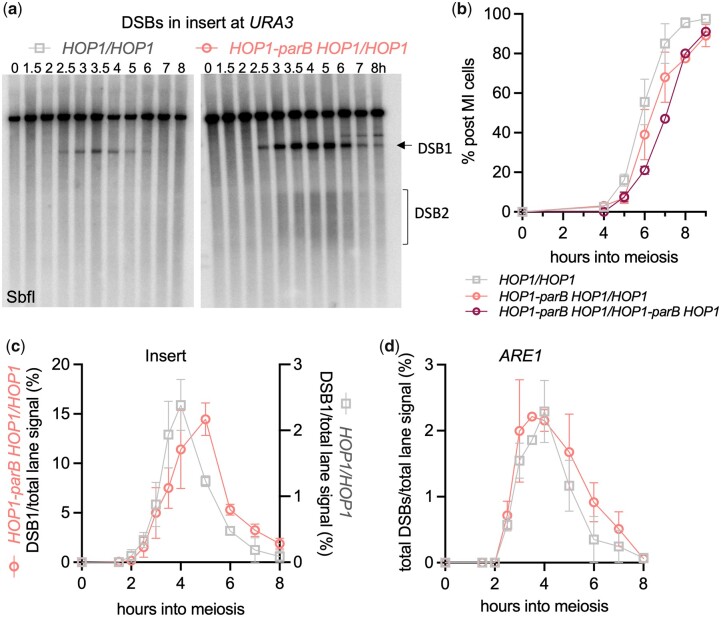
The DNA double-strand breaks that initiate meiotic recombination are formed in the context of the meiotic chromosome axis, which in Saccharomyces cerevisiae contains a meiosis-specific cohesin isoform and the meiosis-specific proteins Hop1 and Red1. Hop1 and Red1 are important for double-strand break formation; double-strand break levels are reduced in their absence and their levels, which vary along the lengths of chromosomes, are positively correlated with double-strand break levels. How axis protein levels influence double-strand break formation and recombination remains unclear. To address this question, we developed a novel approach that uses a bacterial ParB-parS partition system to recruit axis proteins at high levels to inserts at recombination coldspots where Hop1 and Red1 levels are normally low. Recruiting Hop1 markedly increased double-strand breaks and homologous recombination at target loci, to levels equivalent to those observed at endogenous recombination hotspots. This local increase in double-strand breaks did not require Red1 or the meiosis-specific cohesin component Rec8, indicating that, of the axis proteins, Hop1 is sufficient to promote double-strand break formation. However, while most crossovers at endogenous recombination hotspots are formed by the meiosis-specific MutLγ resolvase, crossovers that formed at an insert locus were only modestly reduced in the absence of MutLγ, regardless of whether or not Hop1 was recruited to that locus. Thus, while local Hop1 levels determine local double-strand break levels, the recombination pathways that repair these breaks can be determined by other factors, raising the intriguing possibility that different recombination pathways operate in different parts of the genome.

Keywords: Hop1; chromosome axis; crossing over; double-strand breaks; meiosis; meiotic recombination; recombination pathways.


Figures

Fig. 1.
Fig. 1.
ParB fusion constructs. a) Illustration of protein fusions used. Dark arrows—coding sequences of tagged and untagged HOP1; vertical lines—fusion junction; light arrows—natMX6 drug resistance cassette; open boxes—5′ and 3′ HOP1 untranslated regions; thin black lines—flanking yeast chromosome sequences. b) Western blot of samples taken at indicated time in meiosis, probed with anti-Hop1. Bands corresponding to Hop1 and to Hop1-ParB are indicated; asterisk indicates nonspecific background band. Ratios of Hop1-ParB/Hop1 are indicated for strains where the 2 proteins are both present. See also Supplementary File 1, sheet 14.
Fig. 2.
Fig. 2.
Hop1 recruitment stimulates meiotic recombination. a) Left—schematic of the URA3-ARG4-pBR322-parS reporter insert, showing arg4-nsp and arg4-bgl heteroalleles; right—leu2 control locus with heteroalleles. Blue—coding sequences; open boxes—yeast chromosomal sequences; filled box—parSc2 sequences; thick line—pBR322 sequences. b) Frequencies of Arg+ (insert, black) and Leu+ (control, white) recombinants for the insert at URA3 as shown in (a). Fusion proteins expressed are indicated; all strains also expressed wild-type Hop1. c) Frequencies of Arg+ (top) and Leu+ (bottom) recombinants in strains with inserts at the indicated locus, expressing only Hop1 (gray) or both Hop1-ParB and Hop1 (salmon). Values in graphs are the average of 2 or more independent experiments; error bars denote range. See also Supplementary File 1, sheet 4.
Fig. 3.
Fig. 3.
Hop1-ParB recruitment increases DSBs in reporter inserts. a) Southern blot of DNA from sae2Δ strains, which form DSBs but do not resect or repair them, with parS insert at indicated locus. Indicated restriction digests were probed with parS sequences to detect DSBs in the insert. These occur in pBR322 sequences on either side of ARG4 sequences (Wu and Lichten 1995), and will be called DSB1 and DSB2 as shown in the schematic. Strains were homozygous either for HOP1 (gray) or HOP1-parB HOP1 (salmon). b) Hop1-ParB increases DSBs (DSB1 + DSB2) at all 3 insert loci (top), but not at the ARE1 control locus (bottom). c) Hop1-parB acts primarily in cis: Southern blot with DNA from a sae2Δ strain with inserts at URA3 on both homologs, where: (parS/-)—one contains parS and the other does not; (parS/parS)—both contain parS; (-/-)—both are without parS. DNA was digested with SbfI and probed with pBR322 sequences, which allows distinction between breaks at DSB1 on chromosomes with and without parS. Breaks at DSB2 cannot be resolved. d) Quantification of breaks at DSB1 in the parS hemizygous strain, as well as in control strains with homozygous inserts where both homologs either lacked or contained parS. DSB1 levels are normalized on a per chromatid basis. Because of overlapping signal, signals of DSB2 on chromosomes with parS could not be resolved from those on chromosomes without parS. Values in graphs are the average of 2 or more independent experiments; error bars denote range. See also Supplementary Fig. 3 and File 1, sheets 5 and 6.
Fig. 4.
Fig. 4.
Hop1-stimulated DSBs are Spo11 dependent but Red1- and Rec8-independent. a) Southern blot with DNA from a sae2Δ strain with inserts at URA3 in spo11Δ, red1Δ or rec8Δ strains homozygous either for HOP1 (gray) or HOP1-parB HOP1 (salmon). DNA was digested with SbfI and probed with parS sequences. b) Top—DSBs in the parS insert at URA3, measured at 7h after induction of meiosis in indicated mutant strains homozygous either for HOP1 (gray) or HOP1-parB HOP1 (salmon). Bottom—DSBs in the same strains at the ARE1 control locus. Values in graphs are the average of 2 or more independent experiments; error bars denote range. See also Supplementary Fig. 3 and File 1, sheet 5.
Fig. 5.
Fig. 5.
Hop1 localization and enrichment at parS. a) Hop1 occupancy (immunoprecipitate [ChIP]/whole cell extract [WCE], reads per million) on chromosome V, determined by calibrated ChIP-seq (see Materials and methods) using samples taken at 4 h after induction of meiosis. Strains contained the URA3-tel-arg4-parB insert at URA3 and the indicated HOP1 genotype. Dark and light lines indicate replicates from independent experiments. Dotted vertical line—parS insert locus. The peak at parS in HOP1-parB HOP1/HOP1 strains is truncated; peak values reached ∼700 RPM. b) Hop1 occupancy around the ARE1 control locus (chr. III). Dotted vertical line—ARE1 DSB site. All other details as in (a). c) Difference plot for 200 kb around parS, calculated by subtracting the calibrated ChIP/WCE for HOP1/HOP1 (mean of both replicates) from that for HOP1-parB HOP1/HOP1 (mean of both replicates). d) Chromosome spreads from meiotic cells (4 and 5 h postmeiotic induction) from wild type and from cells expressing Hop1-ParB (HOP1-parB-V5 HOP1/HOP1), probed with the indicated antiserum. In strains expressing Hop1-parB-V5, Hop1-ParB (anti-V5) shows the same distribution as total Hop1. Scale bar = 5µm. See also Supplementary Fig. 2.
Fig. 6.
Fig. 6.
Hop1-ParB has partial function. a) Spore viability in dissected tetrads. b) Frequencies of Arg+ (black) and Leu2+ (white) recombinants in random spores from diploids with the URA3-ARG4-pBR322-parS insert at URA3. c and d) Frequencies of DSBs (DSB1 + DSB2, see Fig. 3) at the URA3-ARG4-pBR322-parS insert at URA3 and at the ARE1 control locus, in sae2Δ strains. With the exception of panel (a), values in graphs are the average of 2 or more independent experiments; error bars denote range. See also Supplementary Fig. 3 and File 1, sheets 4, 5, and 7.
Fig. 7.
Fig. 7.
Delayed DSB repair and meiotic progression in presence of Hop1-ParB. a) Southern blots of meiotic DNA from SAE2 cells with the URA3-ARG4-pBR322-parS insert at URA3, expressing either Hop1 or both Hop1-ParB and Hop1 digested with Sbf1 and probed with parS sequences. The late-arising band above DSB1 is of the size expected for ectopic crossing-over or gene conversion between URA3 sequences flanking the insert that removes a Ty1 insert in the left-hand copy of URA3. b) Meiotic progression, expressed as cells completing meiosis I (with either 2 or 4 nuclei). c) Quantification of total DSBs from the experiment in panel (a) and others. Note that data from strains expressing Hop1 (gray) are plotted with the right-hand Y axis, and from strains with HOP1-ParB HOP1/HOP1 (salmon) on the left-hand Y axis with a different scale, to highlight DSB timing differences. d) DSBs at the ARE1 control locus from the same experiments as in (c). Values in graphs are the average of 2 or more independent experiments; error bars denote range. See also Supplementary Fig. 4 and File 1, sheets 8 and 9.
Fig. 8.
Fig. 8.
Effect of mlh3Δ on CO at URA3. a) Schematic of the interval used to measure map distances by tetrad dissection. b) Map distances, calculated from marker segregation in tetrads, between kanMX and hygMX inserts flanking a URA3-ARG4-pBR322-parS insert at the URA3 locus (shown in [a]; also see Materials and methods). Gray—HOP1/HOP1; salmon—HOP1-parB HOP1/HOP1-parB HOP1. Expression of Hop1-ParB results in a marked increase in map distances. Map distances are only modestly decreased in mlh3Δ strains. Error bars denote calculated standard error. See also Supplementary File 1, sheet 10.
Fig. 9.
Fig. 9.
Noncanonical CO pathway usage at URA3. a) Schematic for the URA3-tel-arg4-parS reporter insert at URA3, showing product lengths in XmnI digests. Left—Southern blots showing DSBs in sae2Δ strains; right—CO (CO1 and CO2) products in SAE2 strains. Both blots were probed with URA3 sequences. b) Quantification of insert DSBs in sae2Δ HOP1/HOP1 (gray) or sae2Δ HOP1-parB HOP1/HOP1 (salmon) strains in samples taken 7h after meiotic induction. c) Quantification of COs (CO1 + CO2) in HOP1/HOP1 (gray) or HOP1-ParB HOP1/HOP1 (salmon) in samples taken 8 h after meiotic induction in the indicated mutants. d) Quantification of COs (CO1 + CO2) with a different scale for HOP1/HOP1 (gray, right Y axis) and HOP1-ParB HOP1/HOP1 (salmon, left Y axis) to compare relative levels in indicated mutants in the presence or absence of Hop1-ParB. Details as in panel (c). Values in graphs are the average of 2 or more independent experiments; error bars denote range. See also Supplementary Fig. 5 and File 1, sheets 11 and 12.

Similar articles

Cited by

References

    1. Acquaviva L, Székvölgyi L, Dichtl B, Dichtl BS, de La Roche Saint André C, Nicolas A, Géli V.. The COMPASS subunit Spp1 links histone methylation to initiation of meiotic recombination. Science. 2013;339(6116):215–218. - PubMed
    1. Agostinho A, Meier B, Sonneville R, Jagut M, Woglar A, Blow J, Jantsch V, Gartner A.. Combinatorial regulation of meiotic Holliday junction resolution in C. elegans by HIM-6 (BLM) helicase, SLX-4, and the SLX-1, MUS-81 and XPF-1 nucleases. PLoS Genet. 2013;9(7):e1003591. - PMC - PubMed
    1. Ahuja JS, Harvey CS, Wheeler DL, Lichten M.. Repeated strand invasion and extensive branch migration are hallmarks of meiotic recombination. Mol Cell. 2021;81(20):4258–4270.e4254. - PMC - PubMed
    1. Al-Sweel N, Raghavan V, Dutta A, Ajith VP, Di Vietro L, Khondakar N, Manhart CM, Surtees JA, Nishant KT, Alani E, et al.mlh3 mutations in baker's yeast alter meiotic recombination outcomes by increasing noncrossover events genome-wide. PLoS Genet. 2017;13(8):e1006974. - PMC - PubMed
    1. Allers T, Lichten M.. A method for preparing genomic DNA that restrains branch migration of Holliday junctions. Nucleic Acids Res. 2000;28(2):e6. - PMC - PubMed

Publication types

MeSH terms

Substances