. 2022 Sep 27;34(10):3830-3843.
doi: 10.1093/plcell/koac205.

Electron tomography of prolamellar bodies and their transformation into grana thylakoids in cryofixed Arabidopsis cotyledons

Affiliations

Electron tomography of prolamellar bodies and their transformation into grana thylakoids in cryofixed Arabidopsis cotyledons

Zizhen Liang et al. Plant Cell. .

Abstract

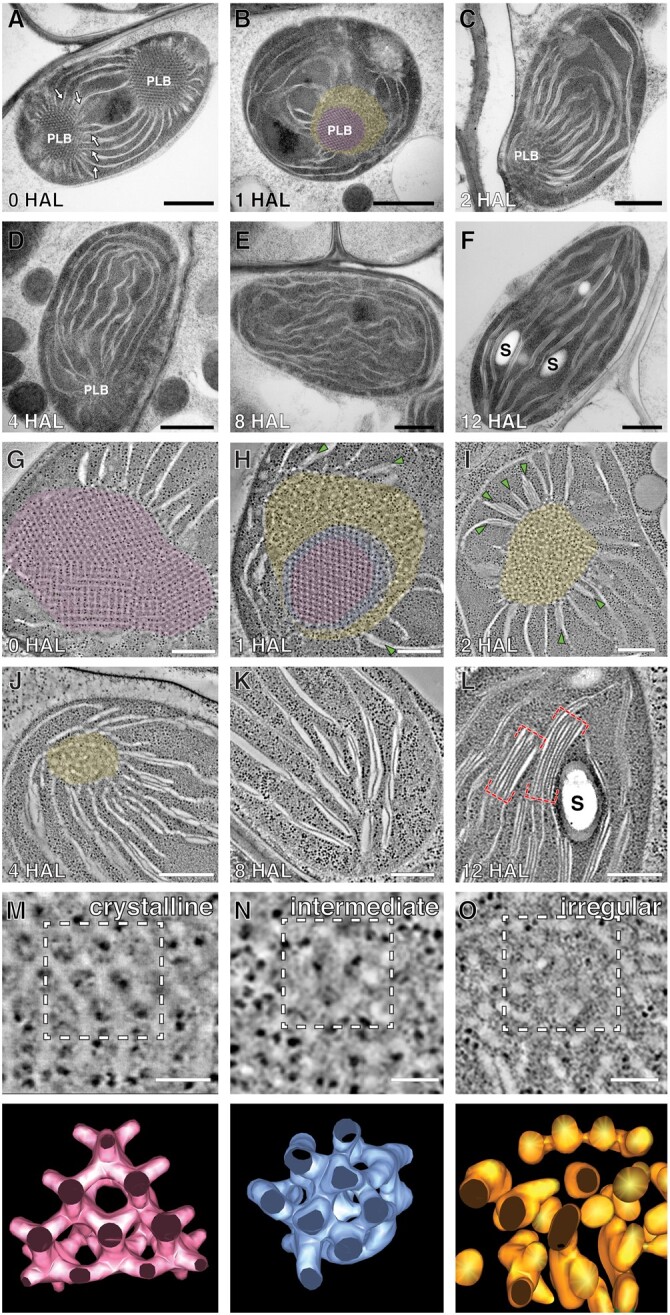
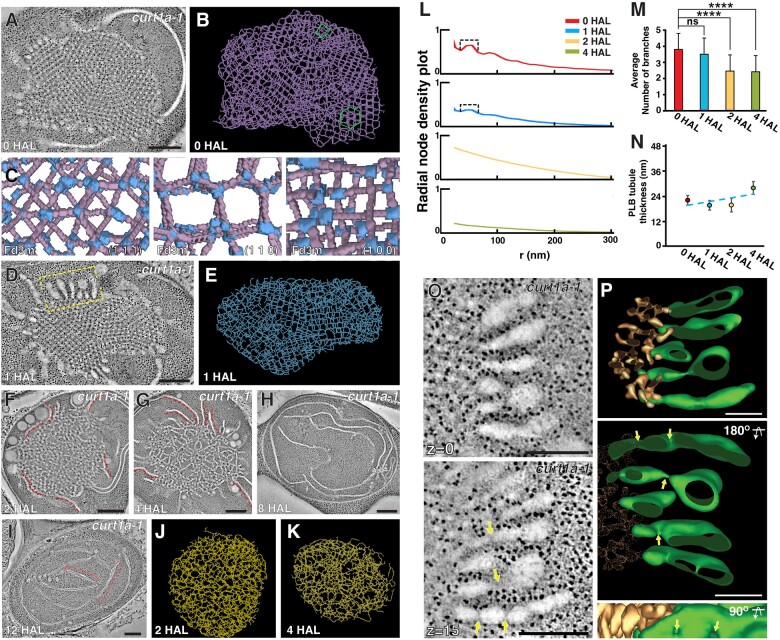
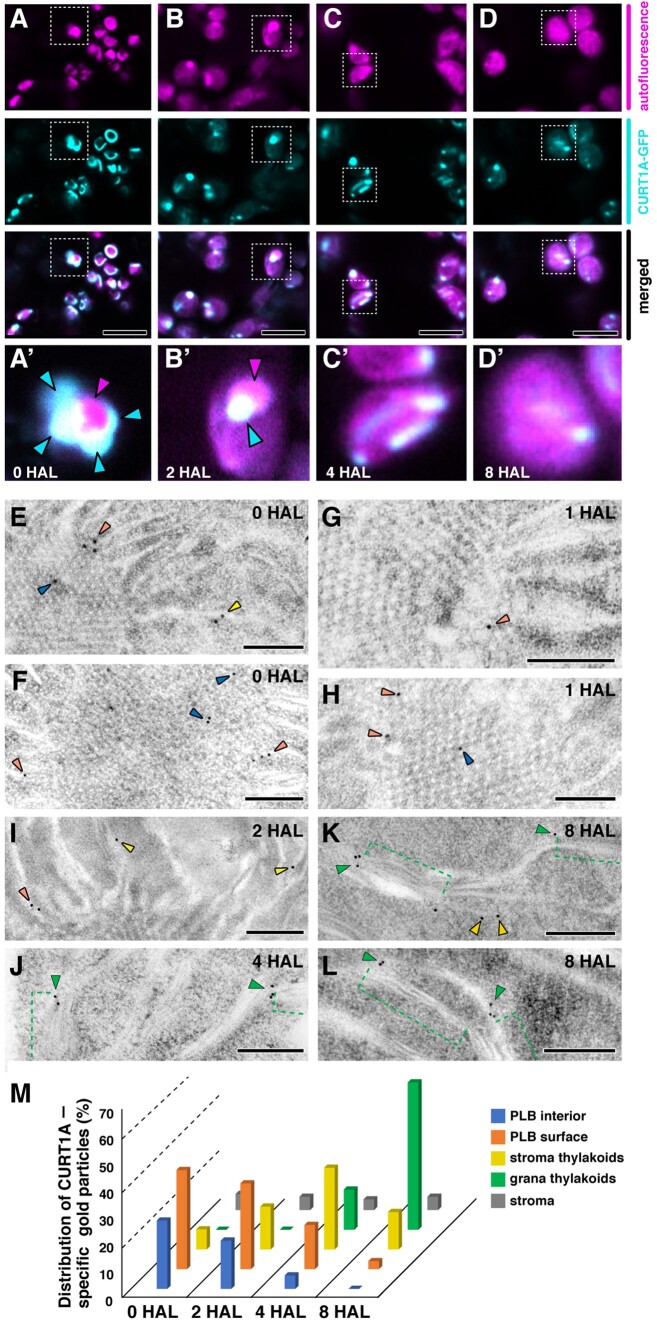
The para-crystalline structures of prolamellar bodies (PLBs) and light-induced etioplast-to-chloroplast transformation have been investigated via electron microscopy. However, such studies suffer from chemical fixation artifacts and limited volumes of 3D reconstruction. Here, we examined Arabidopsis thaliana cotyledon cells by electron tomography (ET) to visualize etioplasts and their conversion into chloroplasts. We employed scanning transmission ET to image large volumes and high-pressure freezing to improve sample preservation. PLB tubules were arranged in a zinc blende-type lattice-like carbon atoms in diamonds. Within 2 h after illumination, the lattice collapsed from the PLB exterior and the disorganized tubules merged to form thylakoid sheets (pre-granal thylakoids), which folded and overlapped with each other to create grana stacks. Since the nascent pre-granal thylakoids contained curved membranes in their tips, we examined the expression and localization of CURT1 (CURVATURE THYLAKOID1) proteins. CURT1A transcripts were most abundant in de-etiolating cotyledon samples, and CURT1A was concentrated at the PLB periphery. In curt1a etioplasts, PLB-associated thylakoids were swollen and failed to form grana stacks. In contrast, PLBs had cracks in their lattices in curt1c etioplasts. Our data provide evidence that CURT1A is required for pre-granal thylakoid assembly from PLB tubules during de-etiolation, while CURT1C contributes to cubic crystal growth in the dark.


Figures

Figure 1
Figure 1
PLB degeneration and thylakoid assembly in de-etiolating Arabidopsis cotyledons. A–F, TEM micrographs of etioplasts/chloroplasts at (A) 0 HAL, (B) 1 HAL, (C) 2 HAL, (D) 4 HAL, (E) 8 HAL, and (F) 12 HAL. Arrows in (A) indicate prothylakoids. S: starch particle. Scale bars = 1 µm. G–L, STET slice images of plastids at (G) 0 HAL, (H) 1 HAL, (I) 2 HAL, (J) 4 HAL, (K) 8 HAL, and (L) 12 HAL. The crystalline, irregular, and intermediate zones in PLBs are highlighted in magenta, yellow, and blue, respectively, in (B) and (G–J). The intermediate zone was distinguished by STET (H) but not by TEM (B). PLB-associated grana stacks are marked with green arrows in (H) and (I). Grana stacks are denoted with red brackets in (L). S: starch particle. Scale bars = 300 nm. M–O, High magnification STET slice images of the PLB lattice (crystalline) at 0 HAL (M), PLB tubules of the intermediate zone at 1 HAL (N), and PLB tubules of the irregular zone at 1 HAL (O). Scale bars = 150 nm. Lower show 3D surface models of the PLB membranes demarcated with dashed squares in the upper images.
Figure 2
Figure 2
The crystalline structure of Arabidopsis PLB and its decay during de-etiolation. A, A skeleton model of the PLB in Figure 1G. Regions exhibiting hexagonal or square lattice patterns are marked in green. B, A higher magnification view of the skeleton model shown in A. Nodes are highlighted in light blue. The region exhibiting a square lattice pattern is marked with a green square. C–E, Projection views of select regions (upper), and lattice planes of the space group Fd3m (cubic diamond crystal structure) and their Miller indices, that is (1,1,1), (1,1,0), and (1,0,0) of the PLB skeleton model (bottom). Note that the arrangements of PLB nodes and tubules match those of the cubic diamond lattices in all three planes. F–H, Skeleton models of decaying PLBs at (F) 1 HAL, (G) 2 HAL, and (H) 4 HAL. The models were generated from the tomograms in Figure 1, H, I, and J, respectively. Lines are color-coded to denote the crystalline, irregular, and intermediate zones in PLBs. Scale bars = 300 nm. I, Radial density plots of branching nodes in the skeleton models from the four timepoints of de-etiolation. Peaks in the plots of 0 HAL and 1 HAL crystalline zone (brackets) reveal that pairs of nodes separated by distances of 30–70 nm are abundant in their respective skeleton models. J, The average number of branches at each node in 0 HAL, 1 HAL crystalline, 1 HAL irregular, 2 HAL, and 4 HAL PLBs. Branches were counted from 24 nodes at each stage. (***P  < 0.0005 by Welch’s t test, n.s., no significant difference). K, The average thicknesses of tubules in 0 HAL, 1 HAL crystalline, 1 HAL irregular, 2 HAL, and 4 HAL PLBs. The thicknesses were calculated from 81,225 (0 HAL), 17,343 (1 HAL crystalline), 20,864 (1 HAL irregular), 13,391 (2 HAL), and 2333 (4 HAL) tubular segments in PLB surface models. Error bars in J and K indicate standard deviations.
Figure 3
Figure 3
The PLB to pre-granal thylakoid transition and grana formation from pre-granal thylakoids (A–C) STET slice image (A) and 3D models (B and C) of a PLB (gold) and prothylakoids (blue double-sided arrows) and a fenestrated sheet between them (brown bracket) at 1 HAL (red arrows in A–C). D and E, Fenestrate sheet connected to a PLB at 2 HAL. Fenestrae are indicated by red arrowheads. F and G, High-magnification images of two pre-granal thylakoids connected to a PLB at 2 HAL. A bud emerging from the pre-granal thylakoid is marked by a blue arrow in F and G. H and I, Images and 3D model of a nascent granum consisting of four layers at the margin of a PLB at 2 HAL. Three disks (blue; numbered in H and I) derived from the irregular tubules pile up on a grana-forming thylakoid (green). These disks are interconnected via their margins. J and K, STET slice images (J) and 3D models (K) of a granum and stroma thylakoids associated with a PLB at 4 HAL. The granum consists of five disks that are linked via a helical thylakoid arrangement (yellow membrane in K). As the slice number increases from 1 to 21, the disks 1, 2, and 3 make connections sequentially to the stroma thylakoid (magenta arrows in J and K). Scale bars = 100 nm. L, Correlation plot illustrating the relationship between fenestrae sizes and their distances from PLBs at 2 HAL.
Figure 4
Figure 4
Altered PLB-to-thylakoid conversion in the curt1a etioplast. A–B, curt1a-1 STET slice image (A) of a curt1a-1 plastid at 0 HAL and a skeleton model of its PLB (B). Regions with hexagonal or square lattice patterns are marked with a green hexagon or square, respectively, in (B). C, Projection views of select regions in the skeleton model matching the space group Fd3m. Miller indices, i.e., (1,1,1), (1,1,0), and (1,0,0) of the lattice planes are indicated. D–E, STET slice image (D) of a curt1a-1 plastid at 1 HAL and a skeleton model of its PLB (E). F–I, STET slice image of curt1a-1 plastids at (F) 2 HAL, (G) 4 HAL, (H) 8 HAL, and (I) 12 HAL. Red dots in (F) and (G) label pre-granal thylakoids associated with PLBs. Note that grana stacks failed to form around PLBs. Scale bars in (A, D, F–I) = 300 nm. J–K, Skeleton models of decaying PLBs at (J) 2 HAL and (K) 4 HAL. L, Radial density plots of branching nodes in the four skeleton models in B, E, J and K. Peaks in the plots of 0 HAL and 1 HAL (brackets) indicate that node pairs in 1 HAL PLBs maintain distances of 30-70 nm as they do in 0 HAL. Rephrase M, The average number of branches at each node in 0 HAL, 1 HAL, 2 HAL, and 4 HAL PLBs. Branches were counted from 21 nodes at each stage. (****P < 0.0001 by Welch’s t test, n.s., no significant difference). N, The average thicknesses of tubules in 0 HAL, 1 HAL, 2 HAL, and 4 HAL PLBs. The thicknesses were calculated from 52,306 (0 HAL), 10,106 (1 HAL), 17,058 (2 HAL), and 42,453 (4 HAL) tubular segments in PLB surface models. Error bars in M and N indicate standard deviations. O, Tomographic slice images of the thylakoids connected to PLBs in the yellow bracket in (D). Fenestrations in pre-granal thylakoids are indicated with arrows. Scale bars = 200 nm. P, 3D model of the swollen thylakoids (green) and PLB (gold) in (O). Four fenestrae marked with arrows in (P) correspond to the four in the lower part in (O). Scale bars = 100 nm.
Figure 5
Figure 5
Localization of CURT1A in PLBs and thylakoids. A–D, Confocal laser scanning micrographs showing CURT1A-GFP distribution at (A) 0 HAL, (B) 2 HAL, (C) 4 HAL, and (D) 8 HAL. Autofluorescence from Pchlide/chlorophyll, fluorescence from CURT1A-GFP, and merged panels are shown in each column. Aʹ–Dʹ are high-magnification micrographs of the regions indicated with squares in parts A–D. In Aʹ and Bʹ, PLBs and CURT1A-GFP puncta are indicated by magenta and blue arrowheads, respectively. Scale bars = 8 mm. E–L, Immunogold labeling showing the localization of CURT1A in Arabidopsis plastids at (E and F) 0 HAL, (G and H) 1 HAL, (I) 2 HAL, (J) 4 HAL, and (K and L) 8 HAL. Gold particles located in PLBs, the periphery of PLBs, stroma thylakoids, and grana stacks (green brackets in J–L) are marked by blue, orange, yellow, and green arrowheads, respectively. Scale bars = 200 nm. M, Histogram showing CURT1A-specific gold particle distribution in Arabidopsis plastids at 0 HAL, 2 HAL, 4 HAL, and 8 HAL. In all, 200–300 gold particles were counted in 30–40 TEM sections from three different cotyledon samples at each time point.
Figure 6
Figure 6
PLBs in curt1c mutant etioplasts are abnormal. A and B, TEM micrographs (A) and STET slice image (B) of PLBs in curt1c-1 plastids at 0 HAL. Arrows mark defects in the PLB lattice. C, A skeleton model of curt1c-1 PLB in (B). Arrows point to the pores in the PLB. D, TEM micrograph of a curt1c-1 plastid at 1 HAL. Zones in the PLB with irregular and crystalline tubules are highlighted in yellow and magenta, respectively. E–G, TEM micrographs of curt1c-1 plastids at 2 HAL (E), 4 HAL (F), and 12 HAL (G). Grana stacks associated with PLBs are denoted with red brackets in (E) and (F). Scale bars = 500 nm. I, Histogram showing pore numbers per etioplast. ∼30 etioplasts in TEM sections from at least three samples for each genotype were examined. (±sd; one-way ANOVA; **P < 0.01, n.s., no significant difference). H, TEM micrograph of an etioplast in curt1c-1 expressing CURT1C-GFP at 0 HAL. Aʹ and Hʹ are magnified views of PLBs inside the rectangles in (A) and (H), respectively. J–M, CURT1C-GFP localization at 0 HAL (J), 2 HAL (K), 4 HAL (L), and 8 HAL (M) visualized by confocal laser scanning microscopy. Autofluorescence from Pchlide/chlorophyll, fluorescence from CURT1C-GFP, merged panels, and higher-magnification micrographs of regions denoted with squares are provided in each column. Scale bars in (J–M): 8 mm.
Figure 7
Figure 7
Schematic diagrams illustrating the functions of CURT1A and CURT1C during de-etiolation. A, Model of pre-granal thylakoid development from PLB tubules. The irregular region of degrading PLBs gradually coalesces into a fenestrated sheet that matures into pre-granal thylakoids when the fenestrae shrinks and disappears. CURT1A stabilizes the membrane curvature at the tips of pre-granal thylakoids growing out from a PLB. B, PLBs accumulate CURT1A and CURT1C in the dark. Upon illumination, PLB decay occurs from the outer layer, and CURT1A concentrates to the sites where new pre-granal thylakoids (arrowheads) and grana stacks (brackets) are assembled. CURT1C does not exhibit such relocation. Magenta, blue, and yellow regions of the 1 h PLB correspond to the crystalline, intermediate, and irregular zones in Figures 1, H and 2, F. C, Pre-granal thylakoids growing out from PLBs are swollen (arrowheads) and grana stacks do not form in curt1a. D, PLBs in curt1c etioplasts have pores and disorganized tubules (arrows).

Similar articles

Cited by

References

    1. Armarego-Marriott T, Kowalewska L, Burgos A, Fischer A, Thiele W, Erban A, Strand D, Kahlau S, Hertle A, Kopka J, et al. (2019) Highly resolved systems biology to dissect the etioplast-to-chloroplast transition in tobacco leaves. Plant Physiol 180: 654–681 - PMC - PubMed
    1. Armbruster U, Labs M, Pribil M, Viola S, Xu W, Scharfenberg M, Hertle AP, Rojahn U, Jensen PE, Rappaport F, et al. (2013) Arabidopsis CURVATURE THYLAKOID1 proteins modify thylakoid architecture by inducing membrane curvature. Plant Cell Online 25: 2661–2678 - PMC - PubMed
    1. Blomqvist LA, Ryberg M, Sundqvist C (2008) Proteomic analysis of highly purified prolamellar bodies reveals their significance in chloroplast development. Photosynthesis Res 96: 37–50 - PubMed
    1. Bykowski M, Mazur R, Buszewicz D, Szach J, Mostowska A, Kowalewska L (2020) Spatial nano-morphology of the prolamellar body in etiolated Arabidopsis thaliana plants with disturbed pigment and polyprenol composition. Front Cell Dev Biol 8: 586628. - PMC - PubMed
    1. Cotton FA, Wilkinson G, Gaus PL (1995) Basic inorganic chemistry. InIonic solids, John Wiley & Sons, New York, p 139

Publication types