. 2022 Sep 28;190(2):1199-1213.
doi: 10.1093/plphys/kiac329.

ADP-ribosylation factor D1 modulates Golgi morphology, cell plate formation, and plant growth in Arabidopsis

Affiliations

ADP-ribosylation factor D1 modulates Golgi morphology, cell plate formation, and plant growth in Arabidopsis

Fangfang Niu et al. Plant Physiol. .

Abstract

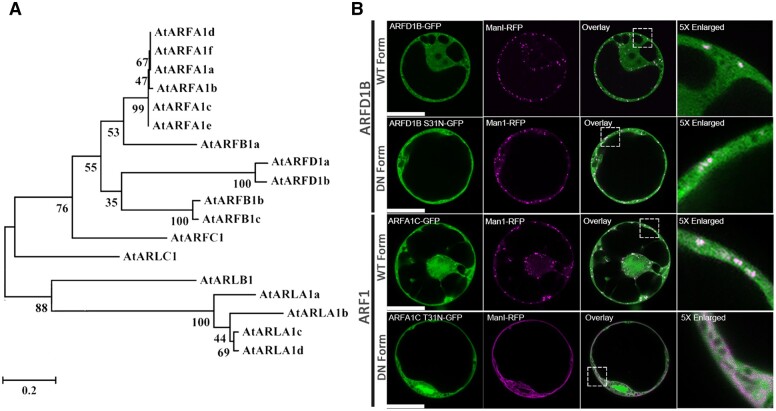
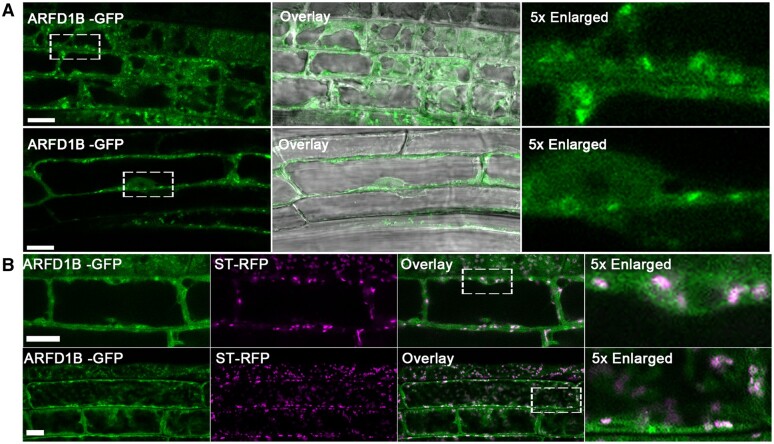
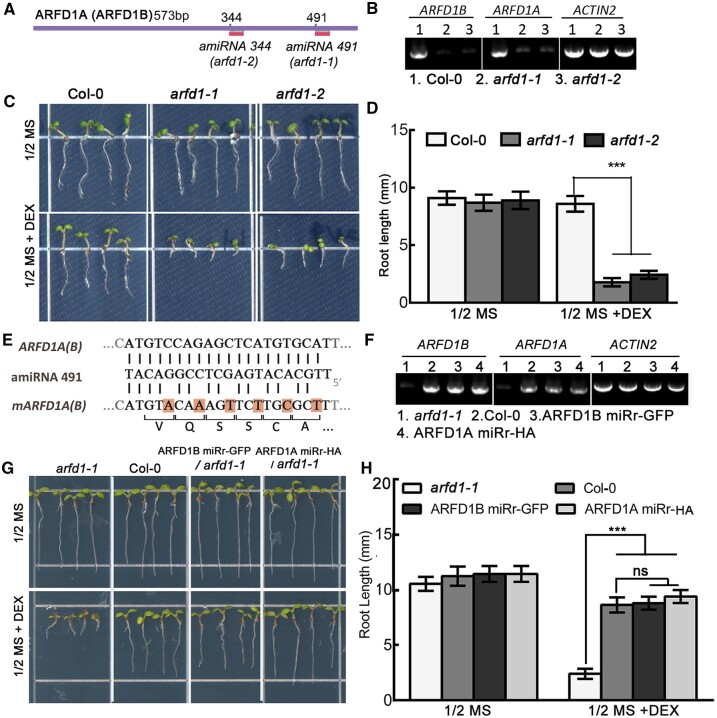
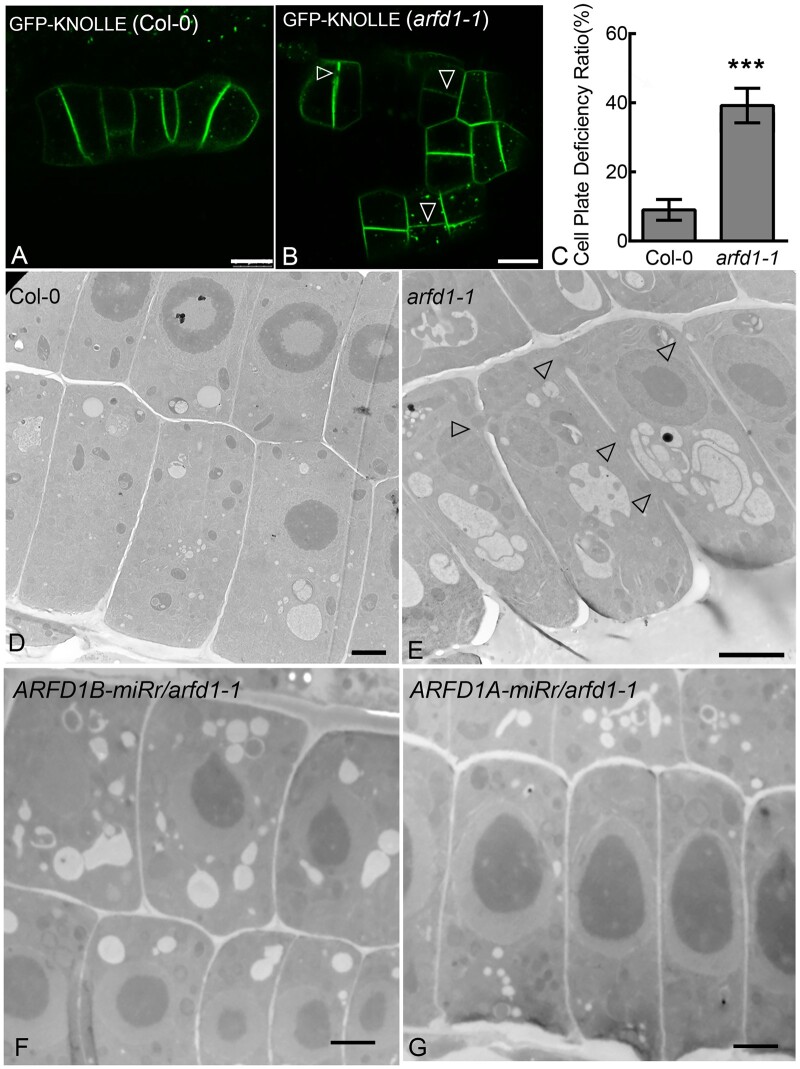
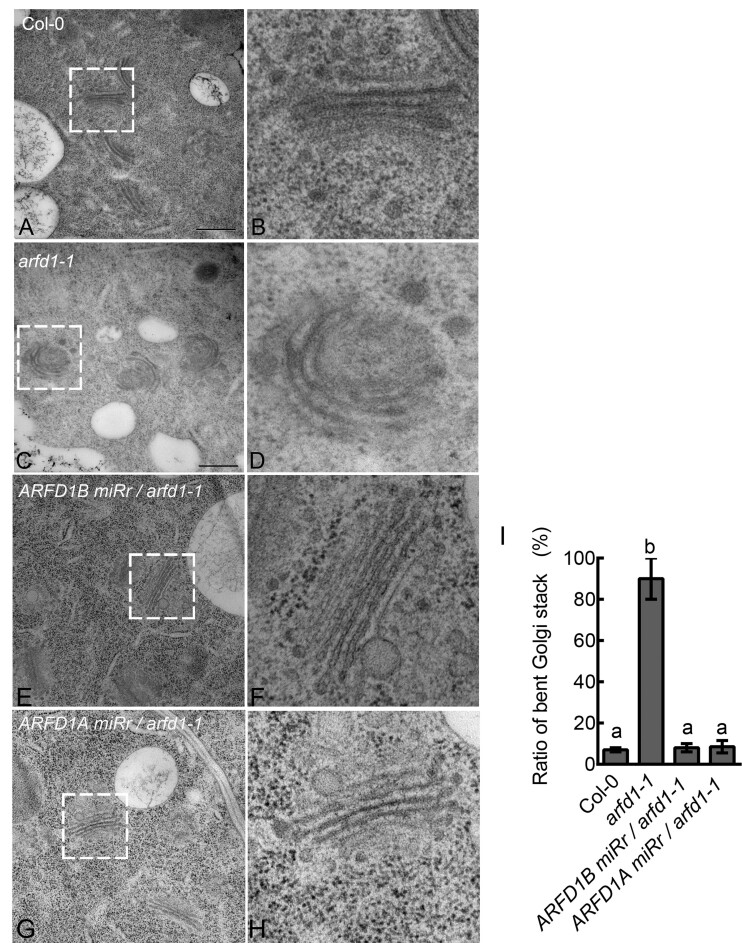
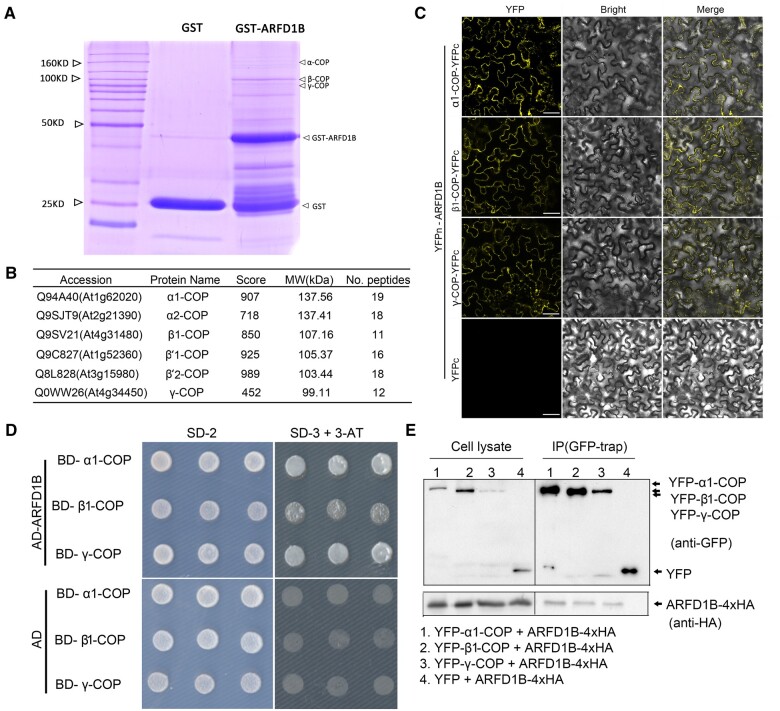
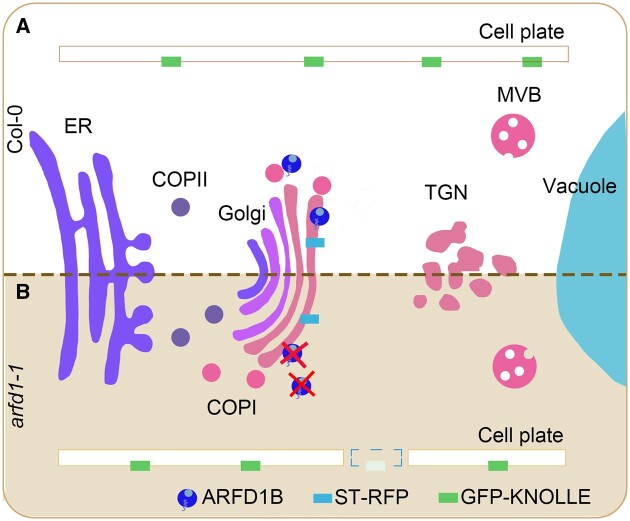
ADP-ribosylation factor (ARF) family proteins, one type of small guanine-nucleotide-binding (G) proteins, play a central role in regulating vesicular traffic and organelle structures in eukaryotes. The Arabidopsis (Arabidopsis thaliana) genome contains more than 21 ARF proteins, but relatively little is known about the functional heterogeneity of ARF homologs in plants. Here, we characterized the function of a unique ARF protein, ARFD1B, in Arabidopsis. ARFD1B exhibited both cytosol and punctate localization patterns, colocalizing with a Golgi marker in protoplasts and transgenic plants. Distinct from other ARF1 homologs, overexpression of a dominant-negative mutant form of ARFD1B did not alter the localization of the Golgi marker mannosidase I (ManI)-RFP in Arabidopsis cells. Interestingly, the ARFD1 artificial microRNA knockdown mutant arfd1 displayed a deleterious growth phenotype, while this phenotype was restored in complemented plants. Further, confocal imaging and transmission electron microscopy analyses of the arfd1 mutant revealed defective cell plate formation and abnormal Golgi morphology. Pull-down and liquid chromatography-tandem mass spectrometry analyses identified Coat Protein I (COPI) components as interacting partners of ARFD1B, and subsequent bimolecular fluorescence complementation, yeast (Saccharomyces cerevisiae) two-hybrid, and co-immunoprecipitation assays further confirmed these interactions. These results demonstrate that ARFD1 is required for cell plate formation, maintenance of Golgi morphology, and plant growth in Arabidopsis.


Figures

Figure 1
Figure 1
Expression of the dominant-negative mutant of ARFD1B does not affect the Golgi localization of ManI-RFP in Arabidopsis protoplasts. A, Phylogenetic tree of ARF family in Arabidopsis. The tree was reconstructed with amino acid sequences through the Maximum Likelihood method implemented in MEGA7.0. The numbers on the nodes are percentages from a bootstrap analysis of 1,000 replicates. The scale bar represents a genetic distance equivalent to 10-nucleotide substitutions per 100 amino acid positions. The ARFD1a and ARFD1b were indicated by blue color. At, Arabidopsis. B, Subcellular localization of ARFD1 and ARFA1 in Arabidopsis protoplasts. ARFD1B-GFP or ARFA1C-GFP and their dominant-negative (DN) forms of ARFD1B (S31N)-GFP or ARFA1C (T31N)-GFP were co-expressed with the cis-Golgi marker ManI-mRFP, respectively, in Arabidopsis protoplasts, followed by confocal imaging analysis at 14 h after transfection. Bars = 25 μm.
Figure 2
Figure 2
Subcellular localization of ARFD1B-GFP in transgenic Arabidopsis plants. A, Confocal imaging analysis of 5-day-old transgenic Arabidopsis seedlings expressing ARFD1B-GFP. The images of root transition (upper) and elongation (lower) cells were collected, respectively. Bars = 10 μm. B, Root cells of 5-day-old transgenic Arabidopsis seedlings co-expressing ARFD1B-GFP and the Golgi marker ST-RFP were subjected to confocal imaging analysis. The images of root transition (upper) and elongation (lower) cells were collected, respectively. Bars = 10 μm.
Figure 3
Figure 3
Phenotypic analysis of the arfd1 mutants and complementary lines. A, Schematic diagram of ARFD1 (ARFD1B and ARFD1A) coding sequences and DEX-induced amiRNA mutant lines. The positions of the targeting sites of amiRNA were indicated by the red lines. The amiRNA:ARFD1 at positions 491 and 344 were represented as arfd1-1 and arfd1-2, respectively. B, RT–PCR analysis of ARFD1A and ARFD1B expression in the arfd1 mutants. Five-day-old seedlings of Col-0, arfd1-1, and arfd1-2 grown in 1/2 MS with 30-μMDEX were subjected to RNA extraction and subsequent RT-PCR analysis. ACTIN2 was used as internal control. C, The phenotypes of 5-day-old seedlings of Col-0, arfd1-1, and arfd1-2 grown in 1/2 MS or 1/2 MS with 30-μM DEX. D, Quantification of root length of arfd1 mutants grown in 1/2 MS or 1/2 MS with 30-μM DEX shown in (C). The data represent the mean values from three independent experiments ± se (***P ≤ 0.001, one-way ANOVA test). E, Schematic diagram of mARFD1A(B) resistant to amiR-D1S491, showing the point mutations that destroyed the silent target sites of amiRNA491 but without changing the amino acid sequences of ARFD1A(B), which was used for complementation of the amiRNA knockdown arfd1-1 mutants. F, RT-PCR analysis of ARFD1A and ARFD1B expression in the complementary lines of ARFD1B miRr (microRNA interference resistant)-GFP/arfd1-1, and ARFD1A miRr-HA/arfd1-1, as well as the control Col-0 plants. ACTIN2 was used as internal control. G, The phenotypes of the 5-day-old seedlings of arfd1-1, Col-0, and the complementary lines of ARFD1B miRr-GFP/arfd1-1 and ARFD1A miRr-HA/arfd1-1 grown in 1/2 MS or 1/2 MS with 30-μM DEX. H, Quantification of root length of the complementary plants grown in 1/2 MS or 1/2 MS with 30-μM DEX shown in (G). The data represent the mean values from three independent experiments ± se (***P ≤ 0.001, ns represents no significant difference, one-way ANOVA test).
Figure 4
Figure 4
The formation of cell plates was disrupted in arfd1-1 mutants. A, B, Confocal imaging analysis of cell plate formation in root cells of 5-day-old transgenic Arabidopsis seedlings expressing GFP-KNOLLE in the WT (Col-0) or arfd1-1 mutant background, grown on 1/2 MS with 30-μM DEX. Arrows indicate examples of disruption of the cell plates marked by the GFP-KNOLLE in arfd1-1 mutant. Bars = 10 μm. C, Quantification of cell plate deficiency ratio in root cells of the WT Col-0 and arfd1-1 mutant seedlings shown in (A) and (B). The data represent the mean values ± se from three independent experiments at least 50 cells (***P ≤ 0.001, t test). D–G, TEM analysis of cell plate formation in Col-0, arfd1-1 mutant and the complementary lines of ARFD1B miRr/arfd1-1 and ARFD1A miRr/arfd1-1. TEM images of ultra-thin sections prepared from high-pressure frozen/freeze-substituted root cells of 5-day-old Col-0, arfd1-1, complementary lines of ARFD1B miRr/arfd1-1 and ARFD1A miRr/arfd1-1 seedlings grown on 1/2 MS with 30-μM DEX. Arrows indicate examples of abnormal cell plate formation in arfd1-1 mutant. Bars = 2 μm.
Figure 5
Figure 5
TEM analysis of Golgi morphology in arfd1-1 mutant and the two complementary lines. A–H, TEM analysis of Golgi morphology in Col-0, arfd1-1 mutant and the two complementary lines of ARFD1B miRr/arfd1-1 and ARFD1A miRr/arfd1-1. TEM images of ultra-thin sections prepared from high-pressure frozen/freeze-substituted root cells of 5-day-old Col-0 and arfd1-1 seedlings grown on 1/2 MS with 30-μM DEX. arfd1-1 mutants displayed bent Golgi stacks (C and D) as compared with Col-0 (A and B) and the two complementary lines of ARFD1B miRr/arfd1-1 (E and F) and ARFD1A miRr/arfd1-1 (G and H). Bar = 500 nm. I, Quantification of bent Golgi stack ratio in Col-0 and arfd1-1 mutant and the two complementary lines of ARFD1B miRr/arfd1-1 and ARFD1A miRr/arfd1-1 seedlings grown on 1/2 MS with 30-μM DEX as shown in (A)–(H). The data represent the mean values from three independent experiments ±se. Different letters denote significant difference by one-way ANOVA test (P ≤ 0.05).
Figure 6
Figure 6
ARFD1B interacts with the COPI subunits. A, SDS–PAGE analysis of GST-ARFD1B pull-down protein samples. The GST-ARFD1B protein was expressed and purified from E. coli, followed by conjugation to GST Spin Trap and incubated with total proteins extracted from 5-day-old Arabidopsis seedlings. The bound proteins were separated by SDS–PAGE and stained with Coomassie Blue, followed by LC–MS/MS analysis on the protein bands for subsequent protein identification. Arrowheads indicate examples of identified proteins in this assay. B, Identification of COPI subunits as ARFD1B-interacting partners in pull-down assay shown in (A). C, BiFC assay on the interaction of ARFD1B with α1-COP, β1-COP, and γ-COP. The expression of YFPn-ARFD1B/YFPc was used as negative control. YFPn, N-terminal domain of yellow fluorescent protein; YFPc, C-terminal domain of YFP. Bars = 30 μm. D, Y2H analysis of interactions between ARFD1B and α1-COP, β1-COP, or γ-COP. Yeast cells transformed with plasmids were grown on the synthetic complete medium lacking Leu and Trp (SD-2) as a transformation control, or SD medium lacking Leu, Trp, His (SD-3) with 1-mM 3-AT for interaction assays. E, Co-IP analysis of interactions between ARFD1B and α1-COP, β1-COP, or γ-COP. Arabidopsis protoplasts co-expressing YFP-tagged α1-COP, β1-COP, γ-COP, or empty YFP with ARFD1B-4xHA were subjected to protein extraction and subsequent IP with GFP-trap, followed by immunoblot analysis with the indicated antibodies. Arrows indicate the corresponding detected proteins.
Figure 7
Figure 7
Working model of ARFD1 functions in regulating Golgi morphology and cell plate formation. A, In WT Col-0 plant, ARFD1B localized in cytosol and partially colocalized with the Golgi marker ST-RFP in the Golgi apparatus. ARFD1B proteins also interacted preferentially with the COPI subunit β-COP. B, In arfd1-1 mutant plant, the depletion or reduction of ARFD1 in the Golgi apparatus resulted in abnormal Golgi morphology as well as defects in KNOLLE localization and cell plate formation. MVB, multivesicular body.

Similar articles

Cited by

References

    1. Ahn HK, Kang YW, Lim HM, Hwang I, Pai HS (2015) Physiological functions of the COPI complex in higher plants. Mol Cells 38: 866–875 - PMC - PubMed
    1. Anders N, Jurgens G (2008) Large ARF guanine nucleotide exchange factors in membrane trafficking. Cell Mol Life Sci 65: 3433–3445 - PMC - PubMed
    1. Aniento F, Sánchez de Medina Hernández V, Dagdas Y, Rojas-Pierce M, Russinova E (2022) Molecular mechanisms of endomembrane trafficking in plants. Plant Cell 34: 146–173 - PMC - PubMed
    1. Aoyama T, Chua NH (1997) A glucocorticoid-mediated transcriptional induction system in transgenic plants. Plant J 11: 605–612 - PubMed
    1. Aridor M, Bannykh SI, Rowe T, Balch WE (1995) Sequential coupling between COPII and COPI vesicle coats in endoplasmic reticulum to Golgi transport. J Cell Biol 131: 875–893 - PMC - PubMed

Publication types

MeSH terms

LinkOut - more resources