Overcoming selection bias in synthetic lethality prediction
- PMID: 35876858
- PMCID: PMC9477536
- DOI: 10.1093/bioinformatics/btac523
Overcoming selection bias in synthetic lethality prediction
Abstract
Motivation: Synthetic lethality (SL) between two genes occurs when simultaneous loss of function leads to cell death. This holds great promise for developing anti-cancer therapeutics that target synthetic lethal pairs of endogenously disrupted genes. Identifying novel SL relationships through exhaustive experimental screens is challenging, due to the vast number of candidate pairs. Computational SL prediction is therefore sought to identify promising SL gene pairs for further experimentation. However, current SL prediction methods lack consideration for generalizability in the presence of selection bias in SL data.
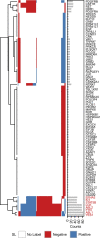
Results: We show that SL data exhibit considerable gene selection bias. Our experiments designed to assess the robustness of SL prediction reveal that models driven by the topology of known SL interactions (e.g. graph, matrix factorization) are especially sensitive to selection bias. We introduce selection bias-resilient synthetic lethality (SBSL) prediction using regularized logistic regression or random forests. Each gene pair is described by 27 molecular features derived from cancer cell line, cancer patient tissue and healthy donor tissue samples. SBSL models are built and tested using approximately 8000 experimentally derived SL pairs across breast, colon, lung and ovarian cancers. Compared to other SL prediction methods, SBSL showed higher predictive performance, better generalizability and robustness to selection bias. Gene dependency, quantifying the essentiality of a gene for cell survival, contributed most to SBSL predictions. Random forests were superior to linear models in the absence of dependency features, highlighting the relevance of mutual exclusivity of somatic mutations, co-expression in healthy tissue and differential expression in tumour samples.
Availability and implementation: https://github.com/joanagoncalveslab/sbsl.
Supplementary information: Supplementary data are available at Bioinformatics online.
© The Author(s) 2022. Published by Oxford University Press.
Figures


References
-
- Bangdiwala S.I. (1989) The wald statistic in proportional hazards hypothesis testing. Biom. J., 31, 203–211.
-
- Behan F.M. et al. (2019) Prioritization of cancer therapeutic targets using CRISPR–Cas9 screens. Nature, 568, 511–516. - PubMed
Publication types
MeSH terms
Grants and funding
LinkOut - more resources
Full Text Sources
Medical

