. 2022 Sep;144(3):437-464.
doi: 10.1007/s00401-022-02470-z. Epub 2022 Jul 25.

An interaction between synapsin and C9orf72 regulates excitatory synapses and is impaired in ALS/FTD

Affiliations

An interaction between synapsin and C9orf72 regulates excitatory synapses and is impaired in ALS/FTD

Claudia S Bauer et al. Acta Neuropathol. 2022 Sep.

Abstract

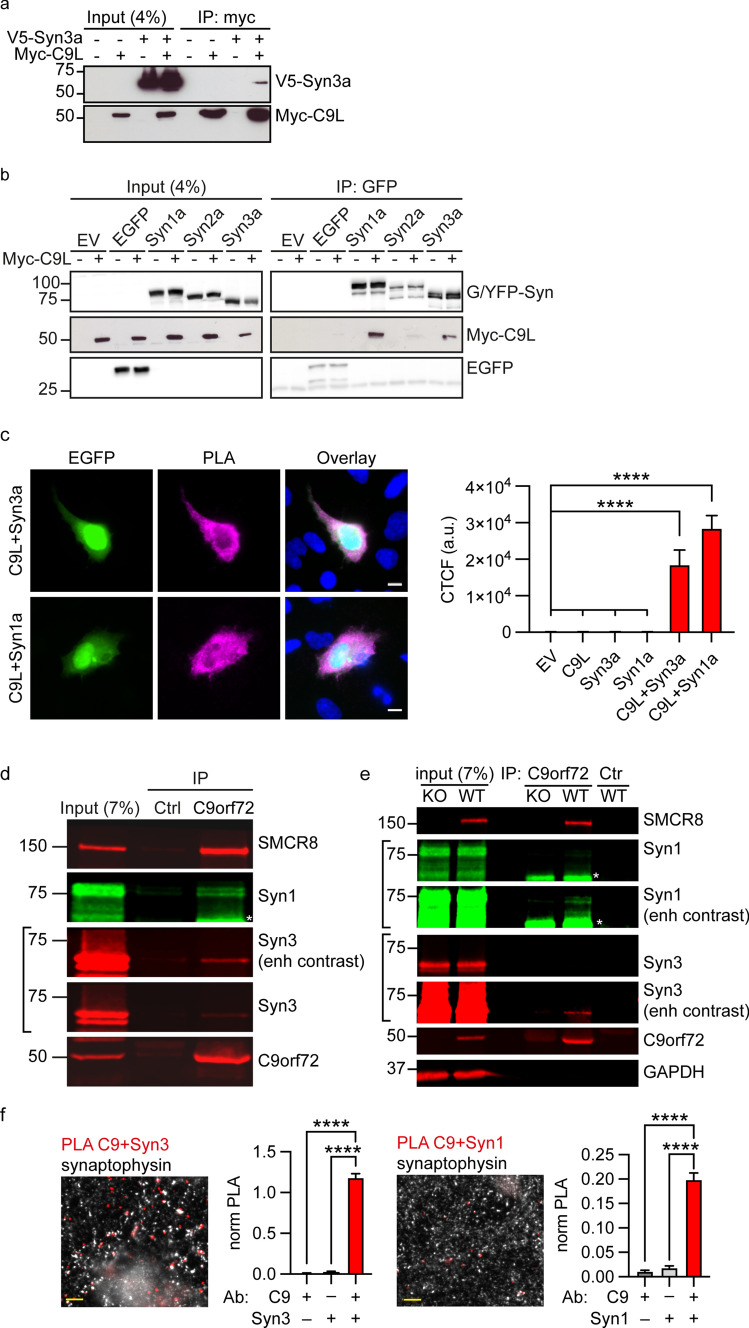
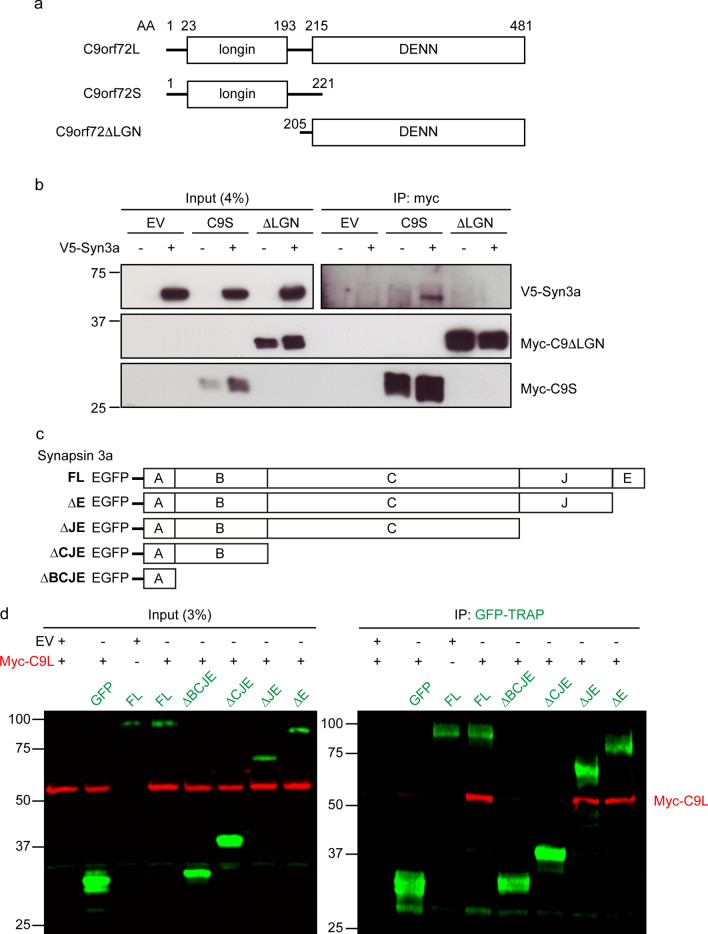
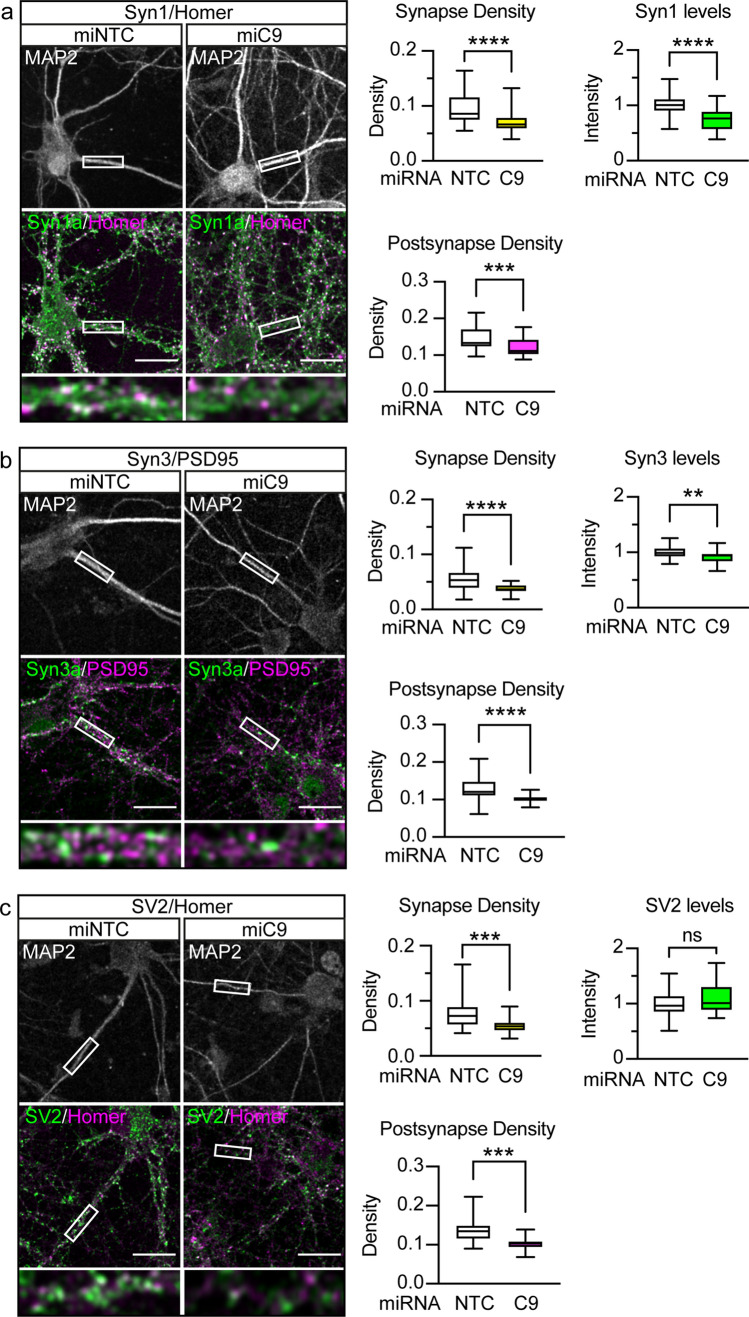
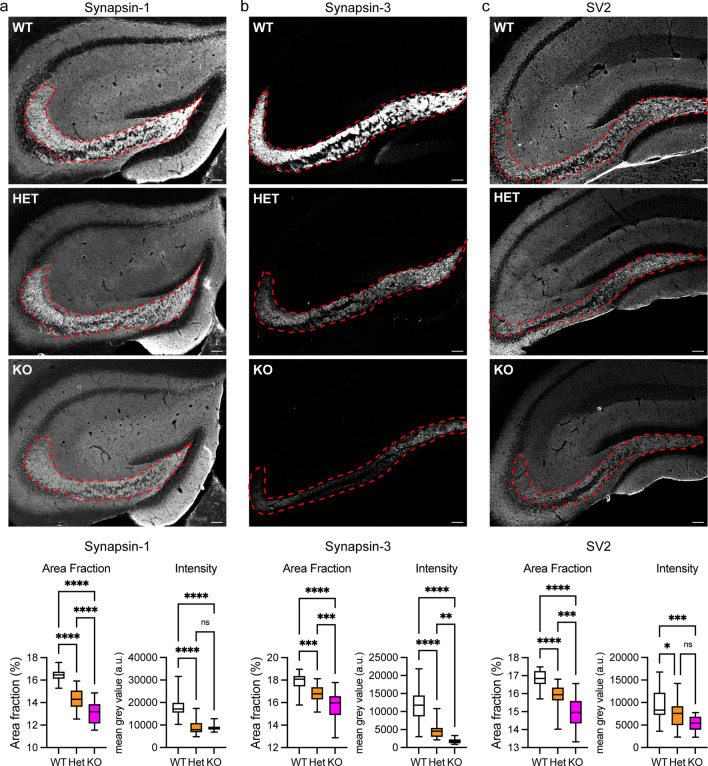
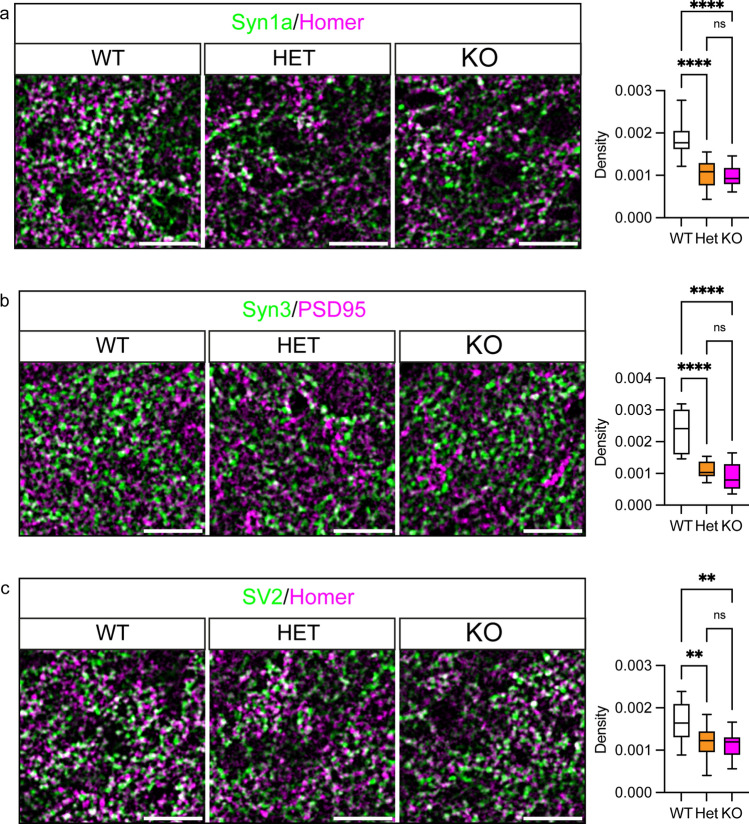
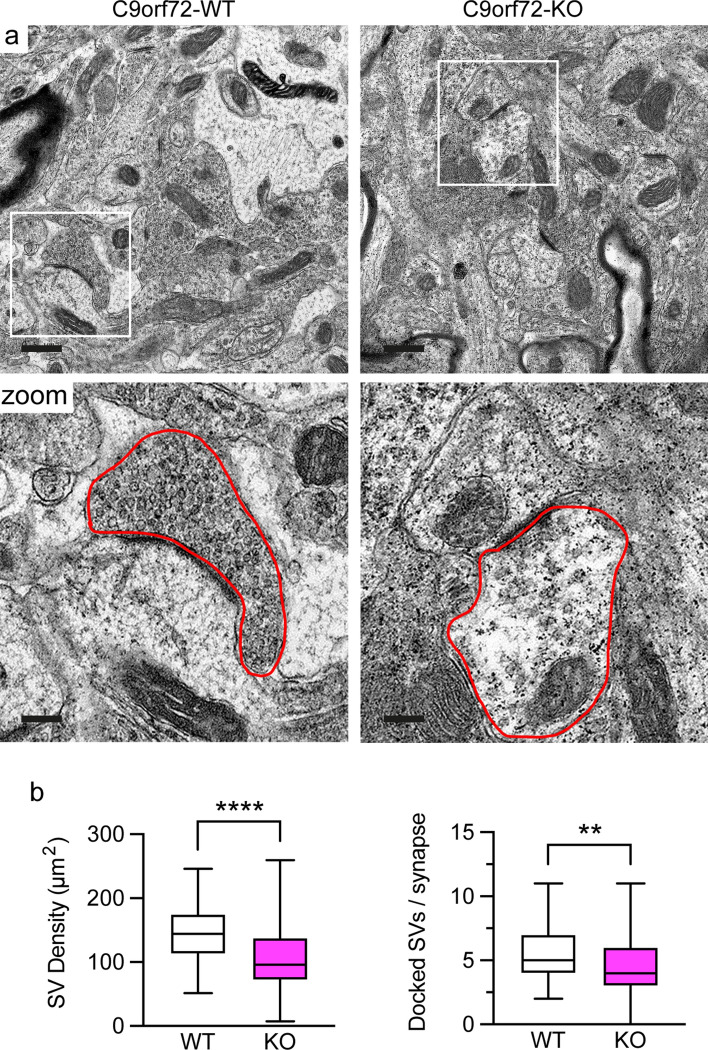
Dysfunction and degeneration of synapses is a common feature of amyotrophic lateral sclerosis and frontotemporal dementia (ALS/FTD). A GGGGCC hexanucleotide repeat expansion in the C9ORF72 gene is the main genetic cause of ALS/FTD (C9ALS/FTD). The repeat expansion leads to reduced expression of the C9orf72 protein. How C9orf72 haploinsufficiency contributes to disease has not been resolved. Here we identify the synapsin family of synaptic vesicle proteins, the most abundant group of synaptic phosphoproteins, as novel interactors of C9orf72 at synapses and show that C9orf72 plays a cell-autonomous role in the regulation of excitatory synapses. We mapped the interaction of C9orf72 and synapsin to the N-terminal longin domain of C9orf72 and the conserved C domain of synapsin, and show interaction of the endogenous proteins in synapses. Functionally, C9orf72 deficiency reduced the number of excitatory synapses and decreased synapsin levels at remaining synapses in vitro in hippocampal neuron cultures and in vivo in the hippocampal mossy fibre system of C9orf72 knockout mice. Consistent with synaptic dysfunction, electrophysiological recordings identified impaired excitatory neurotransmission and network function in hippocampal neuron cultures with reduced C9orf72 expression, which correlated with a severe depletion of synaptic vesicles from excitatory synapses in the hippocampus of C9orf72 knockout mice. Finally, neuropathological analysis of post-mortem sections of C9ALS/FTD patient hippocampus with C9orf72 haploinsufficiency revealed a marked reduction in synapsin, indicating that disruption of the interaction between C9orf72 and synapsin may contribute to ALS/FTD pathobiology. Thus, our data show that C9orf72 plays a cell-autonomous role in the regulation of neurotransmission at excitatory synapses by interaction with synapsin and modulation of synaptic vesicle pools, and identify a novel role for C9orf72 haploinsufficiency in synaptic dysfunction in C9ALS/FTD.

Keywords: Amyotrophic lateral sclerosis; C9orf72; Frontotemporal dementia; Synapse; Synapsin.


Figures

Fig. 1
Fig. 1
Synapsin family proteins are novel binding partners of C9orf72. a Lysates of HEK293 cells co-transfected with Myc-C9orf72L (Myc-C9L) and either empty vector (EV) or V5-tagged Synapsin-3a (V5-Syn3a) were subjected to immunoprecipitation using an anti-Myc antibody. Immune pellets were probed for Myc-C9orf72L and V5-Syn3a on immunoblots. b Lysates of HEK293 cells co-transfected with Myc-C9L and either EV, EGFP or EGFP-Syn1a, YFP-Syn2a, EGFP-Syn3a were subjected to immunoprecipitation using an anti-GFP antibody. Immune pellets were probed for GFP/YFP and Myc-C9orf72L on immunoblots. c HEK293 cells were co-transfected with either Myc-C9L + V5-Syn3a or with Myc-C9L + V5-Syn1a. Transfections were laced with EGFP (green) to identify transfected cells. Cells were fixed and immunostained with both anti-V5 and anti-Myc antibodies and processed for PLA (PLA, magenta), nuclear staining with Hoechst (blue). Images are representative of the individual channels and their overlay. Scale bar 10 μm. Intensity of PLA signals per cell was analysed as corrected total cellular fluorescence (CTCF); data are presented as mean ± SEM; n (cells analysed) EV = 107, C9L = 92, Syn3a = 113, Syn1a = 79, C9L + Syn3a = 129, C9L + Syn1a = 109 from three or 4 replicate experiments. Statistical significance was determined by one-way ANOVA with Tukey’s multiple comparisons test, ****P < 0.0001. Images showing the single transfection controls are shown in Supplementary Fig. 2, Online Resource. d Lysates of synaptosomes prepared from 12-week-old mouse brains were subjected to immunoprecipitation using an anti-C9orf72 antibody or an irrelevant antibody (Ctrl) raised in the same species as the C9orf72 antibody. Immune pellets were probed for endogenous SMCR8, C9orf72, Syn3 and Syn1 (* indicates a nonspecific band; enh, enhanced). e Lysates of synaptosomes prepared from 12-week-old C9orf72-WT and C9orf72-KO mouse brains were subjected to immunoprecipitation using an anti-C9orf72 antibody or a control antibody (M2). Immune pellets were probed for endogenous SMCR8, C9orf72, Syn3 and Syn1 (* indicates a nonspecific band; enh, enhanced). f 12DIV primary rat hippocampal neurons were fixed and immunostained with pairs of antibodies against C9orf72 and Syn3 (C9 + Syn3) or C9orf72 and Syn1 (C9 + Syn1) together with an antibody against synaptophysin and processed for PLA. Overlay PLA signals (red) between C9 + Syn3 or C9 + Syn1 and synaptophysin (white). Scale bar 5 μm. For quantification, the number of PLA spots per image was normalised (norm PLA) to the mean grey intensity of the synaptophysin image. Data are presented as mean ± SEM; n (images analysed) C9 = 14, Syn1 = 14, Syn3 = 15, C9 + Syn1 = 59, C9 + Syn3 = 62 from two or three replicate experiments. Statistical significance was determined by one-way ANOVA with Tukey’s multiple comparisons test, ****P < 0.0001. Single antibody controls are shown in Supplementary Fig. 2, Online Resource
Fig. 2
Fig. 2
The N-terminal longin domain of C9orf72 interacts with the C domain of synapsin. a Schematic representation of human C9orf72L, C9orf72S and the truncated C9orf72ΔLGN protein with their corresponding domain boundaries. b Cell lysates of HEK293 cells co-transfected with V5-Syn3a and either empty vector (EV), Myc-C9orf72S (C9S) or Myc-C9orf72ΔLGN (ΔLGN) were subjected to immunoprecipitation using an anti-Myc antibody. Immune pellets were probed for Myc-C9orf72 and V5-Syn3a on immunoblots. c Schematic representation of full-length EGFP-Syn3a (FL) and truncated EGFP-Syn3a proteins with removed domains indicated (∆E, ∆JE, ∆CJE, ∆BCJE). d HEK293 cells were co-transfected with either empty vector (EV) or Myc-C9orf72L (Myc-C9L) together with EGFP (GFP), full-length EGFP-Syn3a (FL) or truncated (∆E, ∆JE, ∆CJE, ∆BCJE) EGFP-Syn3a. Lysates were subjected to immunoprecipitation using GFP-TRAP beads. Immune pellets of input and IP samples were probed for Myc-C9orf72L (red) and EGFP or EGFP-Syn3a (green)
Fig. 3
Fig. 3
C9orf72 haploinsufficiency reduces the number of excitatory synapses. Primary rat hippocampal neurons were transduced with EmGFP non-targeting control miRNA (miNTC) or C9orf72 miRNA (miC9) lentivirus at 5DIV. Neurons were immunostained at 12DIV for the dendritic marker MAP2 (white) and pre- (green) and postsynaptic (magenta) pairs: a Syn1 and Homer, b Syn3 and PSD95, c SV2 and Homer. Representative confocal images are shown. Boxes denote zoom area, note: co-localisation of pre- (green) and postsynaptic marker (magenta) appears white. Scale bar: 10 μm. Synapse density and the density of postsynapses was quantified per image for each staining pair and are presented as box and whisker plots. The mean intensity of presynaptic staining within detected synapses was quantified per image and is presented as box and whisker plots. a Syn1/Homer with n (images analysed) miRNA NTC = 41, miRNA C9 = 43 from 4 replicate experiments, b Syn3/PSD95, with n (images analysed) miRNA NTC = 30, miRNA C9 = 30 from three replicate experiments, c SV2/Homer with n (images analysed) miRNA NTC = 29, miRNA C9 n = 30 from three replicate experiments. Statistical significance was determined by unpaired two-tailed t test, ns (not significant), *P < 0.05, **P < 0.01, ***P < 0.001, ****P < 0.0001
Fig. 4
Fig. 4
Loss of C9orf72 reduces levels of synapsin in the hippocampus in vivo. Representative images of hippocampal sections of 12-week-old C9orf72-WT, C9orf72-HET and C9orf72-KO mice stained for a Syn1, b Syn3 or c SV2. Syn1, Syn3, and SV2 levels in the mossy fibre area (outlined) were quantified as the area fraction of positive staining (Area Fraction) and the mean fluorescence intensity level (Intensity) within the outlined area was determined per section. Scale bar 100 µm. Data are presented as box and whisker plots; a Syn1, n (sections analysed) WT = 26, HET = 26, KO = 27 from 5 animals/genotype; b Syn3, n (sections analysed) WT = 30, HET = 28, KO = 26 from 5 animals/genotype; c SV2, n (sections analysed) WT = 26 HET = 24 and KO = 16 from 5 animals/genotype. Statistical significance was determined by one-way ANOVA with Tukey’s multiple comparisons test, ns (not significant), *P < 0.05, **P < 0.01, ***P < 0.001, ****P < 0.0001
Fig. 5
Fig. 5
Loss of C9orf72 reduces synaptic density in the hippocampus in vivo. Representative enhanced images showing a Syn1/Homer (green/magenta), b Syn3/PSD95 (green/magenta) or c SV2/Homer (green/magenta) pre- and postsynaptic marker pairs in the hilus of the dentate gyrus (CA4) region of the hippocampus of 12-week-old C9orf72-WT, C9orf72-HET and C9orf72-KO mice. Scale bar 20 µm. Synaptic density (density) was determined from the co-occurrence of pre- and postsynaptic marker pairs (white) in the hilus of the dentate gyrus (CA4) region. Data are presented as box and whisker plots; a Syn1/Homer, n (sections analysed) WT = 15, HET = 13, KO = 14 from 5 animals/genotype; b Syn3/PSD95, n (sections analysed) WT = 9, HET = 9, KO = 9 from 3 animals/genotype c SV2/Homer, n (sections analysed) WT = 15 HET = 14 and KO = 14 from 5 animals/genotype. Statistical significance was determined by one-way ANOVA with Tukey’s multiple comparisons test, ns (not significant), **P < 0.01, ****P < 0.0001
Fig. 6
Fig. 6
Levels of C9orf72 and synapsin-1 are reduced in C9ALS/FTD hippocampus. a Representative image of post-mortem immunohistochemistry staining for C9orf72 in the hippocampus of a neurologically healthy control (CTRL) brain with the CA1, CA2, CA3 and CA4 region indicated. Scale bar: 1 mm. Box denotes zoom area. Open arrows in zoom illustrate the interface between the CA3 and CA2 region. Scale bar 100 µm. b Representative images of C9orf72 staining in the hippocampus of a CTRL and a C9ALS/FTD case. Insert: red areas depict the automated colour threshold used for quantification of the staining. Scale bar 50 µm. The area fraction of positive staining was determined in two CA3 and two CA4 regions per case and is presented as box and whisker plots; n (CA3/Ca4 regions), CTRL = 12 from 3 cases, C9ALS/FTD = 20 from 5 cases. Statistical significance was determined by unpaired two-tailed t test, *P < 0.05. cd Representative images of Syn1 (c) and SV2 (d) staining in the hippocampus of a CTRL, C9ALS/FTD and FTD case. Insert: red areas depict the automated colour threshold used for quantification of the staining. Scale bar 50 µm. The area fraction of positive staining was determined in two CA3 and two CA4 regions per case and is presented as box and whisker plots; n (CA3/Ca4 regions); Syn1 n (CA3/Ca4 regions) CTRL = 16 from 4 individuals, C9ALS/FTD = 20 from 5 cases, FTD = 12 from three cases; SV2 n (CA3/Ca4 regions) CTRL = 12 from 4 individuals, C9ALS/FTD = 20 of 5 cases, FTD = 12 from three cases. Statistical significance was determined by one-way ANOVA with Tukey’s multiple comparisons test, ns (not significant), **P < 0.01, ***P < 0.001
Fig. 7
Fig. 7
Loss of C9orf72 affects synaptic vesicle pools in the hippocampus in vivo. a Representative transmission electron micrographs of the CA3 region of the hippocampus from 12-week old C9orf72-WT or C9orf72-KO mice. Scale bar 0.5 μm. Box denotes zoomed area. An excitatory nerve terminal is outlined by the red line in the zoomed area. Scale bar 0.15 μm. b Quantification of the density of synaptic vesicles (SV density, μm2) and the number of docked synaptic vesicles per synapse (Docked SVs/synapse) in C9orf72-WT and -KO excitatory synapses. Data are is presented as box and whisker plots; n (synapses analysed) WT = 81, KO = 105 obtained from 4 C9orf72-WT and 5 C9orf72-KO animals. Statistical significance was determined by unpaired two-tailed t test, **P < 0.01, ****P < 0.0001
Fig. 8
Fig. 8
C9orf72 haploinsufficiency affects excitatory neurotransmission and network function. a–c Primary rat hippocampal neurons were transduced with non-targeting control miRNA (miRNA NTC) or C9orf72 miRNA (miRNA C9orf72) lentivirus at 5DIV and miniature excitatory postsynaptic current (mEPSC) traces were recorded from single neurons on 12–13DIV at a holding potential of –70 mV (–84 mV with liquid junction potential correction). a Representative current traces, b mEPSC interevent interval time and c mEPSC amplitude data are presented as cumulative probability and mean ± SEM of n = number of cells recorded n (cells) miRNA-NTC = 15, miRNA-C9 = 13 from three individual batches of neurons. Statistical significance was determined by unpaired two-tailed t test, ns (not significant), *P < 0.05. d–g Multi-electrode array (MEA) recordings to measure network activity were performed at 12–13DIV on hippocampal neuron cultures transduced with non-targeting control miRNA (miRNA-NTC) or C9orf72 miRNA (miRNA-C9) lentivirus at 5DIV. d Representative traces of a single array channel electrode recorded from miRNA NTC or miRNA C9-transduced neurons. Scale bars 5 s, 50 μV. Network activity characteristics were quantified by determining the e interburst interval of network bursts, f intra-network burst spiking frequency, g network burst length. Data are presented as mean ± SEM of n = number of MEA arrays, n (arrays) miRNA-NTC = 6, miRNA-C9 = 7 from 4 individual batches of neurons. Statistical significance was determined by unpaired two-tailed t test, ns (not significant), *P < 0.05

References

    1. Al-Sarraj S, King A, Troakes C, Smith B, Maekawa S, Bodi I, et al. p62 positive, TDP-43 negative, neuronal cytoplasmic and intranuclear inclusions in the cerebellum and hippocampus define the pathology of C9orf72-linked FTLD and MND/ALS. Acta Neuropathol. 2011;122:691–702. doi: 10.1007/s00401-011-0911-2. - DOI - PubMed
    1. Amick J, Roczniak-Ferguson A, Ferguson SM. C9orf72 binds SMCR8, localizes to lysosomes, and regulates mTORC1 signaling. Mol Biol Cell. 2016;27:3040–3051. doi: 10.1091/mbc.E16-01-0003. - DOI - PMC - PubMed
    1. Aoki Y, Manzano R, Lee Y, Dafinca R, Aoki M, Douglas AGL, et al. C9orf72 and RAB7L1 regulate vesicle trafficking in amyotrophic lateral sclerosis and frontotemporal dementia. Brain. 2017;140:887–897. doi: 10.1093/brain/awx024. - DOI - PubMed
    1. Augustin I, Rosenmund C, Südhof TC, Brose N. Munc13-1 is essential for fusion competence of glutamatergic synaptic vesicles. Nature. 1999;400:457–461. doi: 10.1038/22768. - DOI - PubMed
    1. Balendra R, Isaacs AM. C9orf72-mediated ALS and FTD: multiple pathways to disease. Nat Rev Neurol. 2018;14:544–558. doi: 10.1038/s41582-018-0047-2. - DOI - PMC - PubMed