

Molecular Differences between Squamous Cell Carcinoma and Adenocarcinoma Cervical Cancer Subtypes: Potential Prognostic Biomarkers
- PMID: 35877232
- PMCID: PMC9322365
- DOI: 10.3390/curroncol29070372
Molecular Differences between Squamous Cell Carcinoma and Adenocarcinoma Cervical Cancer Subtypes: Potential Prognostic Biomarkers
Abstract
The most frequently diagnosed histological types of cervical cancer (CC) are squamous cell carcinoma (SCC) and adenocarcinoma (ADC). Clinically, the prognosis of both types is controversial. A molecular profile that distinguishes each histological subtype and predicts the prognosis would be of great benefit to CC patients.
Methods: The transcriptome of CC patients from The Cancer Genome Atlas (TCGA) was analyzed using the DESeq2 package to obtain the differentially expressed genes (DEGs) between ADC and SCC. The DEGs were validated on a publicly available Mexican-Mestizo patient transcriptome dataset (GSE56303). The global biological pathways involving the DEGs were obtained using the Webgestalt platform. The associations of the DEGs with Overall Survival (OS) were assessed. Finally, three DEGs were validated by RT-qPCR in an independent cohort of Mexican patients.
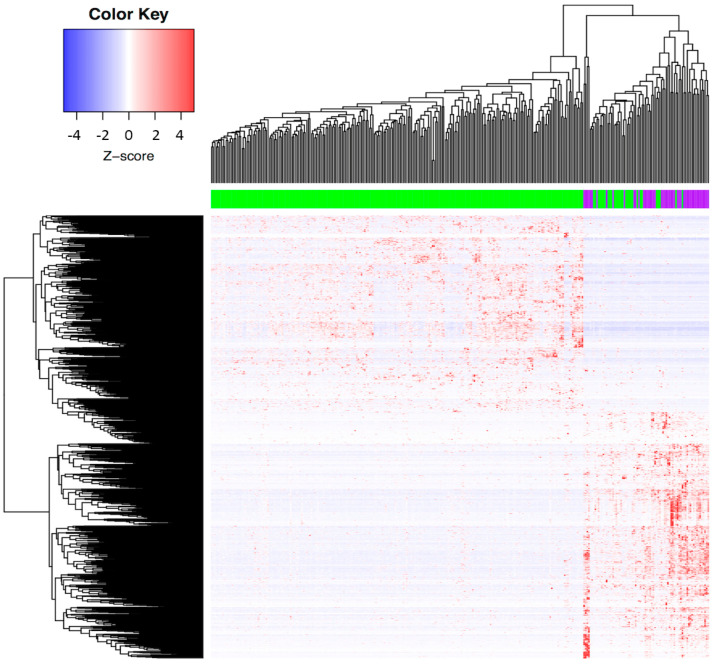
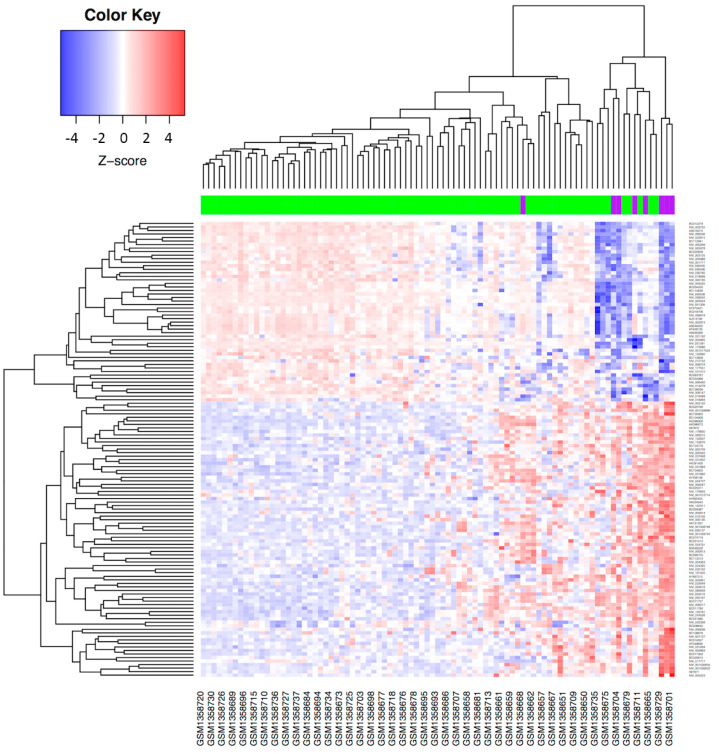
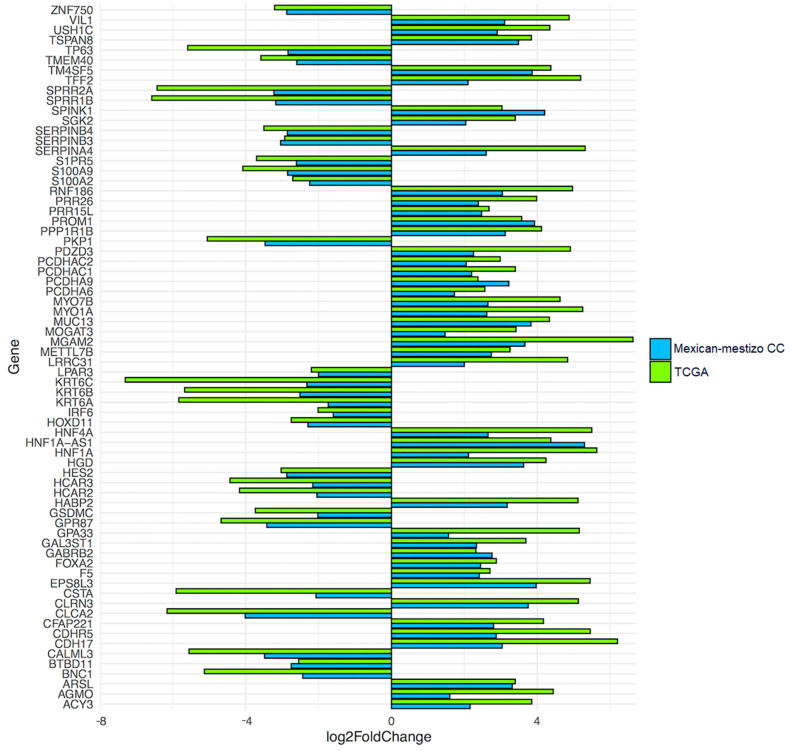
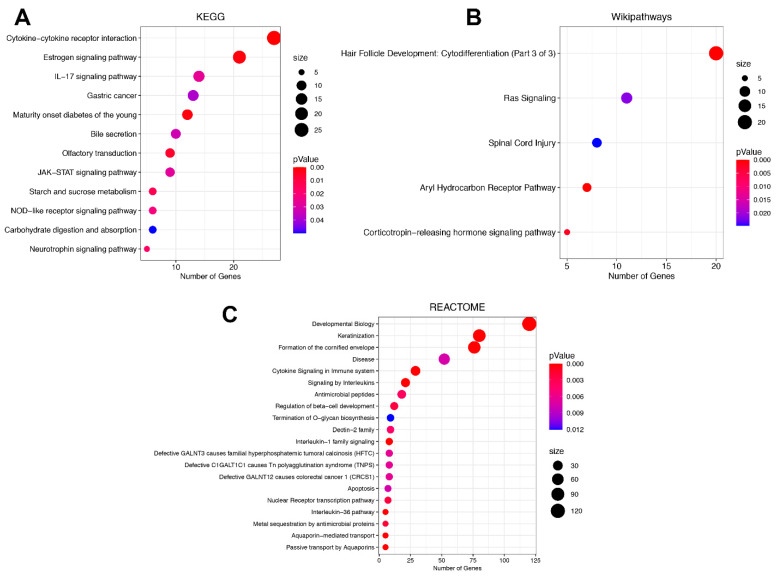
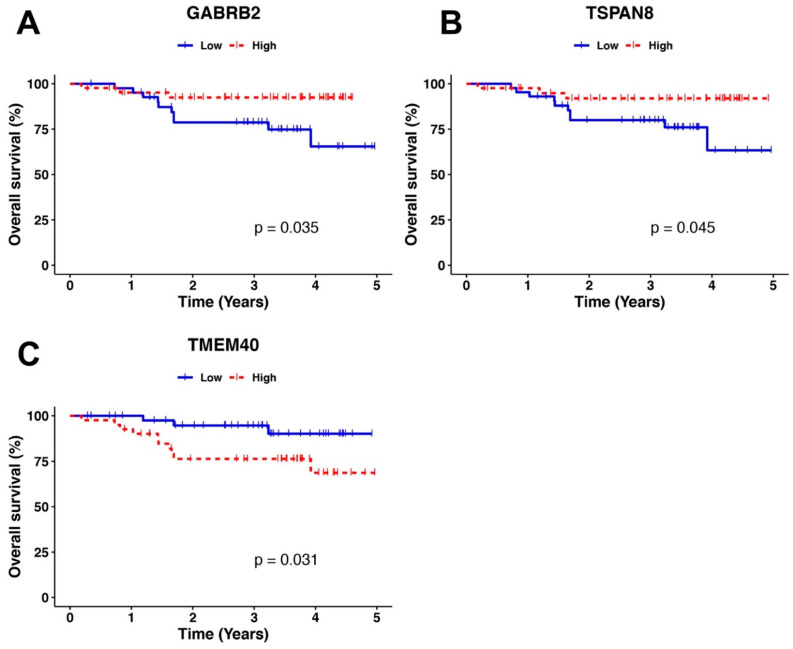
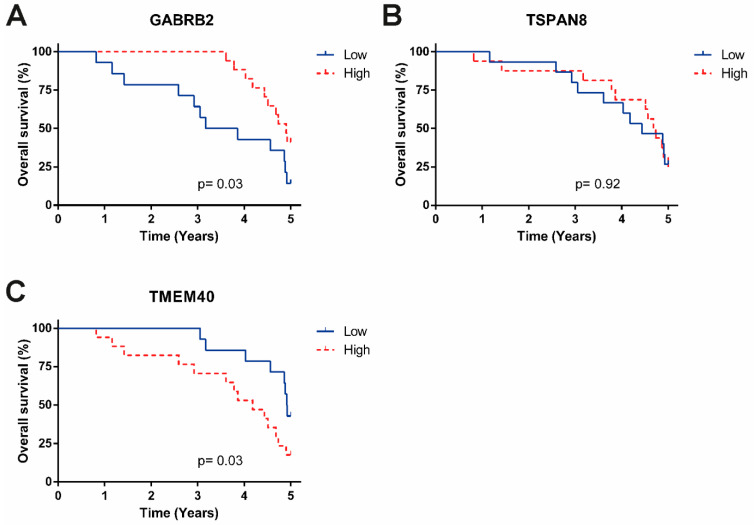
Results: The molecular profiles of ADC and SCC of the CC patients of the TCGA database and the Mexican-Mestizo cohort (GSE56303) were determined obtaining 1768 and 88 DEGs, respectively. Strikingly, 70 genes were concordant-with similar Log2FoldChange values-in both cohorts. The 70 DEGs were involved in IL-17, JAK/STAT, and Ras signaling. Kaplan-Meier OS analysis from the Mexican-Mestizo cohort showed that higher GABRB2 and TSPAN8 and lower TMEM40 expression were associated with better OS. Similar results were found in an independent Mexican cohort.
Conclusions: Molecular differences were detected between the ADC and SCC subtypes; however, further studies are required to define the appropriate prognostic biomarker for each histological type.
Keywords: adenocarcinoma; cervical cancer; squamous cell carcinoma.
Conflict of interest statement
The authors declare no conflict of interest.
Figures
References
-
- Fernandez-Retana J., Lasa-Gonsebatt F., Lopez-Urrutia E., Coronel-Martínez J., Cantu De Leon D., Jacobo-Herrera N., Peralta-Zaragoza O., Perez-Montiel D., Reynoso-Noveron N., Vazquez-Romo R., et al. Transcript profiling distinguishes complete treatment responders with locally advanced cervical cancer. Transl. Oncol. 2015;8:77–84. doi: 10.1016/j.tranon.2015.01.003. - DOI - PMC - PubMed
-
- Lee K.B., Lee J.M., Park C.Y., Lee K.B., Cho H.Y., Ha S.Y. What is the difference between squamous cell carcinoma and adenocarcinoma of the cervix? A matched case-control study. Int. J. Gynecol. Cancer Off. J. Int. Gynecol. Cancer Soc. 2006;16:1569–1573. doi: 10.1111/j.1525-1438.2006.00628.x. - DOI - PubMed
-
- Muñoz N., Bosch F.X., de Sanjosé S., Herrero R., Castellsagué X., Shah K.V., Snijders P.J.F., Meijer C.J.L.M., International Agency for Research on Cancer Multicenter Cervical Cancer Study Group Epidemiologic classification of human papillomavirus types associated with cervical cancer. N. Engl. J. Med. 2003;348:518–527. doi: 10.1056/NEJMoa021641. - DOI - PubMed
-
- Hamzi Abdul Raub S., Isa N.M., Zailani H.A., Omar B., Abdullah M.F., Mohd Amin W.A., Noor R.M., Ayub M.C., Abidin Z., Kassim F., et al. Distribution of HPV genotypes in cervical cancer in multi- ethnic Malaysia. Asian Pac. J. Cancer Prev. APJCP. 2014;15:651–656. doi: 10.7314/APJCP.2014.15.2.651. - DOI - PubMed
