. 2022 Jun 25;8(7):404.
doi: 10.3390/gels8070404.

An Engineered Protein-Based Building Block (Albumin Methacryloyl) for Fabrication of a 3D In Vitro Cryogel Model

Affiliations

An Engineered Protein-Based Building Block (Albumin Methacryloyl) for Fabrication of a 3D In Vitro Cryogel Model

Xueming Niu et al. Gels. .

Abstract

Drug-induced liver injury (DILI) is a leading cause of attrition in drug development or withdrawal; current animal experiments and traditional 2D cell culture systems fail to precisely predict the liver toxicity of drug candidates. Hence, there is an urgent need for an alternative in vitro model that can mimic the liver microenvironments and accurately detect human-specific drug hepatotoxicity. Here, for the first time we propose the fabrication of an albumin methacryloyl cryogel platform inspired by the liver's microarchitecture via emulating the mechanical properties and extracellular matrix (ECM) cues of liver. Engineered crosslinkable albumin methacryloyl is used as a protein-based building block for fabrication of albumin cryogel in vitro models that can have potential applications in 3D cell culture and drug screening. In this work, protein modification, cryogelation, and liver ECM coating were employed to engineer highly porous three-dimensional cryogels with high interconnectivity, liver-like stiffness, and liver ECM as artificial liver constructs. The resulting albumin-based cryogel in vitro model provided improved cell-cell and cell-material interactions and consequently displayed excellent liver functional gene expression, being conducive to detection of fialuridine (FIAU) hepatotoxicity.

Keywords: 3D in vitro models; albumin methacryloyl; cryogels; liver tissue engineering.


Conflict of interest statement

The authors declare no conflict of interest.

Figures

Figure 1
Figure 1
Schematic illustration presenting the fabrication of an engineered albumin-based liver scaffold for hepatotoxicity evaluation. (A) Liver. (B) Liver-derived albumin. (C) Albumin-MA was obtained via the methacryloylation. (D) Albumin-MA solution with an initiator, APS. (E) Cryogelation with a catalyzer (TEMED) under −20 °C. (F) Albumin-based cryogels after thawing. (G) ECM-coated albumin-based cryogels. (H) Cell-laden albumin-based cryogel liver constructs. (I) Hepatotoxicity evaluation.
Figure 2
Figure 2
Physical characterization of three BSAMA cryogels (B5, B10, and B15). (A) Scanning electron microscopic (SEM) and confocal microscopic images (red: the wall of cryogels). Scale bar: 100 μm in SEM; 200 μm in confocal. (B) Pore size distribution. Black circles, blue squares, and red triangles represent the pore sizes of B5, B10, and B15, respectively. (C) Pore connectivity was demonstrated as a porosity (%). (D) Swelling ratio. n = 3, **: p < 0.01, ***: p < 0.005, ****: p < 0.001, NS means no significant difference between the samples at the extremities of the line. 18 pores were counted in every kind of BSAMA cryogels.
Figure 3
Figure 3
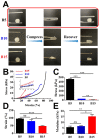
Mechanical properties of BSAMA cryogels (B5, B10, and B15). (A) Shape recovery experiments. 5% w/v BSAMA cryogels (B5) returned to the original shape when the stress was removed. (B) Strain–stress curves were recorded during the axial loading. (C) Maximum stress at a break point. (D) Maximum strain at a break point. (E) Young’s modulus was determined by the slope of the stress–strain curve from 10% to 20% strain. n = 3, *: p < 0.05; **: p < 0.01, ***: p < 0.005, ****: p < 0.001, NS means no significant difference between the samples at the extremities of the line.
Figure 4
Figure 4
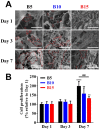
Cell viability on BSAMA cryogels (B5, B10, and B15) for 7 days. (A) SEM images of the inside of cell-laden cryogels at day 1, day 3, and day 7. The outline of cells is marked in red. Scale bar: 100 μm. (B) Cell proliferation. n = 3, **: p < 0.01, ****: p < 0.001, compared to the same cryogel type on the day 1. ###: p < 0.005, between the samples at the extremities of the line.
Figure 5
Figure 5
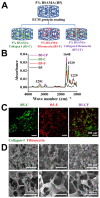
Preparation and characterization of ECM-coated BSAMA cryogels. (A) Schematic illustration presenting the preparation of 5% BSAMA–collagen I (B5-C), 5% BSAMA–fibronectin (B5-F), 5% BSAMA–collagen I–fibronectin (B5-CF). (B) FTIR spectra of unmodified and ECM protein-modified BSAMA cryogels. The broad peaks at 3118–3490 cm−1 resulting from a N-H stretching frequency of amine groups (-NH2). Peaks at 1648 cm−1, 1529 cm−1, and 1229 cm−1 correspond to the stretching/bending of amide-I, amide-II, and amide-III groups, respectively. (C) Immunostaining of collagen I and fibronectin in the ECM-coated BSAMA cryogels. Collagen I was stained with DyLight 488 (Green) and fibronectin was stained with DyLight 594 (red). Scale bar: 200 μm. (D) SEM images of ECM-modified BSAMA cryogels for ensuring that the overall porous structure of the cryogels appeared intact even after the coating. Scale bar: 100 μm (top); 40 μm (bottom).
Figure 6
Figure 6
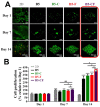
Cell proliferation of 2D, B5, B5-C, B5-F, and B5-CF samples for 14 days. (A) Cell viability was qualitatively assessed via the live/dead assay kit at day 1, day 7, and day 14. Live cells were stained green using calcein-AM, and dead cells were stained red using EthD-1. The 3D images of the inside of cell-laden BSAMA cryogels were taken with a confocal microscope with a 10 × lens. Scale bar: 200 μm (2D); 500 μm (3D). (B) Cell proliferation was quantitatively detected by CCK-8. n = 3, ***: p < 0.005, ****: p < 0.001, compared to the same cryogel type at day 1. #: p < 0.05, ###: p < 0.005, between two samples at the extremities of the line.
Figure 7
Figure 7
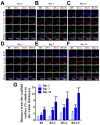
Evaluation of liver-specific functions and cellular infiltration of HepG2 cell constructs in cross-sections of 3D BSAMA cryogels at day 1, day 7, and day 14. (AC) Confocal microscopic images of CYP3A4 immunostaining. Blue: nucleus; red: F-actin; green: CYP3A4. (DF) Confocal microscopic images of albumin immunostaining. Blue: nucleus; red: F-actin; green: albumin. Scale bar: 100 μm. (G) Distance of the cell migration. (n = 3, **: p < 0.01, ***: p < 0.005, ****: p < 0.001), compared to the same cryogel type at day 1.
Figure 8
Figure 8
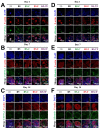
Evaluation of liver-specific functions of HepG2 cell constructs in 3D BSAMA cryogels and on 2D substrates at day 1, day 7, and day 14. (AC) Confocal microscopic images of CYP3A4 immunostaining. Blue: nucleus; red: F-actin; green: CYP3A4. (DF) Confocal microscopic images of albumin immunostaining. Blue: nucleus; red: F-actin; green: albumin. Cell constructs in B5-CF displayed the highest protein expression of both CYP3A4 and albumin. Scale bar: 100 μm.
Figure 9
Figure 9
Effect of HepG2 cell culture in 3D BSAMA cryogels and on 2D substrates on liver-specific gene expression at day 14. HepG2 cells were cultured in 3D and 2D culture systems, and their RNA was extracted for the quantitative real-time PCR analysis of AAT, CYP3A7, G6Pase, HNF4α, HNF6, E-cadherin, N-cadherin, ZO-1, claudin-1, CYP3A4, albumin. The data were normalized to the housekeeping gene GAPDH. (n = 3, *: p < 0.05, **: p < 0.01, ***: p < 0.005, ****: p < 0.001, compared to 2D culture. #: p < 0.05, ##: p < 0.01, ###: p < 0.005, ####: p < 0.001, between the samples at the extremities of the line.) AAT: alpha 1-antitrypsin, G6Pase: glucose 6-phosphatase, HNF: hepatocyte nuclear factors, ZO-1: zonula occludens.
Figure 10
Figure 10
Evaluation of FIAU-induced cytotoxicity in B5-CF scaffolds at day 1, day 3, day 5, day 7, and day 14. (A) Experimental timeline for the drug administration. (B) Cell proliferation. (C) Cytotoxicity (LDH release). (D) Albumin expression was assessed at different time points after FIAU treatment (n = 3, *: p < 0.05, **: p < 0.01, ***: p < 0.005, ****: p < 0.001), compared to the same cryogel type at day 1. (E) Evaluation of FIAU-induced human-specific toxicity, mitochondrial disfunction in B5-CF scaffolds. ATP content in cell-laden B5-CF was assessed at the end of 14 days after FIAU treatment. n = 3, ***: p < 0.005, ****: p < 0.001, compared to the group without FIAU treatment. ###: p < 0.005, between the samples at the extremities of the line. The red dashed line indicates the 50% relative cell proliferation.

Similar articles

Cited by

References

    1. Monckton C.P., Brougham-Cook A., Kaylan K.B., Underhill G.H., Khetani S.R. Elucidating Extracellular Matrix and Stiffness Control of Primary Human Hepatocyte Phenotype via Cell Microarrays. Adv. Mater. Interfaces. 2021;8:2101284. doi: 10.1002/admi.202101284. - DOI - PMC - PubMed
    1. Thakkar S., Li T., Liu Z., Wu L., Roberts R., Tong W. Drug-induced liver injury severity and toxicity (DILIst): Binary classification of 1279 drugs by human hepatotoxicity. Drug Discov. Today. 2020;25:201–208. doi: 10.1016/j.drudis.2019.09.022. - DOI - PubMed
    1. Mosedale M., Watkins P.B. Understanding Idiosyncratic Toxicity: Lessons Learned from Drug-Induced Liver Injury. J. Med. Chem. 2020;63:6436–6461. doi: 10.1021/acs.jmedchem.9b01297. - DOI - PubMed
    1. Devarbhavi H. An Update on Drug-induced Liver Injury. J. Clin. Exp. Hepatol. 2012;2:247–259. doi: 10.1016/j.jceh.2012.05.002. - DOI - PMC - PubMed
    1. Jang K.J., Otieno M.A., Ronxhi J., Lim H.K., Ewart L., Kodella K.R., Petropolis D.B., Kulkarni G., Rubins J.E., Conegliano D., et al. Reproducing human and cross-species drug toxicities using a Liver-Chip. Sci. Transl. Med. 2019;11:517. doi: 10.1126/scitranslmed.aax5516. - DOI - PubMed

LinkOut - more resources