

In Vivo Evaluation of Permeable and Impermeable Membranes for Guided Bone Regeneration
- PMID: 35877914
- PMCID: PMC9324035
- DOI: 10.3390/membranes12070711
In Vivo Evaluation of Permeable and Impermeable Membranes for Guided Bone Regeneration
Abstract
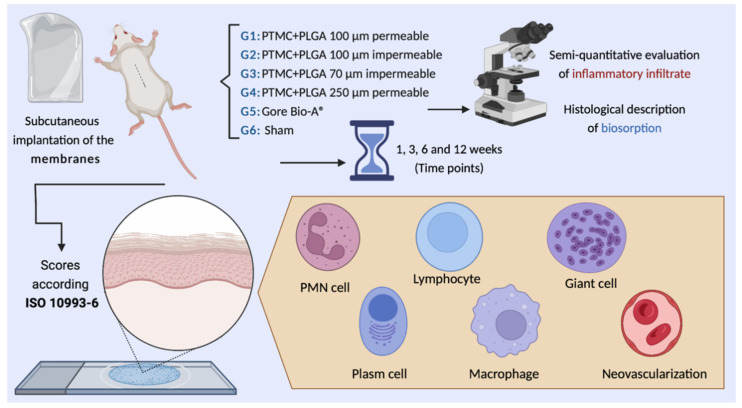
Background: The degree of biodegradation and the inflammatory response of membranes employed for guided bone regeneration directly impact the outcome of this technique. This study aimed to evaluate four different experimental versions of Poly (L-lactate-co-Trimethylene Carbonate) (PTMC) + Poly (L-lactate-co-glycolate) (PLGA) membranes, implanted in mouse subcutaneous tissue, compared to a commercially available membrane and a Sham group.
Methods: Sixty Balb-C mice were randomly divided into six experimental groups and subdivided into 1, 3, 6 and 12 weeks (n = 5 groups/period). The membranes (1 cm2) were implanted in the subcutaneous back tissue of the animals. The samples were obtained for descriptive and semiquantitative histological evaluation (ISO 10993-6).
Results: G1 and G4 allowed tissue adhesion and the permeation of inflammatory cells over time and showed greater phagocytic activity and permeability. G2 and G3 detached from the tissue in one and three weeks; however, in the more extended periods, they presented a rectilinear and homogeneous aspect and were not absorbed. G2 had a major inflammatory reaction. G5 was almost completely absorbed after 12 weeks.
Conclusions: The membranes are considered biocompatible. G5 showed a higher degree of biosorption, followed by G1 and G4. G2 and G3 are considered non-absorbable in the studied periods.
Keywords: PLGA; PTMC; biocompatibility; membranes; mice; subcutaneous.
Conflict of interest statement
Rafael Cury Cecato is a Senior Technical Advisor at FGM Dental Group. The authors declare no conflict of interest.
Figures


Similar articles
-
In Vivo Comparative Evaluation of Biocompatibility and Biodegradation of Bovine and Porcine Collagen Membranes.Membranes (Basel). 2020 Dec 15;10(12):423. doi: 10.3390/membranes10120423. Membranes (Basel). 2020. PMID: 33333940 Free PMC article.
-
In Vivo Biological Evaluation of Biodegradable Nanofibrous Membranes Incorporated with Antibiofilm Compounds.Polymers (Basel). 2021 Jul 26;13(15):2457. doi: 10.3390/polym13152457. Polymers (Basel). 2021. PMID: 34372057 Free PMC article.
-
Comparison of Poly(l-lactide-co-ɛ-caprolactone) and Poly(trimethylene carbonate) Membranes for Urethral Regeneration: An In Vitro and In Vivo Study.Tissue Eng Part A. 2018 Jan;24(1-2):117-127. doi: 10.1089/ten.TEA.2016.0245. Epub 2017 Jul 21. Tissue Eng Part A. 2018. PMID: 28463605
-
In vivo behaviour of a biodegradable poly(trimethylene carbonate) barrier membrane: a histological study in rats.J Mater Sci Mater Med. 2012 Aug;23(8):1951-9. doi: 10.1007/s10856-012-4663-x. Epub 2012 May 9. J Mater Sci Mater Med. 2012. PMID: 22569734 Free PMC article.
-
In Vitro Physico-Chemical Characterization and Standardized In Vivo Evaluation of Biocompatibility of a New Synthetic Membrane for Guided Bone Regeneration.Materials (Basel). 2019 Apr 11;12(7):1186. doi: 10.3390/ma12071186. Materials (Basel). 2019. PMID: 30978950 Free PMC article.
Cited by
-
The influence of electrical high-speed rotation on mandibular third molar surgeries: a prospective, randomized, split-mouth clinical and radiographic study.Sci Rep. 2024 Apr 17;14(1):8828. doi: 10.1038/s41598-024-59611-5. Sci Rep. 2024. PMID: 38632471 Free PMC article. Clinical Trial.
-
Evaluation of toxicity, local biocompatibility, biodegradation, and systemic metabolism of cellulose/alginate/strontium apatite membranes implanted subcutaneously in mice.Acta Cir Bras. 2025 Mar 14;40:e401925. doi: 10.1590/acb401925. eCollection 2025. Acta Cir Bras. 2025. PMID: 40105601 Free PMC article.
References
LinkOut - more resources
Full Text Sources
