. 2022 Sep 8;140(10):1104-1118.
doi: 10.1182/blood.2022015956.

T-cell exhaustion induced by continuous bispecific molecule exposure is ameliorated by treatment-free intervals

Affiliations

T-cell exhaustion induced by continuous bispecific molecule exposure is ameliorated by treatment-free intervals

Nora Philipp et al. Blood. .

Abstract

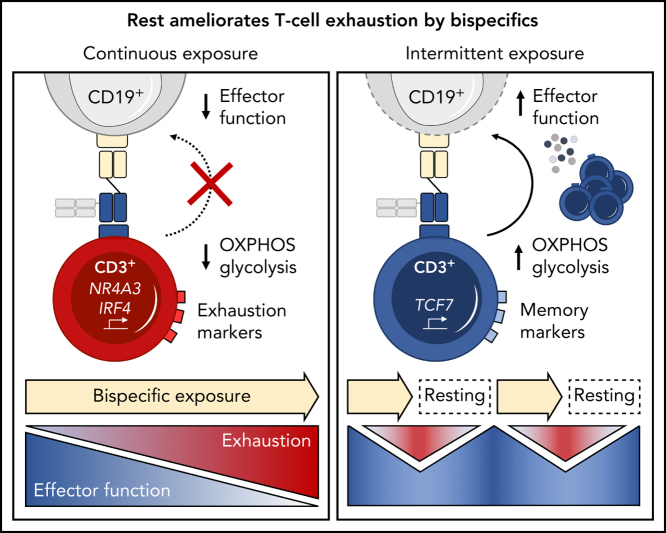
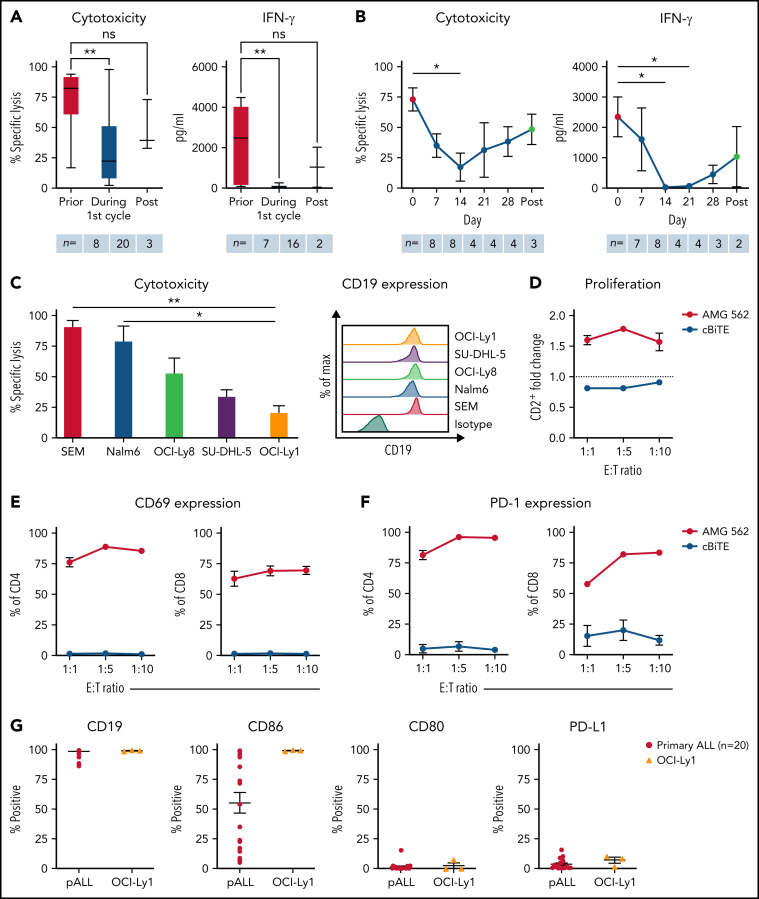
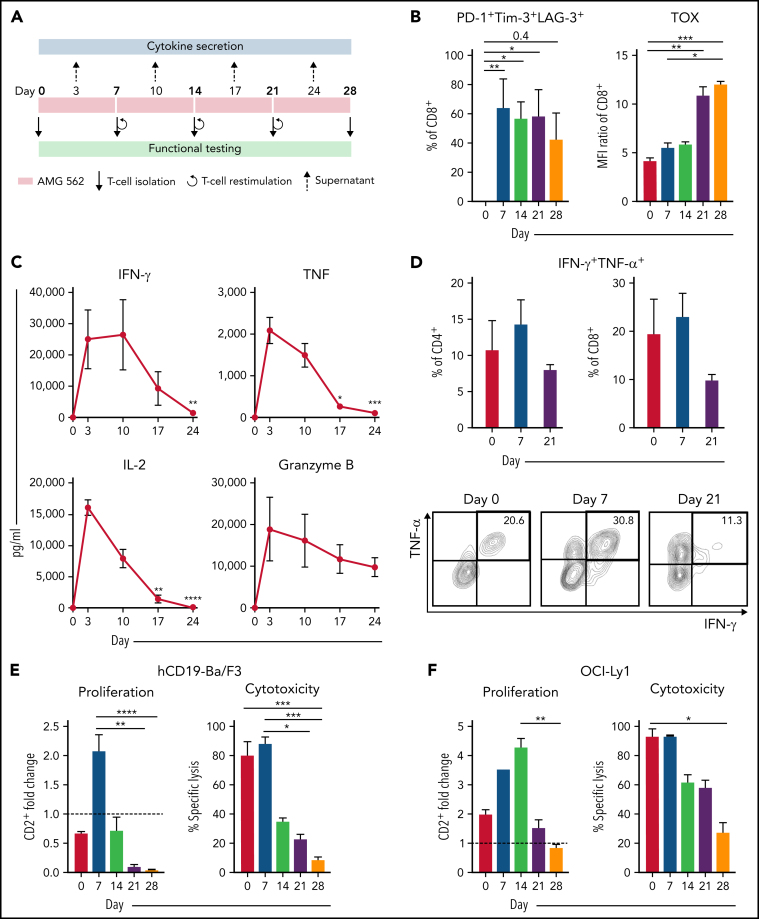
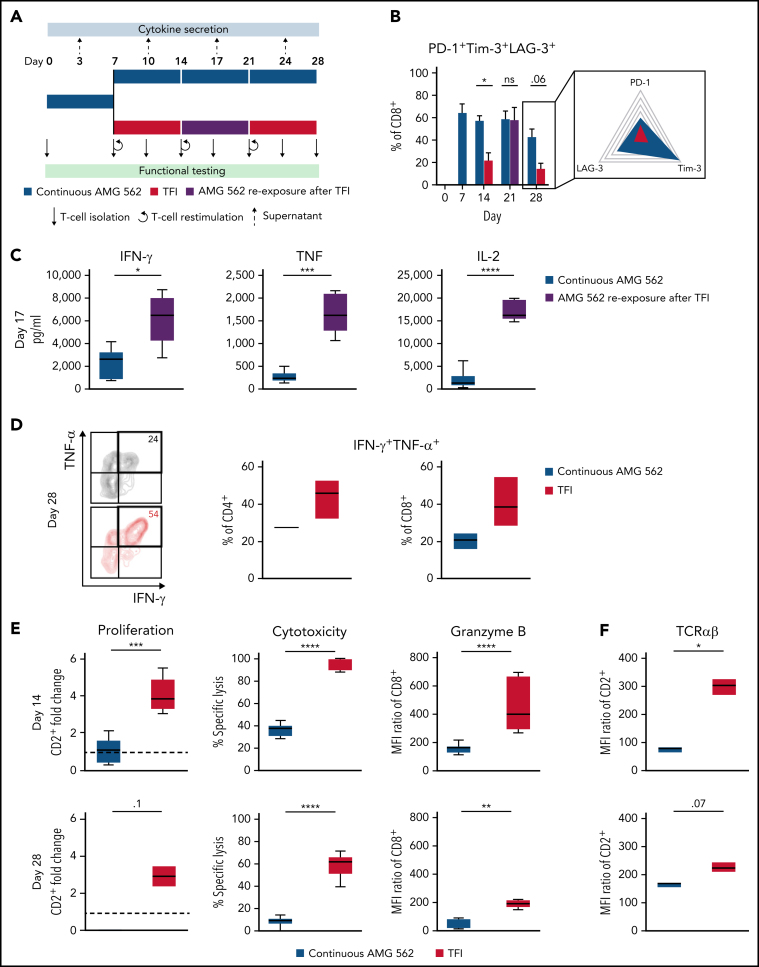
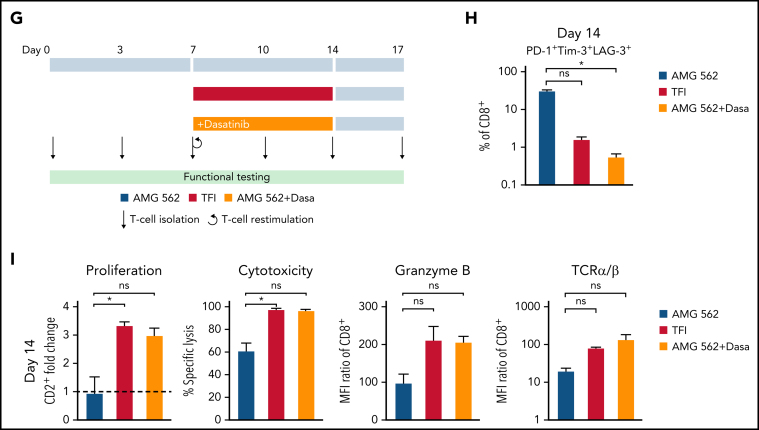
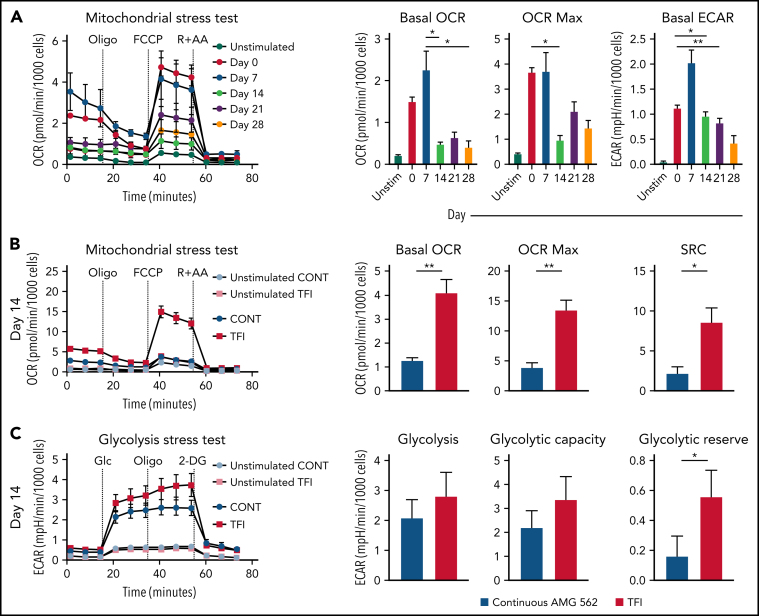
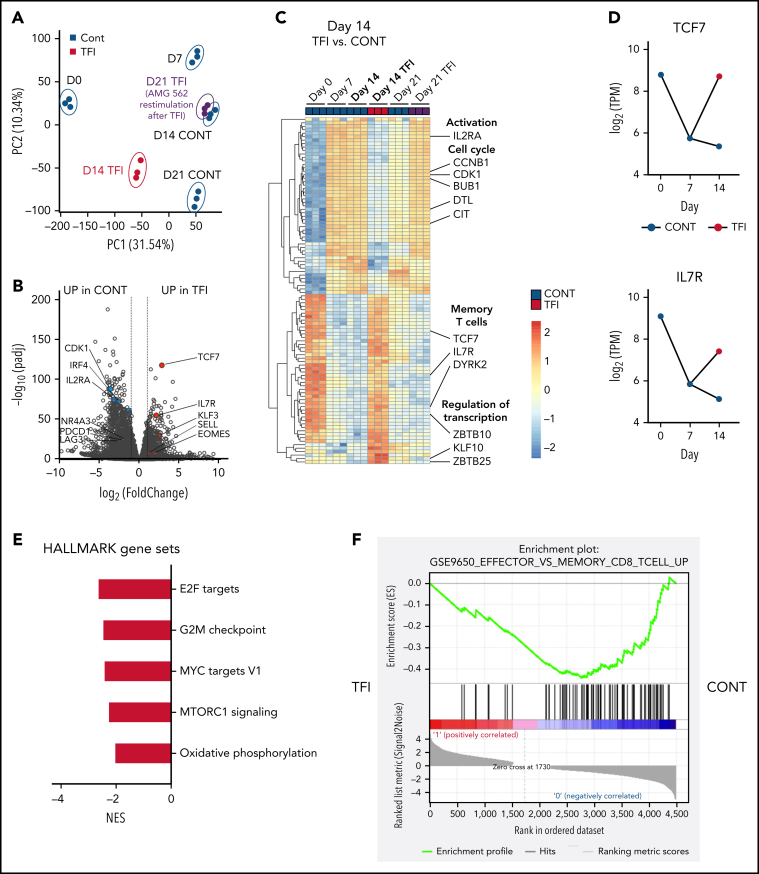
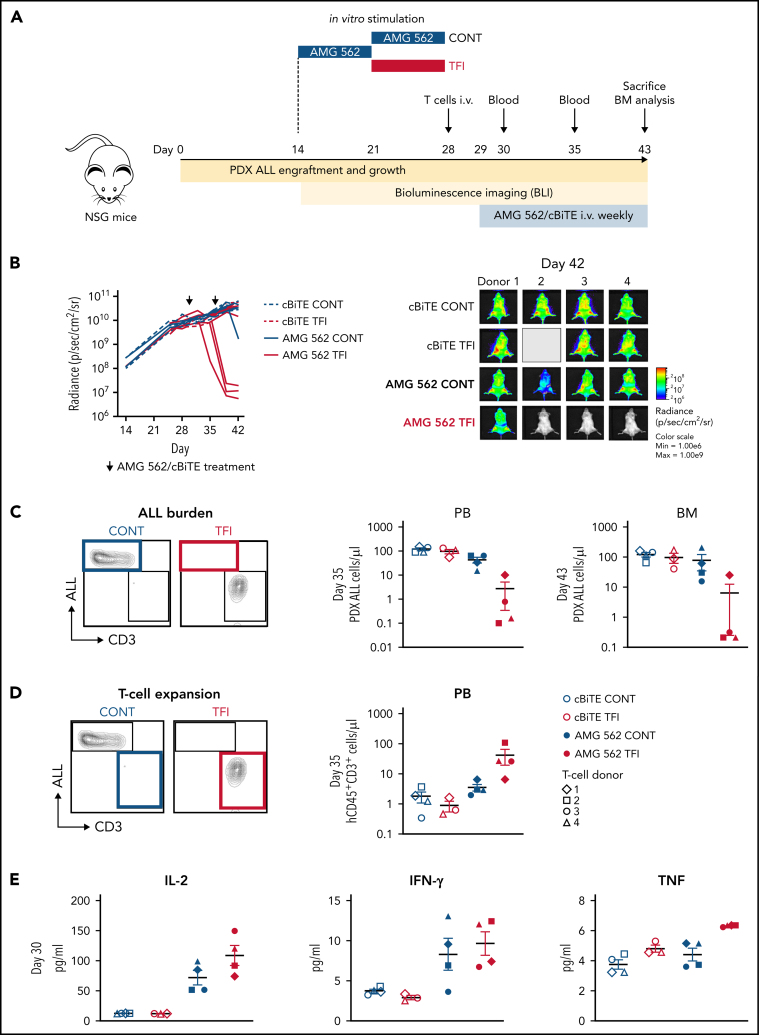
T-cell-recruiting bispecific molecule therapy has yielded promising results in patients with hematologic malignancies; however, resistance and subsequent relapse remains a major challenge. T-cell exhaustion induced by persistent antigen stimulation or tonic receptor signaling has been reported to compromise outcomes of T-cell-based immunotherapies. The impact of continuous exposure to bispecifics on T-cell function, however, remains poorly understood. In relapsed/refractory B-cell precursor acute lymphoblastic leukemia patients, 28-day continuous infusion with the CD19xCD3 bispecific molecule blinatumomab led to declining T-cell function. In an in vitro model system, mimicking 28-day continuous infusion with the half-life-extended CD19xCD3 bispecific AMG 562, we identified hallmark features of exhaustion arising over time. Continuous AMG 562 exposure induced progressive loss of T-cell function (day 7 vs day 28 mean specific lysis: 88.4% vs 8.6%; n = 6; P = .0003). Treatment-free intervals (TFIs), achieved by AMG 562 withdrawal, were identified as a powerful strategy for counteracting exhaustion. TFIs induced strong functional reinvigoration of T cells (continuous vs TFI-specific lysis on day 14: 34.9% vs 93.4%; n = 6; P < .0001) and transcriptional reprogramming. Furthermore, use of a TFI led to improved T-cell expansion and tumor control in vivo. Our data demonstrate the relevance of T-cell exhaustion in bispecific antibody therapy and highlight that T cells can be functionally and transcriptionally rejuvenated with TFIs. In view of the growing number of bispecific molecules being evaluated in clinical trials, our findings emphasize the need to consider and evaluate TFIs in application schedules to improve clinical outcomes.


Conflict of interest statement

Conflict-of-interest disclosure: M. Subklewe has received industry research support from Amgen, Gilead, Miltenyi Biotec, Morphosys, Roche, and Seattle Genetics, and has served as a consultant/advisor to Amgen, BMS, Celgene, Gilead, Pfizer, Novartis, and Roche. She sits on the advisory boards of Amgen, Celgene, Gilead, Janssen, Novartis, Pfizer, and Seattle Genetics, and serves on the speakers' bureau at Amgen, Celgene, Gilead, Janssen, and Pfizer. V.B. has received research funding from Miltenyi Biotec, Novartis, and Pfizer, and has served as a consultant/advisor to Novartis, Amgen, and Gilead. He serves on the speakers' bureau at Novartis and Pfizer. R.K. is employed at Amgen Research Munich, Germany. S.M.L. receives research funding from Roche. M.v.B.-B. has received research support from and serves on the speakers' bureau at Gilead, Miltenyi Biotec, MSD Sharpe & Dohme, Roche, Mologen, Novartis, Astellas, and BMS. K.R. received research funding from Gilead and honoraria from Gilead and Novartis. O.W. has received research funding from Roche. He serves on the speakers' bureau at Janssen and sits on the advisory board of Epizyme. S.T. has served as a consultant/advisor to Amgen, BMS, GSK, Janssen, Pfizer, Sanofi, and Takeda. The remaining authors declare no competing financial interests.

Figures

None
Graphical abstract
Figure 1
Figure 1
T cells of blinatumomab-treated ALL patients show signs of exhaustion ex vivo. (A) Blinatumomab-mediated cytotoxicity (n = 8–20) on day 3 and IFN-γ secretion (n = 7–16) on day 6 of T cells against REH cells (blinatumomab/control BiTE = 0.5 ng/mL, E:T = 1:3). The T cells were isolated from ALL patients prior to (“pre”), during and after the first cycle of blinatumomab therapy. (B) Blinatumomab-mediated cytotoxicity (n = 3–8) on day 3 and IFN-γ secretion (n = 2–8) on day 6 of T cells against REH cells (blinatumomab/control BiTE = 0.5 ng/mL, E:T = 1:3). The T cells were isolated from ALL patients at different timepoints during the first cycle of blinatumomab therapy. (C) AMG 562-mediated cytotoxicity (n = 3–6) and of HD T cells against ALL (SEM, Nalm6) and diffuse large B cell lymphoma (OCI-Ly8, SU-DHL-5, OCI-Ly1) cell lines (supplemental Table 1) after 4 days (AMG 562/control BiTE = 5 ng/mL, E:T = 1:3). Representative histograms of CD19 expression on ALL and diffuse large B cell lymphoma cell lines are shown. (D) CD2+ fold change (n = 3) of HD T cells and (E-F) percentage of CD69+ and PD-1+ among CD4+ and CD8+ T cells after 3 days of cytotoxicity assay (AMG 562/control BiTE = 5 ng/mL) against OCI-Ly1 cells; n = 3. (G) Percentage of CD19+, CD86+, CD80+, and PD-L1+ primary ALL (n = 20) and OCI-Ly1 cells (n = 3). Boxplot whiskers indicate minima and maxima, and boxes represent the lower quartile, the median, and the upper quartile. All other graphs present mean ± SEM values. Statistical analysis: Kruskal–Wallis and Dunn's multiple comparison test (A–C); nsP > .05; *P < .05; **P < .01. ALL, acute lymphoblastic leukemia; cBiTE, control BiTE, bispecific control construct; E:T, effector/target ratio; HD, healthy donor; ns, not significant; pALL, primary ALL; ± SEM, standard error of the mean.
Figure 2
Figure 2
Continuous stimulation with AMG 562 induces T-cell exhaustion. (A) Timeline of continuous T-cell stimulation with AMG 562 and functional testing over 28 days. (B) Percentage of CD8+ T cells coexpressing PD-1, Tim-3, and LAG-3 and the MFI ratio of TOX during continuous AMG 562 stimulation; n = 6. (C) Cytokine and granzyme B levels in coculture supernatants determined by CBA; n = 3–9. Significant differences compared with day 3 are indicated. (D) Percentage of IFN-γ and TNF-α double-positive CD4+ and CD8+ T cells after PMA/ionomycin restimulation. Representative examples of CD8+ T cells from 1 donor are shown; n = 3. (E-F) AMG 562-mediated CD2+ fold change (n = 3) and cytotoxicity against hCD19-Ba/F3 cells (E) or OCI-Ly1 cells (F) after 3 days (AMG 562/cBiTE = 5 ng/mL, E:T = 1:1); n = 6. Data are mean ± SEM values. Statistical analysis: Kruskal–Wallis and Dunn's multiple comparison test (B,C,E,F); *P < .05; **P < .01; *** P < .001; ****P < .0001. CBA, cytometric bead array; E:T, effector/target ratio; LAG-3, lymphocyte activation gene 3; MFI, median fluorescence intensity; PD-1, programmed cell death protein 1; PMA, phorbol myristate acetate;± SEM, standard error of the mean.
Figure 3
Figure 3
TFIs reinvigorate T-cell function. (A) Timeline of continuous vs TFI T-cell stimulation with AMG 562 over 28 days. (B) Percentage of CD8+ T cells coexpressing PD-1, Tim-3, and LAG-3; n = 6. The spider plot (right) indicates coexpression on day 28 in continuously stimulated vs rested T cells from 1 representative donor. (C) Cytokine levels determined by CBA in coculture supernatants on day 17; n = 6. (D) Percentage of IFN-γ and TNF-α double-positive CD4+ and CD8+ T cells after PMA/ionomycin restimulation on day 28 of coculture; n = 3. Representative plots of CD8+ T cells from 1 donor are shown. (E) AMG 562-mediated CD2+ fold change (n = 3), cytotoxic capacity against hCD19-Ba/F3 cells (n = 6) and granzyme B expression (n = 6) of isolated T cells after 14 or 28 days of coculture. (F) TCR expression of T cells (n = 3) quantified by immunophenotyping during coculture. (G) Timeline of AMG 562+dasatinib-mediated T-cell stimulation in comparison with continuous or TFI stimulation over 17 days. Dasatinib = 100 nM. (H) Percentage of CD8+ T cells coexpressing PD-1, Tim-3, and LAG-3; n = 3. (I) T-cell proliferation, cytotoxicity, Granzyme B, and TCR expression; n = 3. Boxplot whiskers indicate minima and maxima, and boxes represent the lower quartile, the median, and the upper quartile. Bar graphs present mean ± SEM values. Statistical analysis: 2-way ANOVA and Sidak's multiple comparison test (B,C,E-F,H–I); nsP > .05; *P < .05; **P < .01; ***P < .001; ****P < .0001. CBA, cytometric bead array; LAG-3, lymphocyte activation gene 3; ns, not significant; PD-1, programmed cell death protein 1; PMA, phorbol myristate acetate; ± SEM, standard error of the mean; TCR, T-cell receptor; TFI(s), treatment-free interval(s).
Figure 3
Figure 3
TFIs reinvigorate T-cell function. (A) Timeline of continuous vs TFI T-cell stimulation with AMG 562 over 28 days. (B) Percentage of CD8+ T cells coexpressing PD-1, Tim-3, and LAG-3; n = 6. The spider plot (right) indicates coexpression on day 28 in continuously stimulated vs rested T cells from 1 representative donor. (C) Cytokine levels determined by CBA in coculture supernatants on day 17; n = 6. (D) Percentage of IFN-γ and TNF-α double-positive CD4+ and CD8+ T cells after PMA/ionomycin restimulation on day 28 of coculture; n = 3. Representative plots of CD8+ T cells from 1 donor are shown. (E) AMG 562-mediated CD2+ fold change (n = 3), cytotoxic capacity against hCD19-Ba/F3 cells (n = 6) and granzyme B expression (n = 6) of isolated T cells after 14 or 28 days of coculture. (F) TCR expression of T cells (n = 3) quantified by immunophenotyping during coculture. (G) Timeline of AMG 562+dasatinib-mediated T-cell stimulation in comparison with continuous or TFI stimulation over 17 days. Dasatinib = 100 nM. (H) Percentage of CD8+ T cells coexpressing PD-1, Tim-3, and LAG-3; n = 3. (I) T-cell proliferation, cytotoxicity, Granzyme B, and TCR expression; n = 3. Boxplot whiskers indicate minima and maxima, and boxes represent the lower quartile, the median, and the upper quartile. Bar graphs present mean ± SEM values. Statistical analysis: 2-way ANOVA and Sidak's multiple comparison test (B,C,E-F,H–I); nsP > .05; *P < .05; **P < .01; ***P < .001; ****P < .0001. CBA, cytometric bead array; LAG-3, lymphocyte activation gene 3; ns, not significant; PD-1, programmed cell death protein 1; PMA, phorbol myristate acetate; ± SEM, standard error of the mean; TCR, T-cell receptor; TFI(s), treatment-free interval(s).
Figure 4
Figure 4
TFIs maintain high T-cell metabolic fitness. (A) Kinetic plot and corresponding bar graphs of normalized OCR obtained during mitochondrial stress test of T cells continuously stimulated with AMG 562; n = 3. (B) Kinetic plot and corresponding bar graphs of normalized OCR obtained during mitochondrial stress test of T cells after 14 days of continuous vs TFI AMG 562 stimulation; n = 5. (C) Kinetic plot and corresponding bar graphs of normalized ECAR obtained during glycolysis stress test of T cells after 14 days of continuous vs TFI AMG 562 stimulation; n = 5. All graphs present mean ± SEM values. Statistical analysis: Kruskal–Wallis and Dunn's multiple comparison test (A); 2-way ANOVA and Sidak's multiple comparison test (B-C); *P < .05; **P < .01. ECAR, extracellular acidification rate; OCR, oxygen consumption rate; ±SEM, standard error of the mean; TFI(s), treatment-free interval(s).
Figure 5
Figure 5
T cells are transcriptionally reprogrammed during TFIs. (A) Principal component analysis. (B) Volcano plot of day 14 TFI vs CONT T cells; Padj < .05. Selected genes are highlighted as significantly downregulated (blue) or significantly upregulated (red) in TFI vs CONT cells. (C) Heatmap with hierarchical clustering of the top 100 differentially expressed genes in day-14 TFI vs CONT T cells; Padj < .05. Selected genes are highlighted. (D) Log2(TPM) expression level of TCF7 and IL7R across timepoints 0, 7, and 14 days in TFI vs CONT T cells. (E) Pathways enriched in day-14 TFI vs CONT T cells; Padj < .05. (F) Gene set enrichment analysis of day-14 TFI vs CONT T cells using MSigDB and the gene set GSE9650_EFFECTOR_VS_MEMORY_CD8_TCELL_UP. Line plots present mean ± SEM values. CONT, continuously; NES, normalized enrichment score; ±SEM, standard error of the mean; TFI(s), treatment-free interval(s).
Figure 6
Figure 6
TFIs improve AMG 562-mediated control of ALL in vivo. (A) Timeline of in vivo experiment: PDX-ALL cells were transplanted into NSG mice. T cells (4 donors) were stimulated in vitro for 14 days continuously or with TFI cells (days 7-14) and subsequently injected into NSG mice 28 days post engraftment. Mice were treated with AMG 562/control BiTE = 5 ng/mL on days 1 and 8 post T-cell injection. T-cell function and ALL burden was analyzed via bioluminescence imaging and flow cytometry. (B) Quantification of bioluminescence imaging signals (left panel) and images of mice on day 42 after engraftment (right panel). See supplemental Figure 7B for images of all timepoints. (C) Flow cytometry analysis of PDX-ALL cells detected in PB on day 35 and in BM on day 43. Representative plots from 1 T-cell donor are shown. (D) CD3+ T-cell expansion in PB on day 35. Representative plots from 1 T-cell donor are shown. (E) Human cytokine levels detected in murine plasma on day 30. All graphs present mean ± SEM values. BM, bone marrow; cBiTE, control BiTE, bispecific control construct; CONT, continuously; PB, peripheral blood; PDX-ALL, patient-derived xenograft acute lymphoblastic leukemia; NSG, NOD.Cg-Prkdcscid IL2rgtm1Wjl/SzJ; ±SEM, standard error of the mean; TFI(s), treatment-free interval(s).

Comment in

  • Bispecifics need a mindful pause.
    Toffalori C, Vago L. Toffalori C, et al. Blood. 2022 Sep 8;140(10):1056-1058. doi: 10.1182/blood.2022017726. Blood. 2022. PMID: 36074532 No abstract available.

References

    1. Labrijn AF, Janmaat ML, Reichert JM, Parren PWHI. Bispecific antibodies: a mechanistic review of the pipeline. Nat Rev Drug Discov. 2019;18(8):585–608. - PubMed
    1. Hutchings M, Morschhauser F, Iacoboni G, et al. Glofitamab, a novel, bivalent CD20-targeting T-cell-engaging bispecific antibody, induces durable complete remissions in relapsed or refractory B-cell lymphoma: a phase I trial. J Clin Oncol. 2021;39(18):1959–1970. - PMC - PubMed
    1. Bröske AE, Korfi K, Belousov A, et al. Pharmacodynamics and molecular correlates of response to glofitamab in relapsed/refractory non-Hodgkin lymphoma. Blood Adv. 2022;6(3):1025–1037. - PMC - PubMed
    1. Assouline SE, Kim WS, Sehn LH, et al. Mosunetuzumab shows promising efficacy in patients with multiply relapsed follicular lymphoma: updated clinical experience from a phase I dose-escalation trial. Blood. 2020;136(suppl 1):42–44.
    1. Uy GL, Aldoss I, Foster MC, et al. Flotetuzumab as salvage immunotherapy for refractory acute myeloid leukemia. Blood. 2021;137(6):751–762. - PMC - PubMed

Publication types

MeSH terms