. 2022 Aug 2;119(31):e2200727119.
doi: 10.1073/pnas.2200727119. Epub 2022 Jul 25.

Molecular determinants of pH sensing in the proton-activated chloride channel

Affiliations

Molecular determinants of pH sensing in the proton-activated chloride channel

James Osei-Owusu et al. Proc Natl Acad Sci U S A. .

Abstract

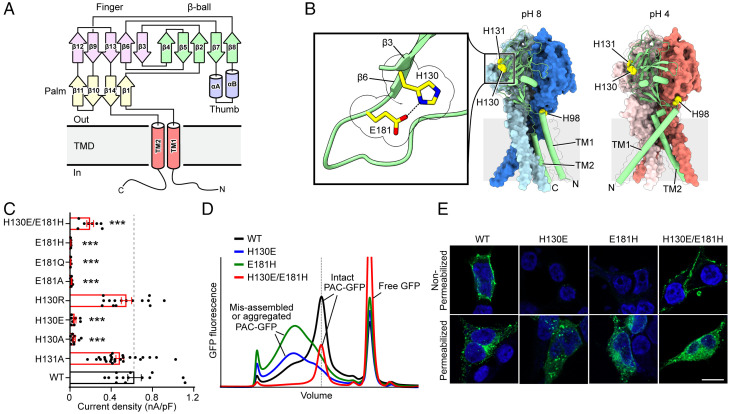
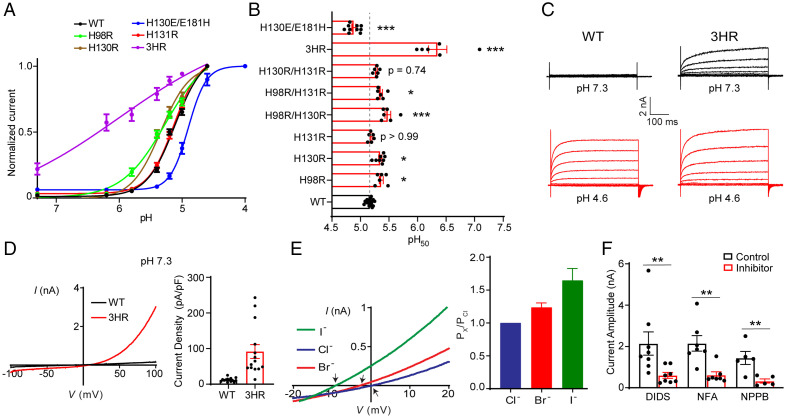
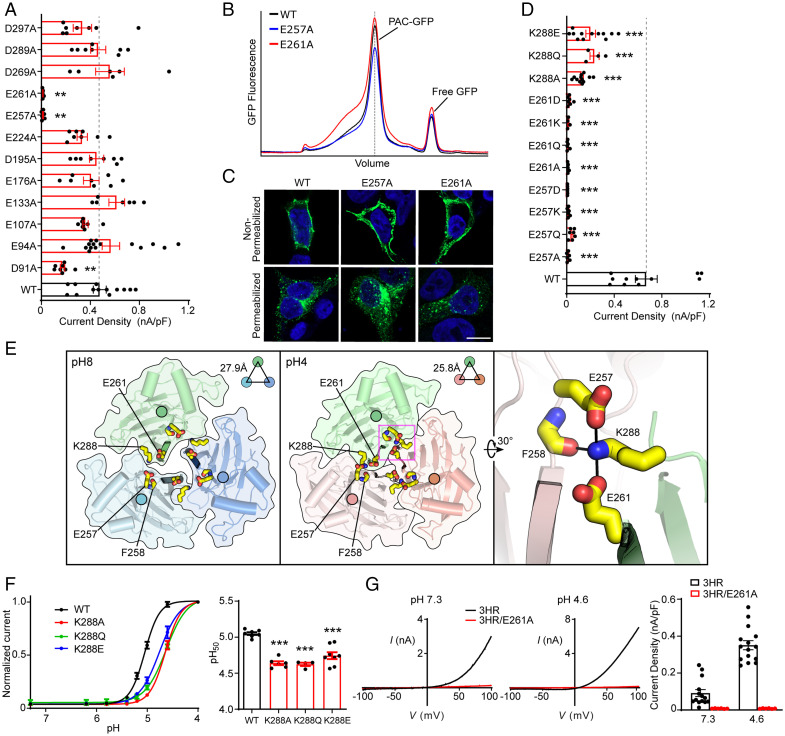
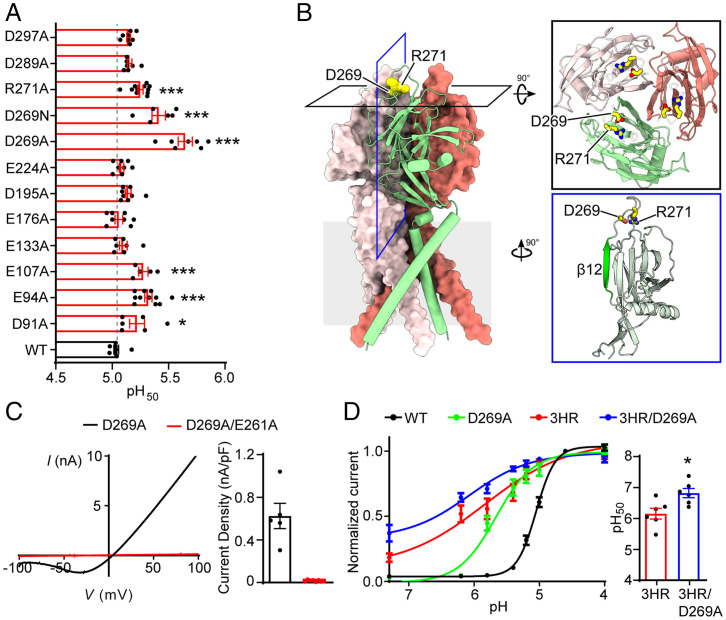
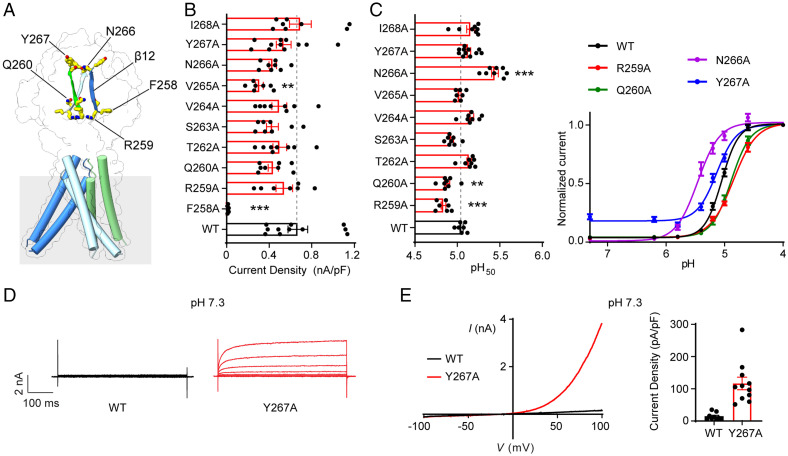
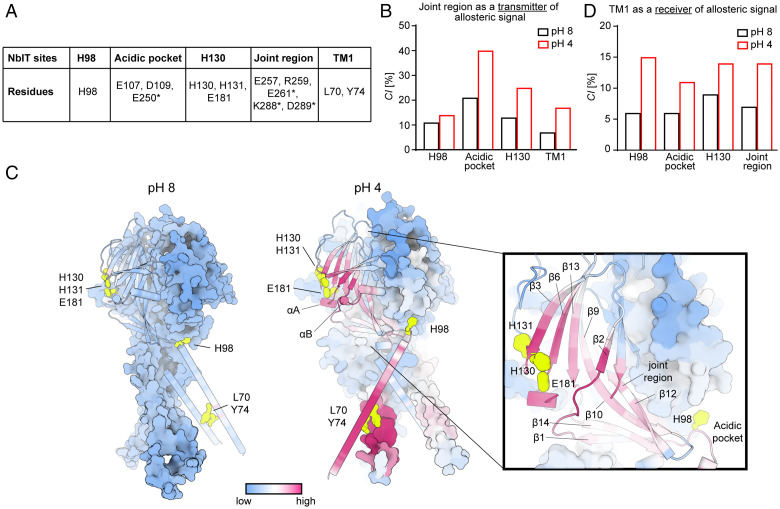
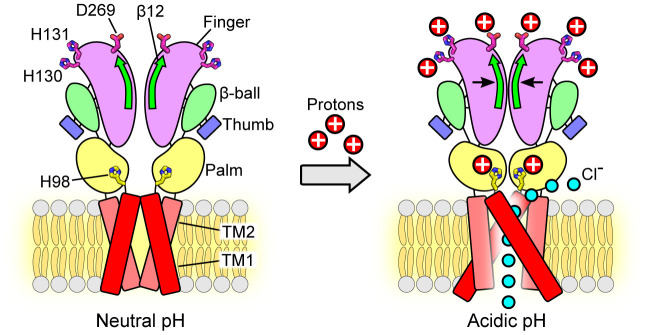
In response to acidic pH, the widely expressed proton-activated chloride (PAC) channel opens and conducts anions across cellular membranes. By doing so, PAC plays an important role in both cellular physiology (endosome acidification) and diseases associated with tissue acidosis (acid-induced cell death). Despite the available structural information, how proton binding in the extracellular domain (ECD) leads to PAC channel opening remains largely unknown. Here, through comprehensive mutagenesis and electrophysiological studies, we identified several critical titratable residues, including two histidine residues (H130 and H131) and an aspartic acid residue (D269) at the distal end of the ECD, together with the previously characterized H98 at the transmembrane domain-ECD interface, as potential pH sensors for human PAC. Mutations of these residues resulted in significant changes in pH sensitivity. Some combined mutants also exhibited large basal PAC channel activities at neutral pH. By combining molecular dynamics simulations with structural and functional analysis, we further found that the β12 strand at the intersubunit interface and the associated "joint region" connecting the upper and lower ECDs allosterically regulate the proton-dependent PAC activation. Our studies suggest a distinct pH-sensing and gating mechanism of this new family of ion channels sensitive to acidic environment.

Keywords: PAC; TMEM206; allosteric regulation; pH sensitivity; proton-activated chloride channel.


Conflict of interest statement

The authors declare no competing interest.

Figures

Fig. 1.
Fig. 1.
H130–E181 interaction is essential for PAC channel formation and function. (A) Domain organization of PAC. Secondary structure elements that constitute the palm, finger, thumb, and β-ball domains are grouped and labeled (15). (B) Cryo-EM structures of the trimeric structure of pH 8–PAC and pH 4–PAC viewed parallel to the membrane (Protein Data Bank ID: 7JNA and 7JNC) (15). The green subunit is shown as a cartoon and the other two subunits are shown in surface representation. H98 in the ECD-TM1 interface, and H130, E181, and H131 in the extracellular domain are highlighted (yellow). Insert: Close-up view of the side-chain interaction between H130 and E181 on the β3 and β6 strands, respectively (highlighted in yellow and shown in stick representation). (C) Current densities of wild-type PAC and mutants of H130 and E181. Data are the mean ± SEM of the pH 4.6–induced currents at +100 mV. ***P < 0.001, one-way ANOVA with Bonferroni post hoc test. (D) The FSEC profile of GFP-tagged wild-type PAC (black) and mutants of H130E (blue), E181H (green), and H130E/E181H (red) solubilized using glyco-diosgenin detergent. The expected position of intact GFP-tagged PAC protein is indicated in a dotted vertical line. The peak positions of both H130E and E181H single mutants, but not the double mutant H130E/E181H, are broader and shifted compared to the wild-type, suggesting that single mutants H130E and E181H interfere with the proper assembly of PAC. A Superose 6 Increase 10/300 GL column was used. (E) Cell surface immunostaining of HEK293T PAC KO transiently transfected with wild-type PAC-FLAG277 (FLAG tag at position 277), H130E, E181H, or H130E/E181H cDNA constructs. The cells were either permeabilized to allow intracellular access to FLAG antibody (Permeabilized) or live-labeled to enhance only plasma membrane staining of PAC-FLAG277(Non-Permeabilized). (Scale bar, 10 µm.)
Fig. 2.
Fig. 2.
H98, H130, and H131 are key determinants of PAC pH sensing. (A) pH dose-response curve of wild-type PAC, H98R, H130R, H131R, H130E/E181H, and H98R/H130R/H131R (3HR). The currents are normalized to the pH 4.6– or 4.0–induced currents [n = 14 (wild-type PAC); n = 6 (H98R); n = 8 (H130R); n = 6 (H131R); n = 10 (H130E/E181H); n = 6 (3HR)]. The normalized data are fitted to the Hill equation unconstrained, allowing both the top and bottom to be defined by the maximum and minimum normalized currents. Data are the mean ± SEM of the normalized currents at +100 mV. (B) pH50 values estimated from the pH dose-response curves in (A). *P < 0.05; ***P < 0.001, one-way ANOVA with Bonferroni post hoc test. (C) Representative whole-cell currents of wild-type PAC (Left) and 3HR mutant (Right) at pH 7.3 (black) and 4.6 (red) monitored by voltage-step protocol. (D) Left: Representative whole-cell currents of wild-type PAC (black trace) and 3HR mutant (red trace) at pH 7.3 monitored by voltage-ramp protocol. Right: Current densities (mean ± SEM) of wild-type PAC and 3HR mutant at pH 7.3 and +100 mV. (E) Left: Representative I to V relationship of 3HR mutant recorded in extracellular equimolar I (green trace), Br (red trace), or Cl (blue trace) pH 7.3 solution. Arrows indicate the reversal potentials. Right: Anion permeability ratio of 3HR mutant (n = 7 cells). Data represent mean ± SEM. (F) Quantification of the inhibition of the 3HR basal currents at neutral pH by three PAC inhibitors: 100 µM 4,4′-diisothiocyanatostilbene-2,2′-disulfonate (DIDS), 100 µM niflumic acid (NFA), and 100 µM 5-nitro-2-(3-phenylpropylamino)-benzoic acid (NPPB). Current amplitudes (mean ± SEM) at +100 mV (control) before inhibitors were applied. **P < 0.01; two-tailed Student’s t test.
Fig. 3.
Fig. 3.
The joint region is an essential allosteric transducer for pH-dependent PAC activation. (A) Current densities of wild-type and mutant PAC in the ECD acidic residue screen. Data are the mean ± SEM of pH 4.6–induced currents at +100 mV. **P < 0.01; one-way ANOVA with Bonferroni post hoc test. (B) The FSEC profile of GFP-tagged wild-type PAC (black), E257A (blue), and E261A (red) solubilized using glyco-diosgenin detergent. The expected position of intact GFP-tagged PAC protein is indicated in a dotted vertical line. (C) Cell surface immunostaining of HEK293T PAC KO transiently transfected with wild-type PAC-FLAG277 (the same representative image as in Fig. 1E), E257A, or E261A cDNA constructs. (Scale bar, 10 µm.) (D) Current densities of wild-type PAC and various mutations on E257, E261, and K288 residues. Data are the mean ± SEM of the pH 4.6–induced currents at +100 mV. ***P < 0.001, one-way ANOVA with Bonferroni post hoc test. (E) Top view of the pH 8–PAC (Left) and pH 4–PAC (Middle) structures depicting the pH-dependent conformational change of the intersubunit interface. E257, F258, E261, and K288 are highlighted in yellow sticks. A close-up view of the intersubunit interactions involving E257, F258, E261, and K288 in the pH 4 state is shown on the Right. (F) Left: pH dose-response curve of wild-type PAC, K288A, K288Q, and K288E. The currents are normalized to the pH 4.0–induced currents [n = 7 (wild-type PAC); n = 6 (K288A); n = 4 (K288Q); n = 8 (K288E)]. The normalized data are fitted to the Hill equation unconstrained. Data are the mean ± SEM of the normalized currents at +100 mV. Right: pH50 values (mean ± SEM) estimated from the pH dose-response curves. ***P < 0.001, one-way ANOVA with Bonferroni post hoc test. (G) Left two panels: Representative whole-cell currents of 3HR (black trace) and 3HR/E261A (red trace) mutants induced by extracellular pH 7.3 (Left) and 4.6 (Middle) solutions, monitored by voltage-ramp protocols. Right: Current densities (mean ± SEM) at +100 mV shown on the Left.
Fig. 4.
Fig. 4.
Screening of acidic residues in the ECD identifies D269 as another regulator of PAC pH sensitivity. (A) pH50 values (mean ± SEM) of wild-type PAC and mutants. *P < 0.05; ***P < 0.001, one-way ANOVA with Bonferroni post hoc test. (B) Cryo-EM structure models of pH 4–PAC structure viewed parallel to the membrane (Protein Data Bank ID: 7JNC). The green subunit is shown as a cartoon and the other two subunits are shown in surface representation. D269 and R271 are highlighted as yellow spheres. Inserts: Top view (black frame) and side view (blue frame) highlighting D269 and R271. The β12 strand is highlighted in green in the side view. (C) Left: Representative whole-cell currents of D269A (black) and D269A/E261A (red) mutants at pH 4.6, and monitored by voltage-ramp protocol. Right: pH 4.6–induced current densities (mean ± SEM) of D269A and D269A/E261A mutants at +100 mV. (D) Left: The pH dose-response curve of wild-type PAC (black), D269A (green), 3HR (red), and 3HR/D269A (blue). The currents are normalized to the pH 4.0–induced currents [n = 7 (wild-type PAC); n = 7 (D269A); n = 6 (3HR); n = 6 (3HR/D269A)]. The normalized data are fitted to the Hill equation unconstrained. Data are the mean ± SEM of the normalized currents at +100 mV. Right: pH50 values (mean ± SEM) of 3HR and 3HR/D269A mutants estimated from the pH dose-response curve in (D). *P < 0.05, two-tailed Student’s t test.
Fig. 5.
Fig. 5.
The lower and upper parts of the β12 strand differentially regulate PAC channel activity. (A) The Cryo-EM structure of pH 8–PAC structure highlighting residues of the β12 strand, F258, R259, Q260, N266, and Y267. (B) pH 4.6–induced current densities (mean ± SEM) at +100 mV of wild-type PAC and alanine scanning mutants of the β12 strand. **P < 0.01; ***P < 0.001, one-way ANOVA with Bonferroni post hoc test. (C) Left: pH50 values (mean ± SEM) of wild-type PAC and β12 strand mutants estimated from their respective pH dose-response curves. Right: pH dose-response curve of wild-type PAC, R259A, Q260A, N266A, and Y267A. The currents are normalized to the pH 4.0–induced currents. The normalized data are fitted to the Hill equation unconstrained. Data are the mean ± SEM of the normalized currents at +100 mV. **P < 0.01; ***P < 0.001, one-way ANOVA with Bonferroni post hoc test. (D) Representative whole-cell currents of wild-type PAC (Left) and Y267A (Right) at pH 7.3 monitored by voltage-step protocol. (E) Left: Representative whole-cell currents of wild-type PAC (black trace) and Y267A (red trace) at pH 7.3 monitored by voltage-ramp protocol. Right: Current densities (mean ± SEM) of wild-type PAC and Y267A mutant at +100 mV induced by extracellular pH 7.3 or 4.6 solution.
Fig. 6.
Fig. 6.
MD simulations and NbIT analysis reveal pH-dependent allosteric communication in PAC. (A) Definition of NbIT sites. Asterisks indicate residues from a neighboring PAC subunit. (B) CI values for the joint region (transmitter) coordination of other NbIT sites averaged over three subunits of PAC at pH 8 and 4. (C) The allosteric coordination channel between the H130/H131/E181 region and TM1 of PAC from NbIT analysis of ECpH-MD trajectories simulated at pH 8 (Left) and 4 (Right). Per-residue MCI values are represented on the structure with a uniform colormap ranging from low to high. (D) CI values for TM1 (receiver) coordination by other NbIT sites averaged over three subunits of PAC at pH 8 and 4.
Fig. 7.
Fig. 7.
Schematic representation of the conformational changes during pH-dependent activation and allosteric gating of the PAC channel. Representative cartoon of PAC, depicting a dimer of the homotrimeric subunit, in the closed and open states. Each subunit is composed of two TMDs, N and C termini, and a large ECD. In the closed state, TM1 and TM2 run parallel and interact with each other. At pH 4, TM1 swings and interacts with TM2 of the adjacent subunit. The ECD contracts toward the pore axis, resulting in a shorter overall structure and a more compact ECD in comparison to that at pH 8. The joint region is at the intersubunit interface and connects the upper finger domain to the lower palm domain. The potential proton-binding sites (H130, H131, D269) are located at the top of the ECD, distal to the ion-conducting pore and channel gate. Protonation of these sites allosterically affects the state of channel gate leading to the PAC channel activation. The β12 strand and the joint region allosterically transduce the pH-dependent conformational changes from the peripheral proton-binding sites to the channel pore. Therefore, combining the available structural information, we propose a model in which protonation of residues in the extracellular finger domain induces the contraction of the ECD, which, together with the conformational change of H98 in the ECD–TMD interface, leads to the opening of the ion-conducting pore. The permeation of Cl ions through the fenestration site is illustrated (15).

Similar articles

Cited by

References

    1. Capurro V., et al. , Functional analysis of acid-activated Cl channels: Properties and mechanisms of regulation. Biochim. Biophys. Acta 1848, 105–114 (2015). - PubMed
    1. Auzanneau C., Thoreau V., Kitzis A., Becq F., A novel voltage-dependent chloride current activated by extracellular acidic pH in cultured rat Sertoli cells. J. Biol. Chem. 278, 19230–19236 (2003). - PubMed
    1. Lambert S., Oberwinkler J., Characterization of a proton-activated, outwardly rectifying anion channel. J. Physiol. 567, 191–213 (2005). - PMC - PubMed
    1. Sato-Numata K., Numata T., Okada T., Okada Y., Acid-sensitive outwardly rectifying (ASOR) anion channels in human epithelial cells are highly sensitive to temperature and independent of ClC-3. Pflugers Arch. 465, 1535–1543 (2013). - PubMed
    1. Ma Z. Y., et al. , A proton-activated, outwardly rectifying chloride channel in human umbilical vein endothelial cells. Biochem. Biophys. Res. Commun. 371, 437–440 (2008). - PubMed

Publication types

LinkOut - more resources