. 2022 Jul;48(3):203-221.
doi: 10.1037/xan0000330.

The role of prediction in learned predictiveness

Affiliations

The role of prediction in learned predictiveness

Carla J Eatherington et al. J Exp Psychol Anim Learn Cogn. 2022 Jul.

Abstract

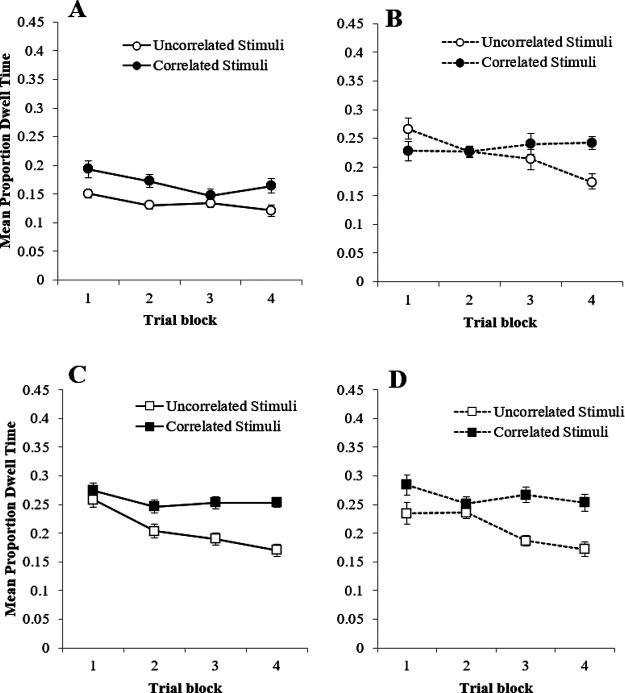
Learning permits even relatively uninteresting stimuli to capture attention if they are established as predictors of important outcomes. Associative theories explain this "learned predictiveness" effect by positing that attention is a function of the relative strength of the association between stimuli and outcomes. In three experiments we show that this explanation is incomplete: learned overt visual-attention is not a function of the relative strength of the association between stimuli and an outcome. In three experiments, human participants were exposed to triplets of stimuli that comprised (a) a target (that defined correct responding), (b) a stimulus that was perfectly correlated with the presentation of the target, and (c) a stimulus that was uncorrelated with the presentation of the target. Participants' knowledge of the associative relationship between the correlated or uncorrelated stimuli and the target was always good. However, eye-tracking revealed that an attentional bias toward the correlated stimulus only developed when it and target-relevant responding preceded the target stimulus. We propose a framework in which attentional changes are modulated during learning as a function the relative strength of the association between stimuli and the task-relevant response, rather than an association between stimuli and the task-relevant outcome. (PsycInfo Database Record (c) 2022 APA, all rights reserved).


Figures

Figure 1
Figure 1. Results of Experiment 1
Note. (A) Mean proportion correct responses during the training trials; (B) mean response times during the training trials; (C) mean proportion dwell times to the correlated, uncorrelated, and target stimuli during training trials; (D) mean proportion dwell times to the correlated and uncorrelated stimuli during the test trials; and (E) mean difference scores to the correlated and uncorrelated stimuli during the final test questionnaire. Error bars represent 1 ± SEM.
Figure 2
Figure 2. Results of Experiment 2
Note. (A) Mean proportion dwell times to the Correlated, Uncorrelated, and Target stimuli during the training trials in group Simultaneous; (B) mean proportion dwell times to the Correlated and Uncorrelated stimuli during the training trials in group Serial-Stimuli; (C) mean proportion dwell times to the Correlated and Uncorrelated stimuli during the training trials in group Serial-Target; (D) mean response times during the training trials in groups Serial-Target, Serial-Stimuli, and Simultaneous; (E) mean proportion dwell times to the Correlated and Uncorrelated stimuli during the probe trials in each group; and (F) mean difference scores to the Correlated and Uncorrelated stimuli during the final test questionnaire. Error bars represent 1 ± SEM.
Figure 3
Figure 3. Results of Experiment 3
Note. Mean proportions of dwell times to the correlated and uncorrelated stimuli during the training trials of Stage 1 of Experiment 3 in groups (A) Simultaneous Congruent, (B) Simultaneous Incongruent, (C) Serial Congruent, and (D) Serial Incongruent. In each panel, the correlated or uncorrelated status refers to the relationship between the stimuli and the target during Stage 1. Error bars represent 1 ± SEM.
Figure 4
Figure 4. Results of Experiment 3
Note. Panels A and B: Mean proportion correct responses during Stage 2 of Experiment 3—(A) groups Simultaneous Congruent and Incongruent, (B) groups Serial Congruent and Incongruent. Panels C and D: Mean response times during Stage 2 of Experiment 3—(C) groups Simultaneous Congruent and Incongruent, (D) groups serial Congruent and Incongruent. Error bars represent 1 ± SEM.
Figure 5
Figure 5. Results of Experiment 3
Note. Mean proportion dwell times to the correlated and uncorrelated stimuli during Stage 2 of Experiment 3. (A) group Simultaneous Congruent (B), group Simultaneous Incongruent (C), group Serial Congruent, and (D) group Serial Incongruent. In each panel, the correlated or uncorrelated status refers to the relationship between the stimuli and the target during Stage 2. Error bars represent 1 ± SEM.
Figure 6
Figure 6. Results of Experiment 3
Note. Mean proportion dwell times to the correlated and uncorrelated stimuli during probe trials in groups Simultaneous Congruent and Simultaneous Incongruent (A) and groups Serial Congruent and Serial Incongruent (B). Mean difference scores to the correlated and uncorrelated stimuli from the final questionnaire in groups Simultaneous Congruent and Simultaneous Incongruent (C) and groups Serial Congruent and Serial Incongruent (D). Error bars represent 1 ± SEM.
Figure 7
Figure 7. A Time Line Depicting the Relative Presentation Times of the Correlated and Uncorrelated Stimuli (Grey Rectangles) Participant’s Response (White Rectangle) and the Target (Black Rectangle) During a Trial in Groups Serial-Stimuli, Simultaneous, and Serial-Target Of Experiment 2
Figure 8
Figure 8. A Time Line Depicting the Relative Presentation Times of the Correlated and Uncorrelated Stimuli (Grey Rectangles) Participants Response (White Rectangle) and the Target (Black Rectangle) During a Trial in Groups Serial-Stimuli, Simultaneous, and Serial-Target of Experiment 2
Note. Dotted rectangles represent six theoretical windows of associability.

Similar articles

References

    1. Alamia A., & Zénon A. (2016). Statistical regularities attract attention when task-relevant. Frontiers in Human Neuroscience, 10, 42. 10.3389/fnhum.2016.00042 - DOI - PMC - PubMed
    1. Allport A. (1989). Visual attention. In Posner M. I. (Ed.), Foundations of cognitive science (pp. 631–682). MIT Press.
    1. Anderson B. A. (2016). The attention habit: How reward learning shapes attentional selection. Annals of the New York Academy of Sciences, 1369(1), 24–39. 10.1111/nyas.12957 - DOI - PubMed
    1. Anderson B. A., Laurent P. A., & Yantis S. (2011a). Learned value magnifies salience-based attentional capture. PLoS ONE, 6(11), e27926. 10.1371/journal.pone.0027926 - DOI - PMC - PubMed
    1. Anderson B. A., Laurent P. A., & Yantis S. (2011b). Value-driven attentional capture. Proceedings of the National Academy of Sciences of the United States of America, 108(25), 10367–10371. 10.1073/pnas.1104047108 - DOI - PMC - PubMed