

Natural and Induced Tolerance to Hymenoptera Venom: A Single Mechanism?
- PMID: 35878164
- PMCID: PMC9320229
- DOI: 10.3390/toxins14070426
Natural and Induced Tolerance to Hymenoptera Venom: A Single Mechanism?
Abstract
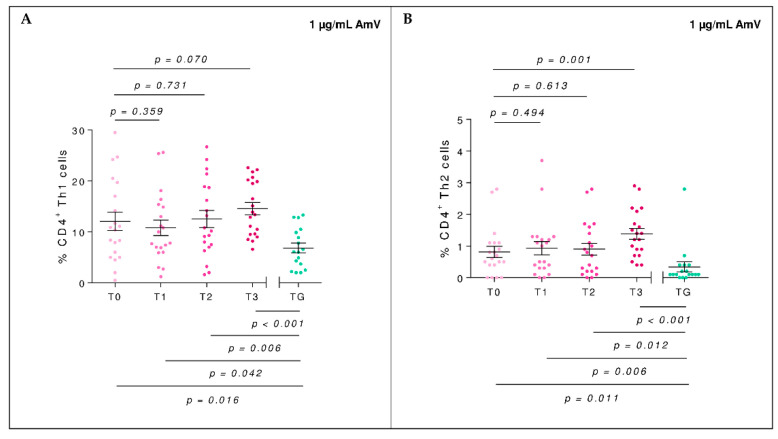
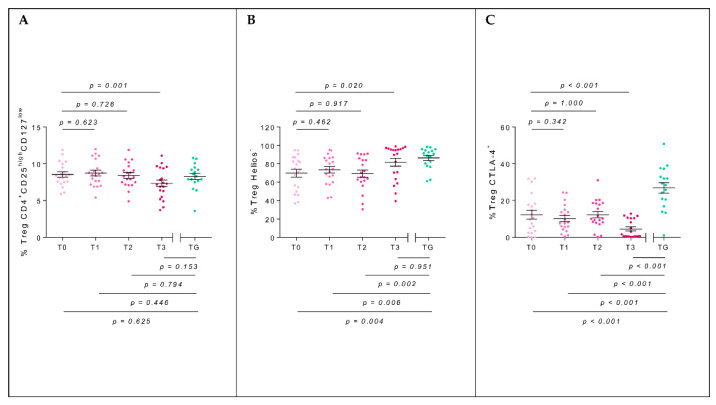
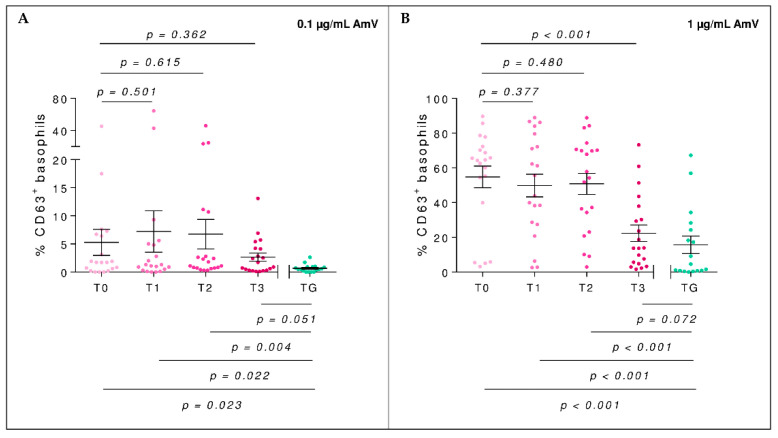
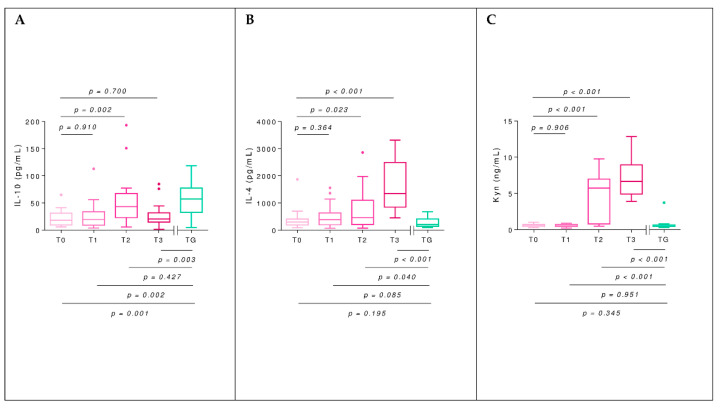
Inducing tolerance in Hymenoptera-allergic patients, bee venom immunotherapy (BVIT) is a widely accepted method to treat severe allergy to bee stings. In order to increase the existing knowledge on the underlying immunological mechanisms and look for possible biomarkers predictive of efficacy, a group of 20 bee-venom-allergic patients (AG) were thoroughly examined during their first year of BVIT. In addition, the results of treated patients with those of an untreated group of 20 tolerant beekeepers (TG) who had previously shown a firm suppressor-regulatory profile were compared. Tolerance in AG patients was invariably associated with a significant regulatory response characterised by the expansion of Helios- subpopulation and increased IL-10, specific IgG4 (sIgG4), and kynurenine levels. Although specific IgE (sIgE) levels increased transiently, surprisingly, the T helper type 2 (Th2) population and IL-4 levels rose significantly after one year of immunotherapy. Thus, the picture of two parallel phenomena emerges: a tolerogenic response and an allergenic one. Comparing these results with those obtained from the TG, different immunological mechanisms appear to govern natural and acquired tolerance to immunotherapy. Of particular interest, the kynurenine levels and T regulatory (Treg) Helios- population could be proposed as new biomarkers of response to BVIT.
Keywords: Helios protein; anaphylaxis; bee venom immunotherapy; kynurenine; tolerance.
Conflict of interest statement
M.L.E. received a salary from the ISCIII under project RD16/0006/0018. The remaining authors declare that they have no conflict of interest concerning this work.
Figures
Similar articles
-
Helios-Negative Regulatory T Cells as a Key Factor of Immune Tolerance in Nonallergic Beekeepers.J Investig Allergol Clin Immunol. 2022 Dec 15;32(6):451-459. doi: 10.18176/jiaci.0722. Epub 2022 Jul 2. J Investig Allergol Clin Immunol. 2022. PMID: 34213416
-
IgE-Api m 4 Is Useful for Identifying a Particular Phenotype of Bee Venom Allergy.J Investig Allergol Clin Immunol. 2016;26(6):355-361. doi: 10.18176/jiaci.0053. J Investig Allergol Clin Immunol. 2016. PMID: 27996941
-
Rush hymenoptera venom immunotherapy is efficacious and safe.J Investig Allergol Clin Immunol. 2006;16(4):232-8. J Investig Allergol Clin Immunol. 2006. PMID: 16889280
-
Hymenoptera Venom Allergy: How Does Venom Immunotherapy Prevent Anaphylaxis From Bee and Wasp Stings?Front Immunol. 2019 Aug 21;10:1959. doi: 10.3389/fimmu.2019.01959. eCollection 2019. Front Immunol. 2019. PMID: 31497015 Free PMC article. Review.
-
The Lights and the Shadows of Controlled Sting Challenge With Hymenoptera.J Investig Allergol Clin Immunol. 2022 Oct 11;32(5):357-366. doi: 10.18176/jiaci.0838. Epub 2022 Jun 22. J Investig Allergol Clin Immunol. 2022. PMID: 35735250 Review.
Cited by
-
The Role and Clinical Relevance of Osteopontin in Allergic Airway Diseases.J Clin Med. 2023 Mar 22;12(6):2433. doi: 10.3390/jcm12062433. J Clin Med. 2023. PMID: 36983433 Free PMC article. Review.
-
Effect of early postnatal supplementation of newborns with probiotic strain E. coli O83:K24:H31 on allergy incidence, dendritic cells, and microbiota.Front Immunol. 2023 Jan 9;13:1038328. doi: 10.3389/fimmu.2022.1038328. eCollection 2022. Front Immunol. 2023. PMID: 36703968 Free PMC article.
-
Mechanisms and biomarkers of successful allergen-specific immunotherapy.Asia Pac Allergy. 2022 Oct 31;12(4):e45. doi: 10.5415/apallergy.2022.12.e45. eCollection 2022 Oct. Asia Pac Allergy. 2022. PMID: 36452016 Free PMC article. Review.
-
Role of IgG4 Antibodies in Human Health and Disease.Cells. 2025 Apr 25;14(9):639. doi: 10.3390/cells14090639. Cells. 2025. PMID: 40358163 Free PMC article. Review.
-
IgG4 autoantibodies and autoantigens in the context of IgG4-autoimmune disease and IgG4-related disease.Front Immunol. 2024 Feb 16;15:1272084. doi: 10.3389/fimmu.2024.1272084. eCollection 2024. Front Immunol. 2024. PMID: 38433835 Free PMC article. Review.
References
Publication types
MeSH terms
Substances
LinkOut - more resources
Full Text Sources
Medical
Miscellaneous
