

In Situ Measurements of Domestic Water Quality and Health Risks by Elevated Concentration of Heavy Metals and Metalloids Using Monte Carlo and MLGI Methods
- PMID: 35878248
- PMCID: PMC9320182
- DOI: 10.3390/toxics10070342
In Situ Measurements of Domestic Water Quality and Health Risks by Elevated Concentration of Heavy Metals and Metalloids Using Monte Carlo and MLGI Methods
Abstract
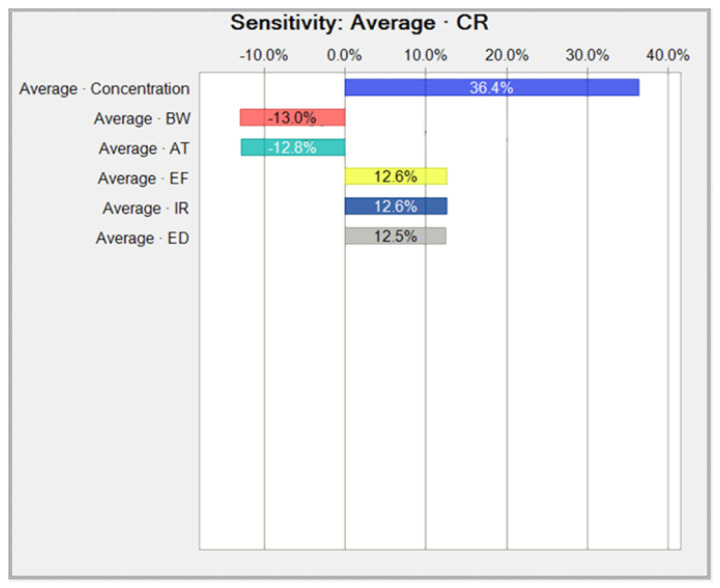
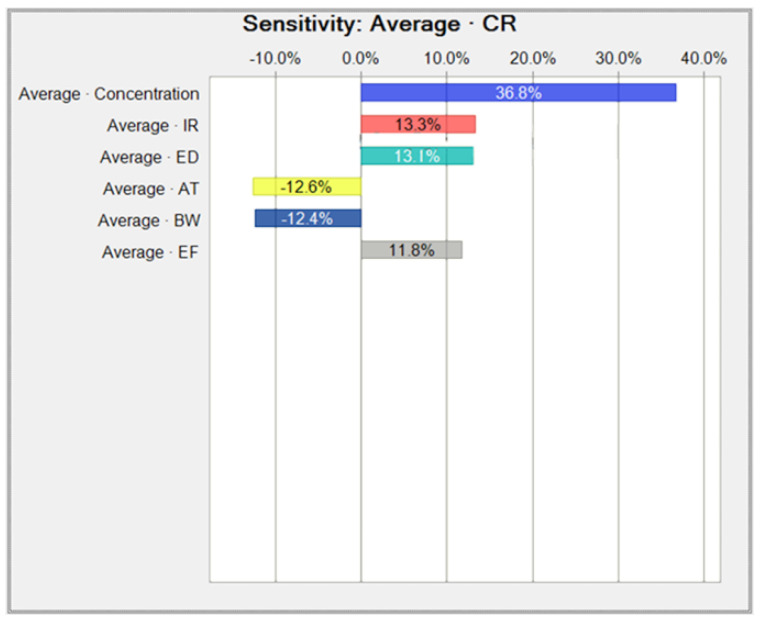
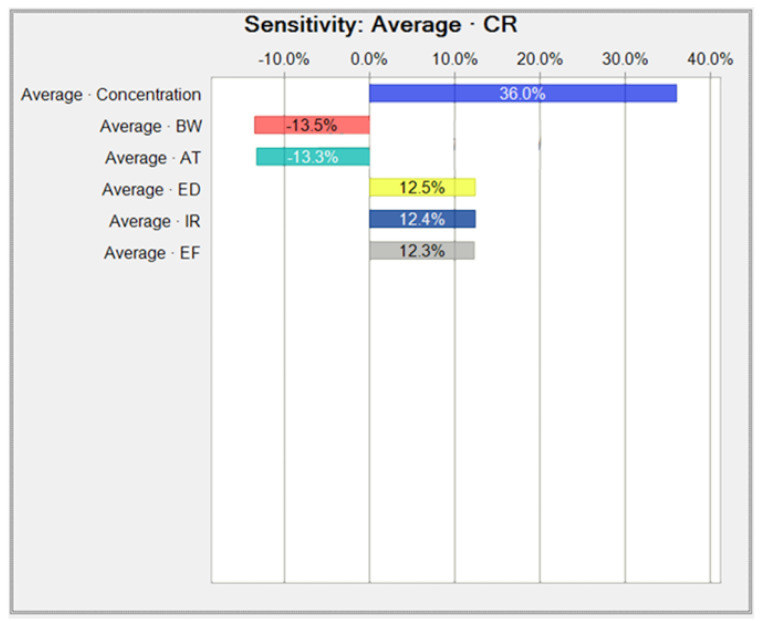
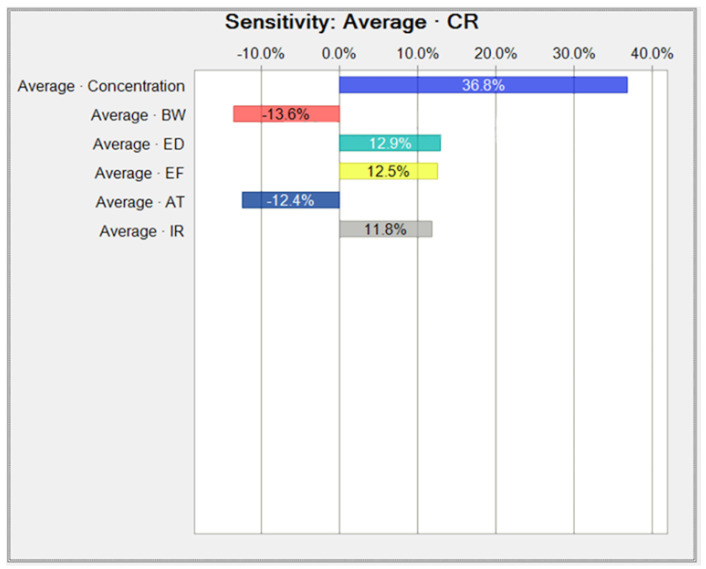
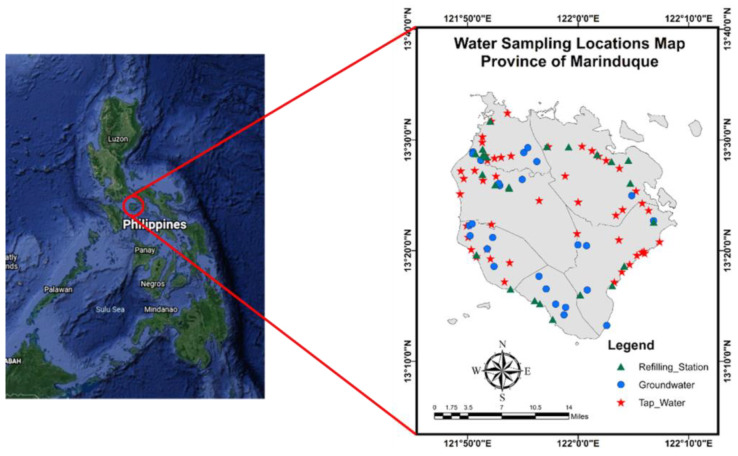
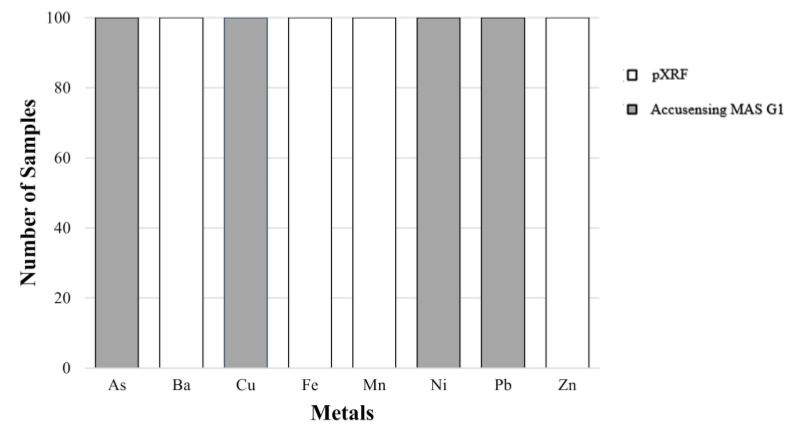
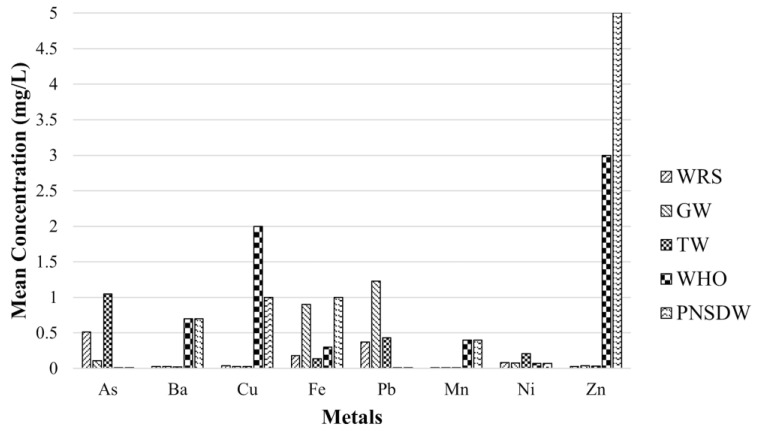
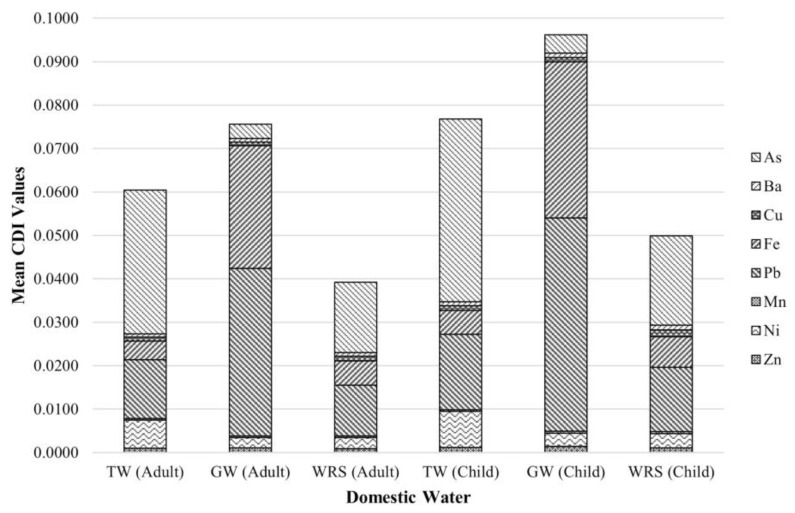
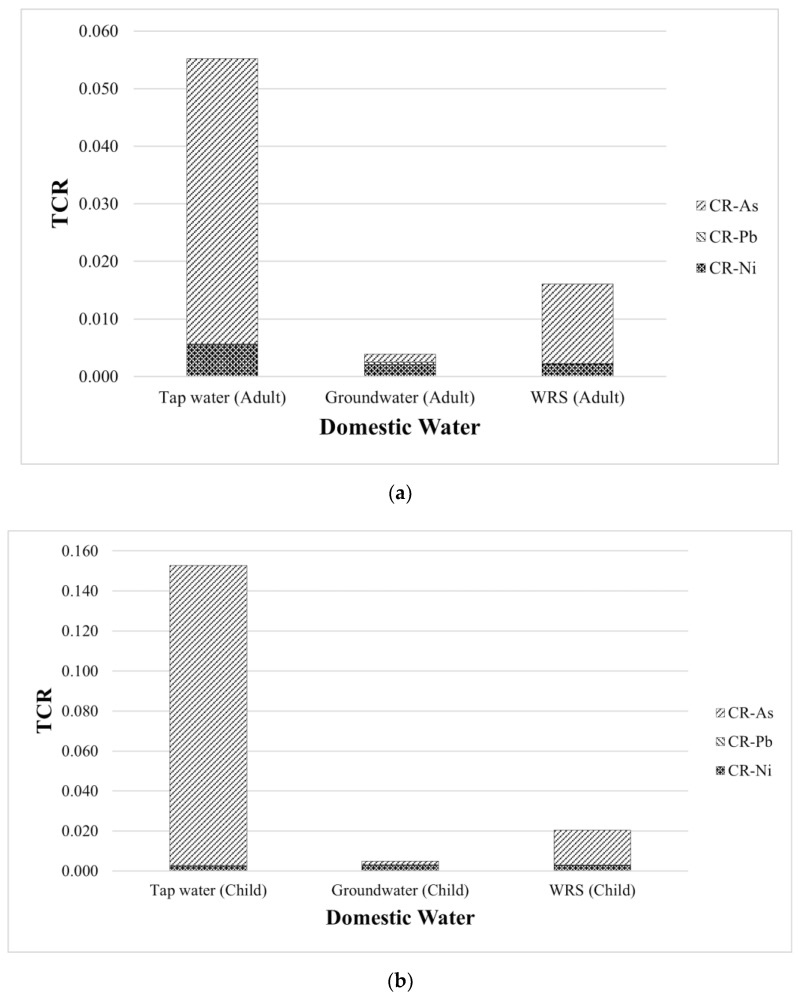
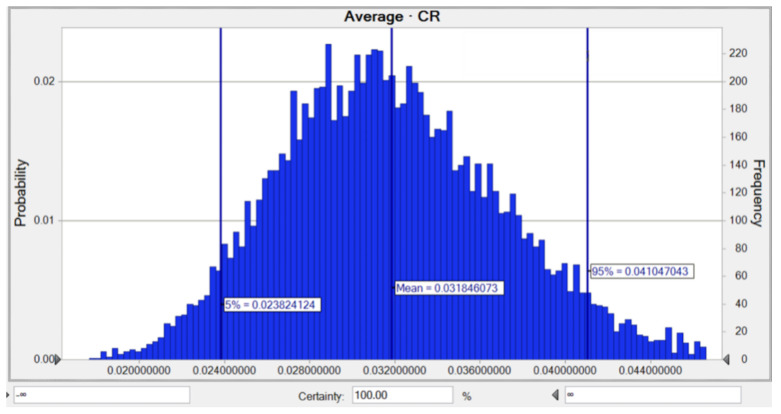
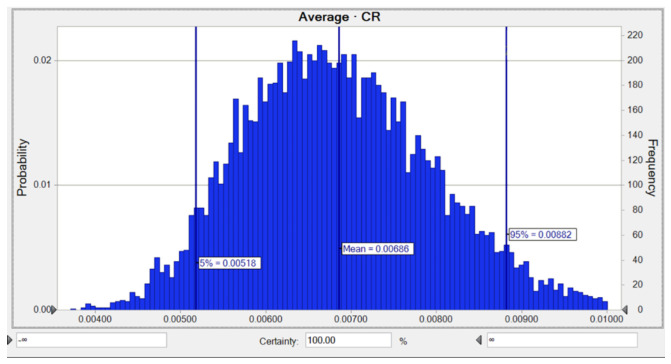
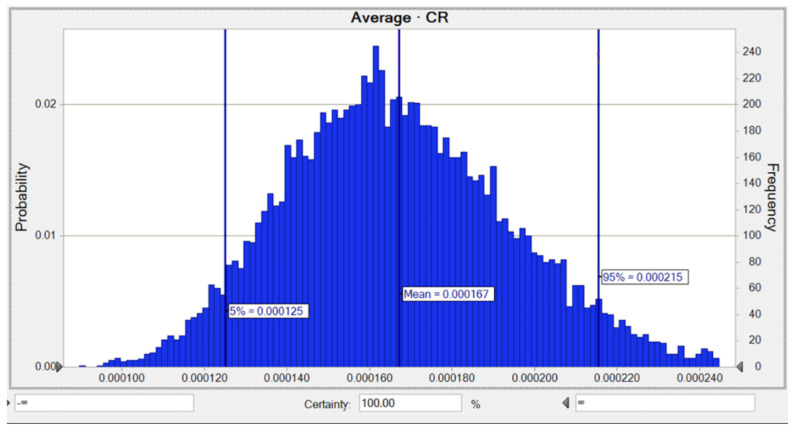
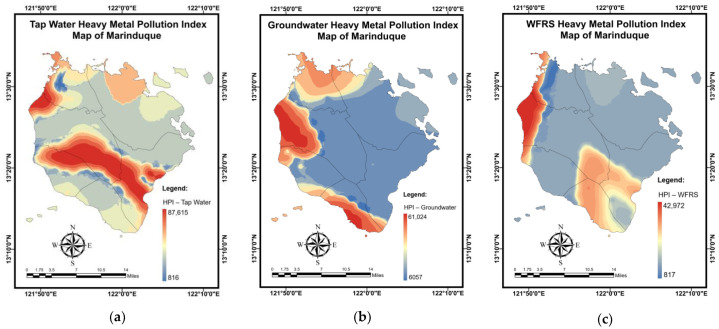
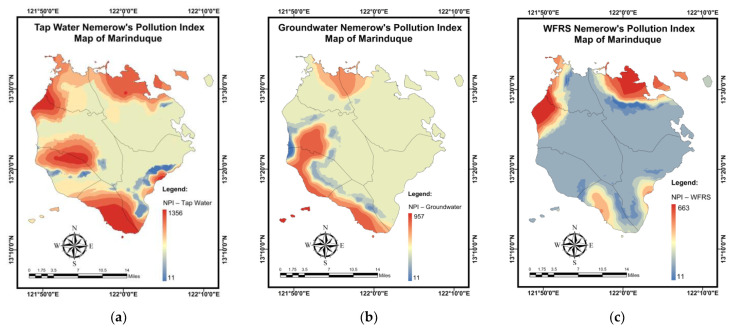
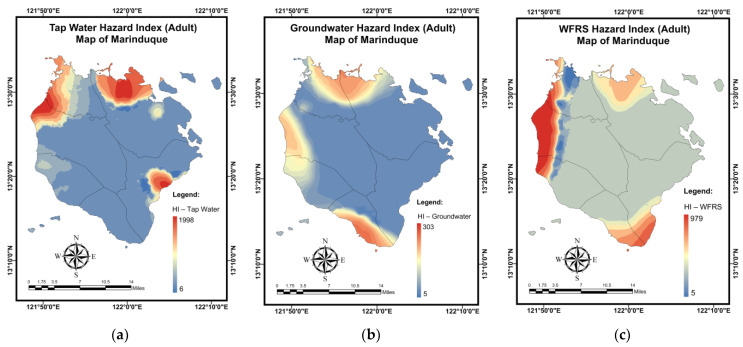
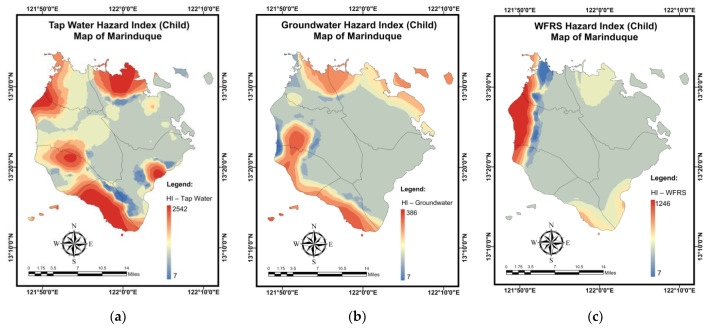
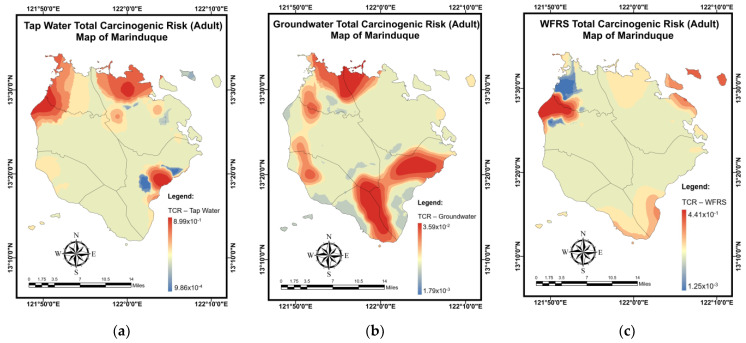
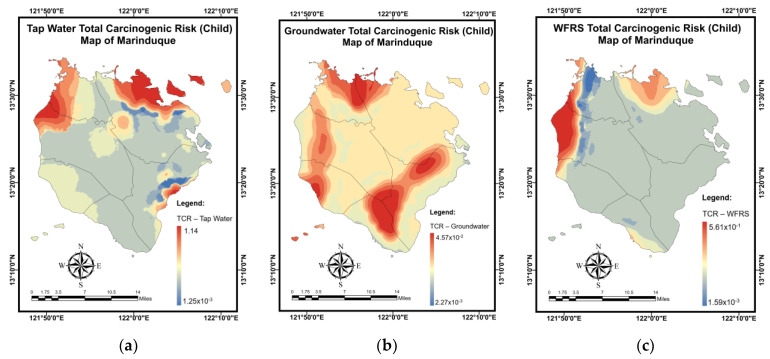
The domestic water (DW) quality of an island province in the Philippines that experienced two major mining disasters in the 1990s was assessed and evaluated in 2021 utilizing the heavy metals pollution index (MPI), Nemerow's pollution index (NPI), and the total carcinogenic risk (TCR) index. The island province sources its DW supply from groundwater (GW), surface water (SW), tap water (TP), and water refilling stations (WRS). This DW supply is used for drinking and cooking by the population. In situ analyses were carried out using an Olympus Vanta X-ray fluorescence spectrometer (XRF) and Accusensing Metals Analysis System (MAS) G1 and the target heavy metals and metalloids (HMM) were arsenic (As), barium (Ba), copper (Cu), iron (Fe), lead (Pb), manganese (Mn), nickel (Ni), and zinc (Zn). The carcinogenic risk was evaluated using the Monte Carlo (MC) method while a machine learning geostatistical interpolation (MLGI) technique was employed to create spatial maps of the metal concentrations and health risk indices. The MPI values calculated at all sampling locations for all water samples indicated a high pollution. Additionally, the NPI values computed at all sampling locations for all DW samples were categorized as "highly polluted". The results showed that the health quotient indices (HQI) for As and Pb were significantly greater than 1 in all water sources, indicating a probable significant health risk (HR) to the population of the island province. Additionally, As exhibited the highest carcinogenic risk (CR), which was observed in TW samples. This accounted for 89.7% of the total CR observed in TW. Furthermore, all sampling locations exceeded the recommended maximum threshold level of 1.0 × 10⁻⁴ by the USEPA. Spatial distribution maps of the contaminant concentrations and health risks provide valuable information to households and guide local government units as well as regional and national agencies in developing strategic interventions to improve DW quality in the island province.
Keywords: carcinogenic risk; domestic water; machine learning; metal pollution; spatial distribution maps.
Conflict of interest statement
The authors declare no conflict of interest.
Figures
Similar articles
-
Hydrological distribution of physicochemical parameters and heavy metals in surface water and their ecotoxicological implications in the Bay of Bengal coast of Bangladesh.Environ Sci Pollut Res Int. 2021 Dec;28(48):68585-68599. doi: 10.1007/s11356-021-15353-9. Epub 2021 Jul 17. Environ Sci Pollut Res Int. 2021. PMID: 34275081
-
Spatial distribution, ecological and health risk assessment of heavy metals in marine surface sediments and coastal seawaters of fringing coral reefs of the Persian Gulf, Iran.Chemosphere. 2017 Oct;185:1090-1111. doi: 10.1016/j.chemosphere.2017.07.110. Epub 2017 Jul 23. Chemosphere. 2017. PMID: 28764111
-
Transition Metals in Freshwater Crustaceans, Tilapia, and Inland Water: Hazardous to the Population of the Small Island Province.Toxics. 2021 Apr 1;9(4):71. doi: 10.3390/toxics9040071. Toxics. 2021. PMID: 33915720 Free PMC article.
-
Assessment of heavy metal pollution and human health risk in urban soils of steel industrial city (Anshan), Liaoning, Northeast China.Ecotoxicol Environ Saf. 2015 Oct;120:377-85. doi: 10.1016/j.ecoenv.2015.06.019. Epub 2015 Jun 24. Ecotoxicol Environ Saf. 2015. PMID: 26114257
-
A global meta-analysis of heavy metal(loid)s pollution in soils near copper mines: Evaluation of pollution level and probabilistic health risks.Sci Total Environ. 2022 Aug 20;835:155441. doi: 10.1016/j.scitotenv.2022.155441. Epub 2022 Apr 22. Sci Total Environ. 2022. PMID: 35469881 Review.
Cited by
-
Trihalomethane Cancer Risk Assessment for Private and Shared Residences: Addressing the Differences in Inhalation Exposure.Toxics. 2023 Mar 23;11(4):295. doi: 10.3390/toxics11040295. Toxics. 2023. PMID: 37112522 Free PMC article.
-
Microbial and potentially toxic elements risk assessment in high Andean river water based on Monte Carlo simulation, Peru.Sci Rep. 2023 Dec 6;13(1):21473. doi: 10.1038/s41598-023-48853-4. Sci Rep. 2023. PMID: 38053001 Free PMC article.
-
Environmental and Health Risks Posed by Heavy Metal Contamination of Groundwater in the Sunan Coal Mine, China.Toxics. 2022 Jul 12;10(7):390. doi: 10.3390/toxics10070390. Toxics. 2022. PMID: 35878294 Free PMC article.
-
Detection of Heavy Metals, Their Distribution in Tilapia spp., and Health Risks Assessment.Toxics. 2023 Mar 20;11(3):286. doi: 10.3390/toxics11030286. Toxics. 2023. PMID: 36977051 Free PMC article.
-
Pollution and Health Risk Assessment of Potentially Toxic Elements in Groundwater in the Kǒnqi River Basin (NW China).Toxics. 2024 Jun 29;12(7):474. doi: 10.3390/toxics12070474. Toxics. 2024. PMID: 39058126 Free PMC article.
References
-
- World Health Organization Drinking Water. [(accessed on 15 January 2022)]. Available online: https://www.who.int/news-room/fact-sheets/detail/drinking-water.
-
- Chinye-Ikejiunor N., Iloegbunam G.O., Chukwuka A., Ogbeide O. Groundwater contamination and health risk assessment across an urban gradient: Case study of Onitcha metropolis, south-eastern Nigeria. Groundw. Sustain. Dev. 2021;14:100642. doi: 10.1016/j.gsd.2021.100642. - DOI
-
- Adeyemi A.A., Ojekunle Z.O. Concentrations and health risk assessment of industrial heavy metals pollution in groundwater in Ogun state, Nigeria. Sci. Afr. 2021;11:e00666. doi: 10.1016/j.sciaf.2020.e00666. - DOI
-
- Lapong E., Fujihara M. Water Resources in the Philippines: An Overview of its Uses, Management, Problems and Prospects. J. Rainwater Catchment Syst. 2008;14:57–67. doi: 10.7132/jrcsa.KJ00004978343. - DOI
Grants and funding
LinkOut - more resources
Full Text Sources
Research Materials
Miscellaneous
