

Are Speech Perception Scores in Cochlear Implant Recipients Consistent Across Different Tests?
- PMID: 35878632
- PMCID: PMC9335890
- DOI: 10.1097/MAO.0000000000003589
Are Speech Perception Scores in Cochlear Implant Recipients Consistent Across Different Tests?
Abstract
Objective: Cochlear implant (CI) candidacy and postoperative outcomes are assessed using sets of speech perception tests that vary from center to center, limiting comparisons across institutions and time periods. The objective of this study was to determine if scores on one speech perception test could be reliably predicted from scores on another test.
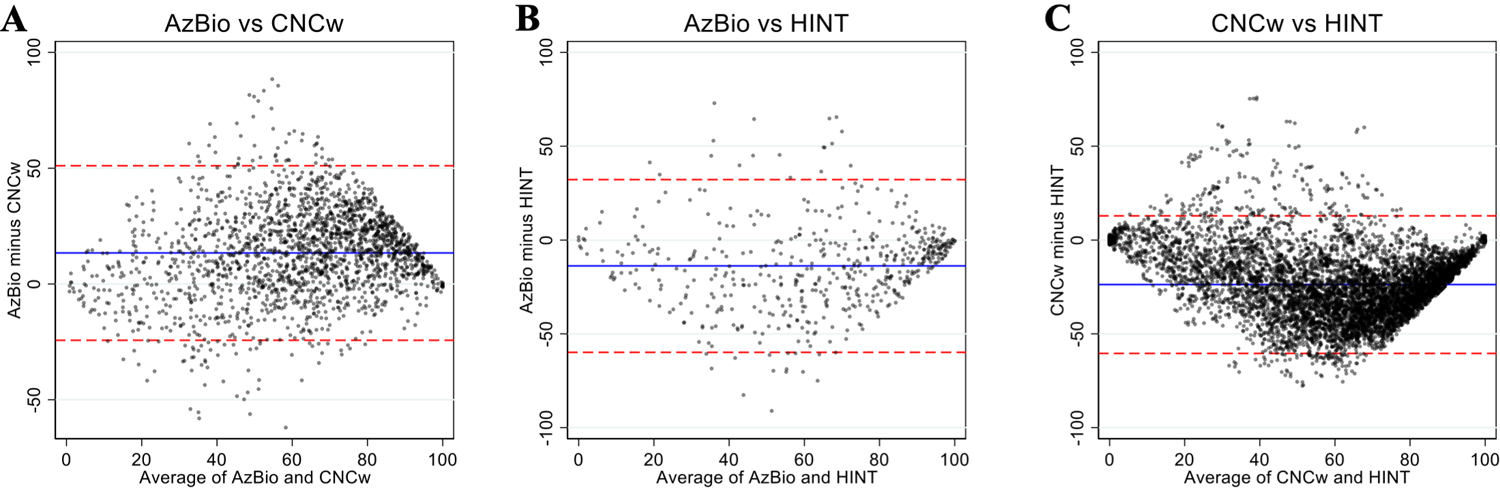
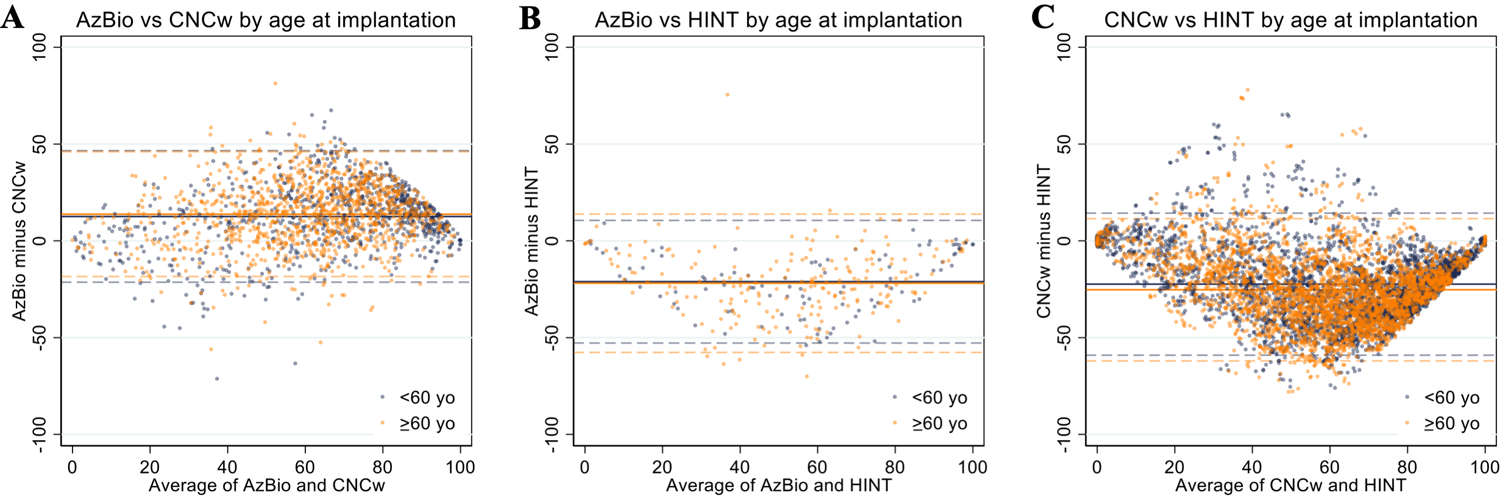
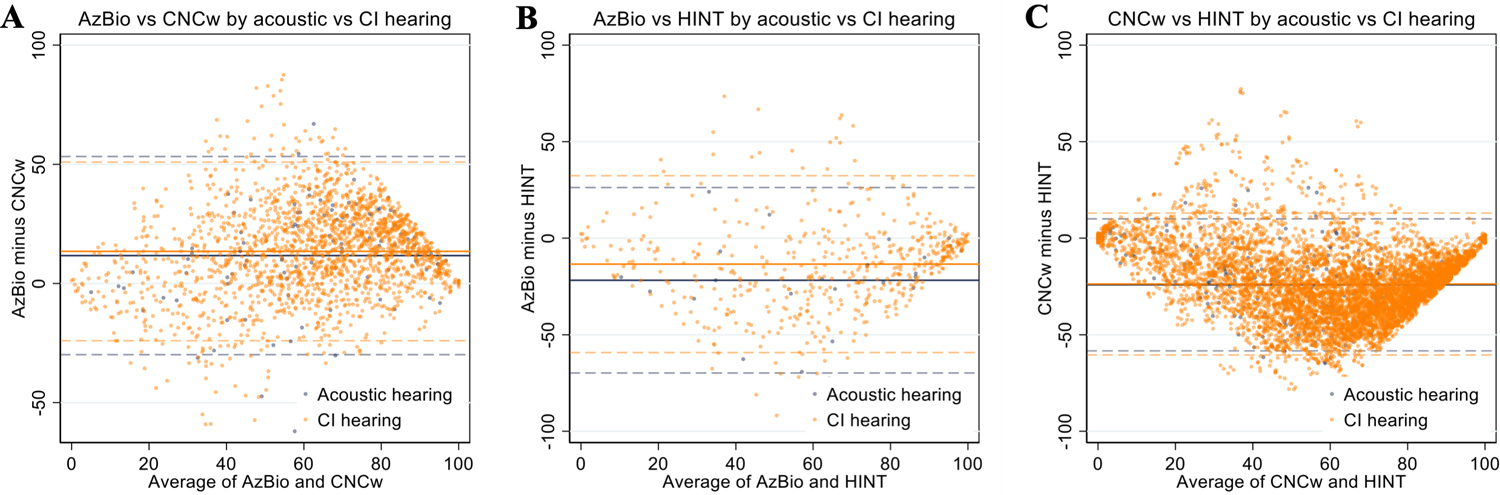
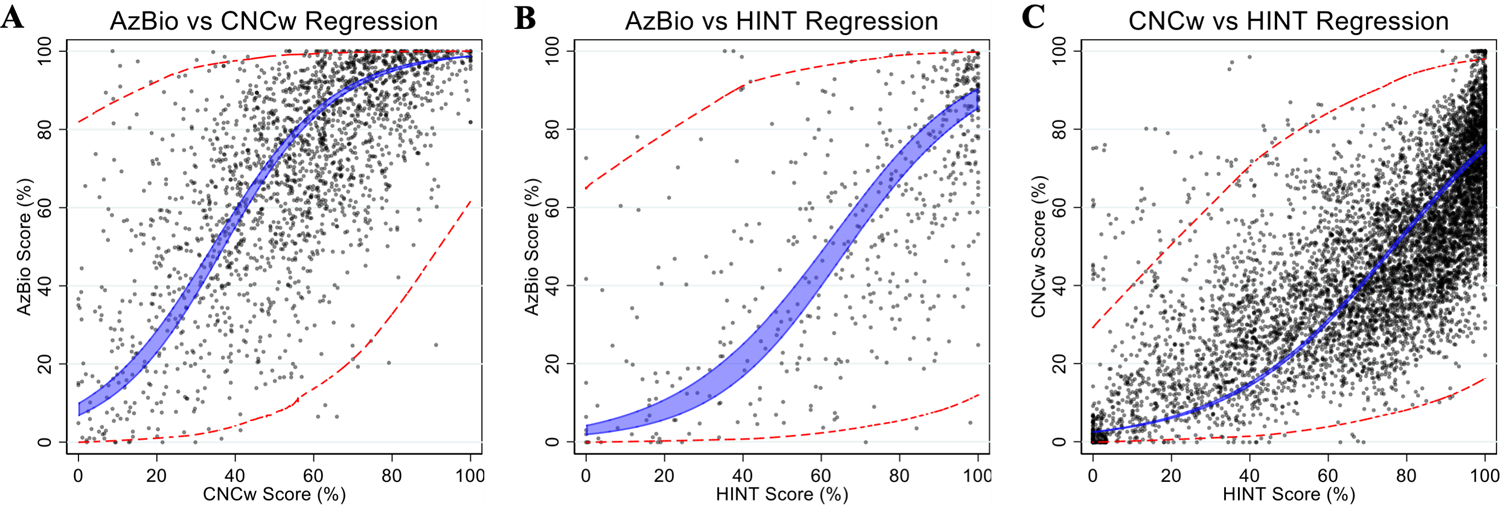
Study design: Arizona Biomedical (AzBio) Sentence Test, Consonant-Nucleus-Consonant word (CNCw), and Hearing in Noise Test (HINT) scores in quiet for the implanted ear were collected for individuals who received a CI between 1985 and 2019. Scores collected during the same testing session were analyzed using Bland-Altman plots to assess agreement between testing methods. Simple linear regression with logit transformation was used to generate predictive functions and 95% confidence intervals for expected mean and individual scores.
Setting: Single academic medical center.
Patients: A total of 1,437 individuals with a median age of 59.9 years (range, 18-95 yr) and 46% (654 of 1,437) male.
Interventions: N.A.
Main outcome measures: Agreement as a function of test score, mean, variance, and correlation coefficients.
Results: A total of 2,052 AzBio/CNCw, 525 AzBio/HINT, and 7,187 CNCw/HINT same-session score pairings were identified. Pairwise test comparisons demonstrated limited agreement between different tests performed in the same session, and a score correlation between different speech tests revealed large variances.
Conclusion: Transformation functions between test batteries were predictive of mean scores but performed poorly for prediction of individual scores. Point-wise comparisons of scores across CI test batteries should be used with caution in clinical and research settings.
Copyright © 2022, Otology & Neurotology, Inc.
Conflict of interest statement
The authors disclose no conflicts of interest.
Figures

References
-
- Carlson ML. Cochlear Implantation in Adults. N Engl J Med 2020;382:1531–42. - PubMed
-
- Sorkin DL, Buchman CA. Cochlear Implant Access in Six Developed Countries. Otol Neurotol 2016;37:e161–4. - PubMed
-
- WHO World Report on Hearing 2021. https://www.who.int/teams/noncommunicable-diseases/sensory-functions-dis.... Accessed October 10, 2021.
