

Susceptibility networks reveal independent patterns of brain iron abnormalities in multiple sclerosis
- PMID: 35878723
- PMCID: PMC10097440
- DOI: 10.1016/j.neuroimage.2022.119503
Susceptibility networks reveal independent patterns of brain iron abnormalities in multiple sclerosis
Abstract
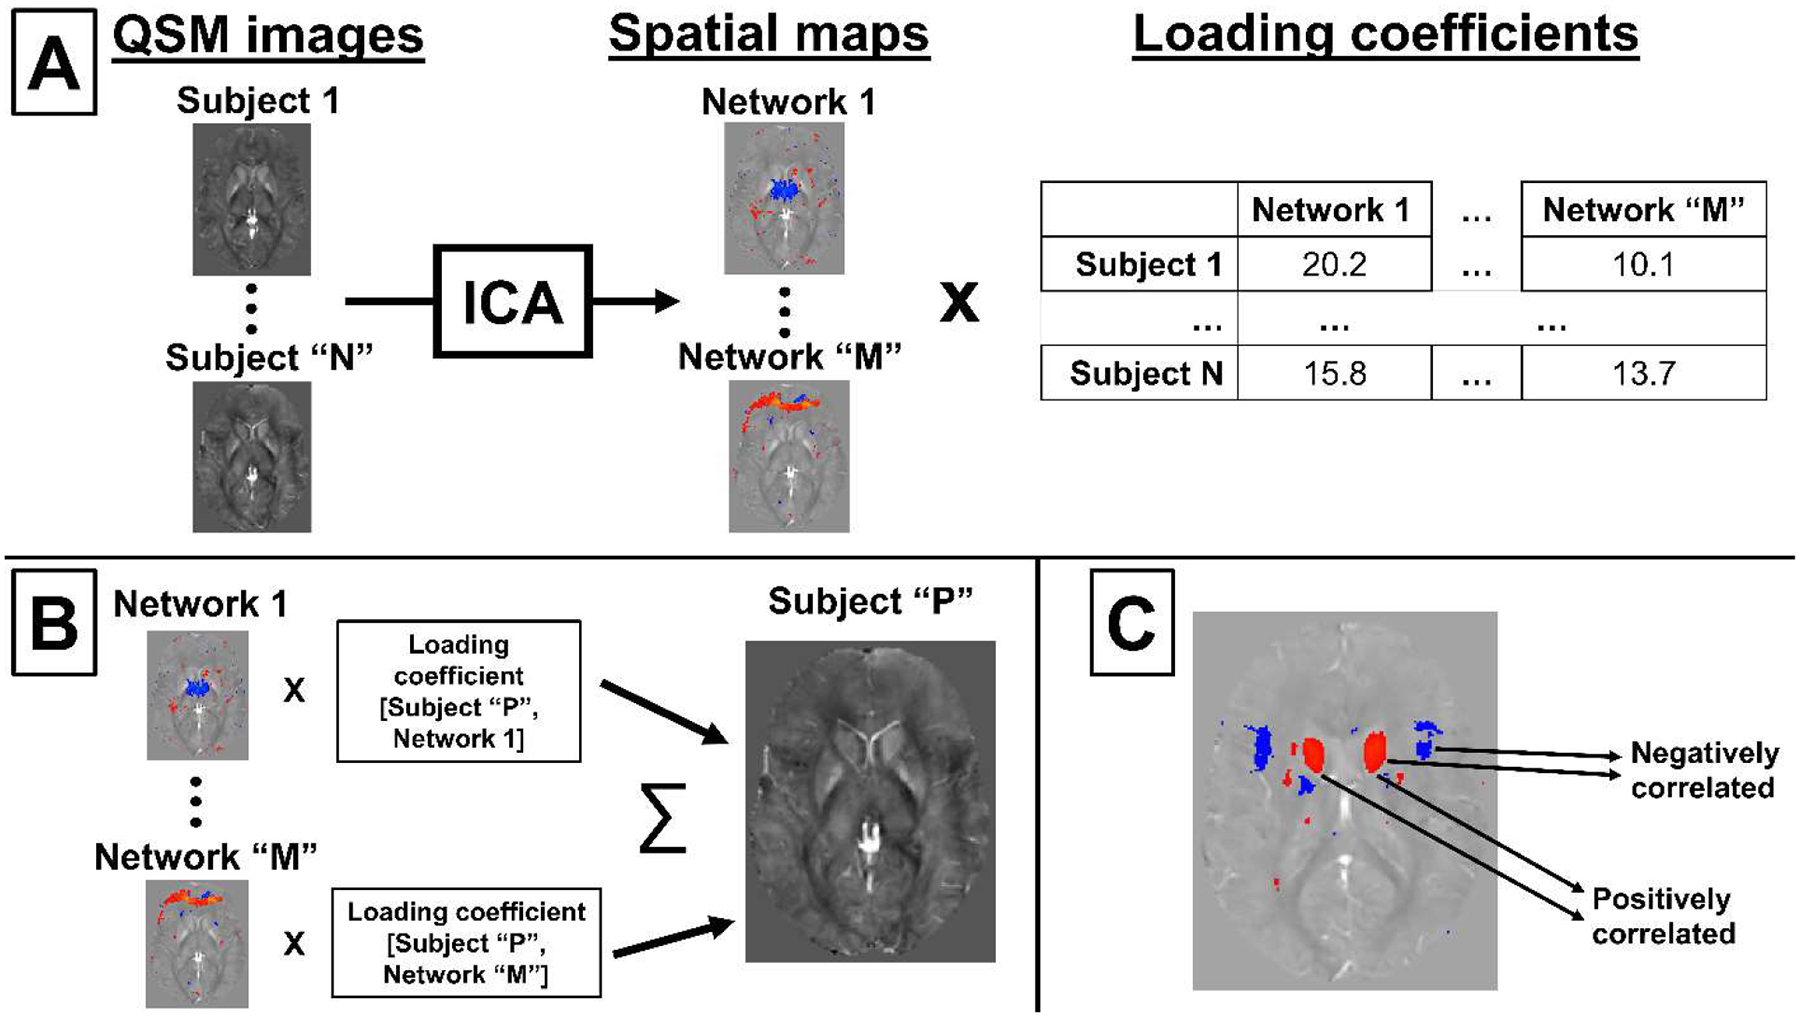
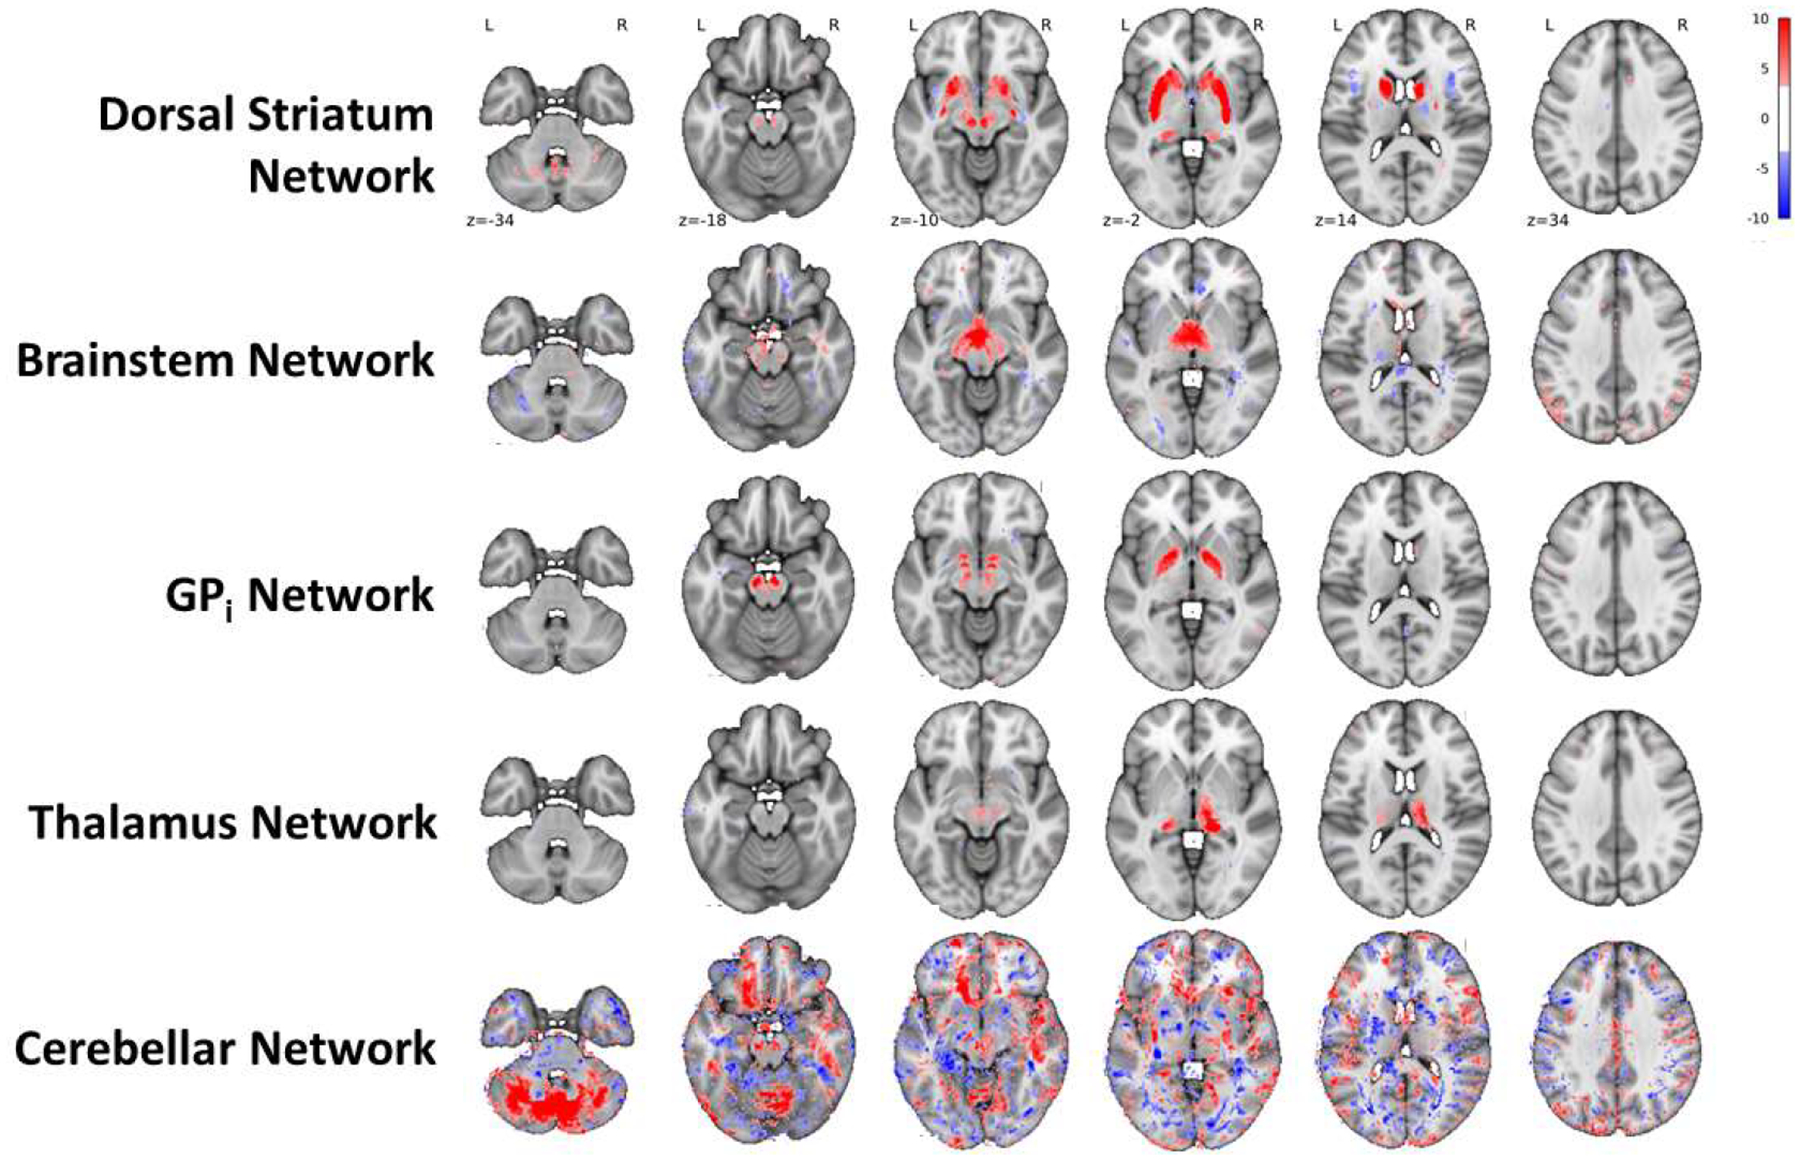
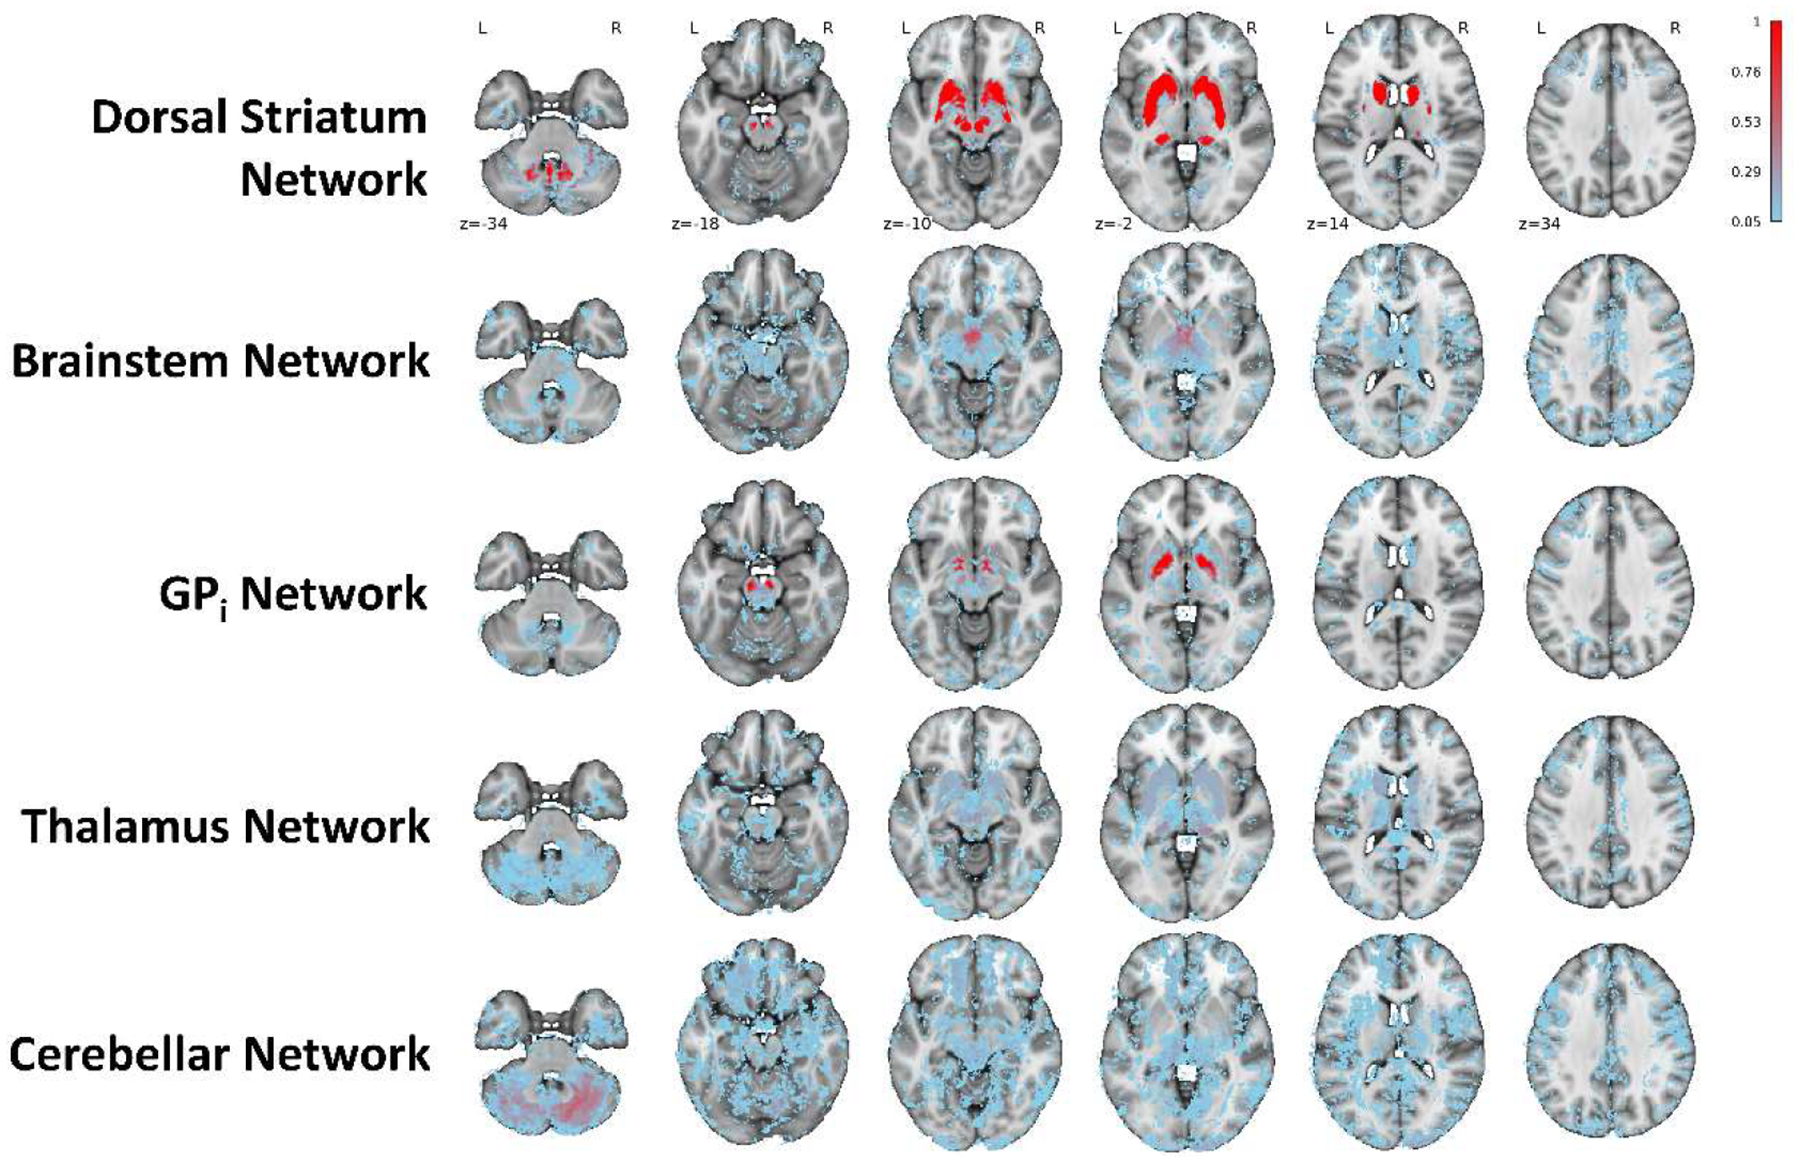
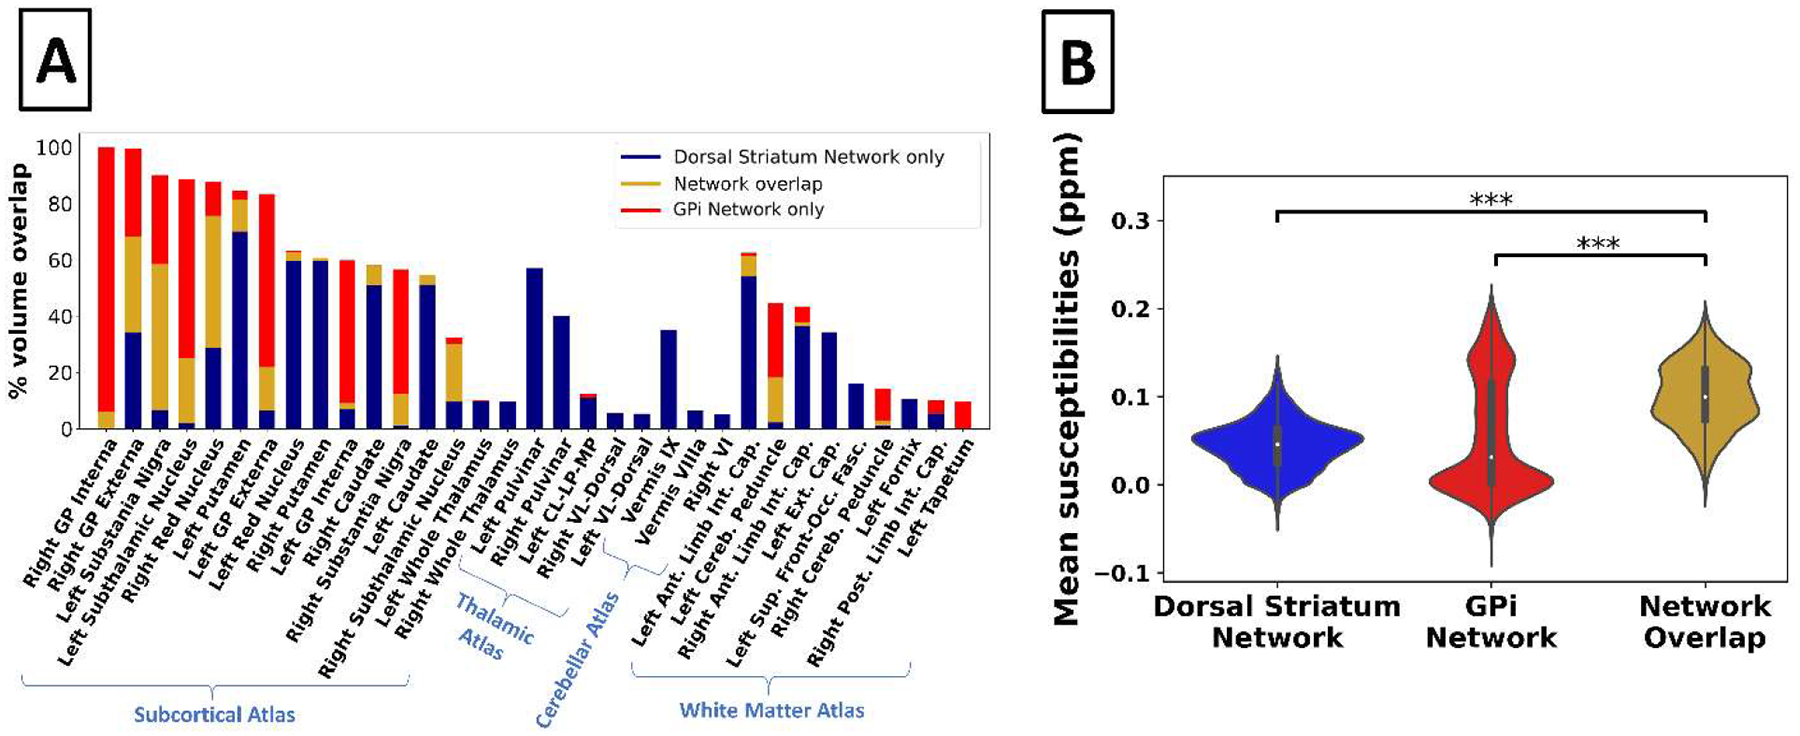
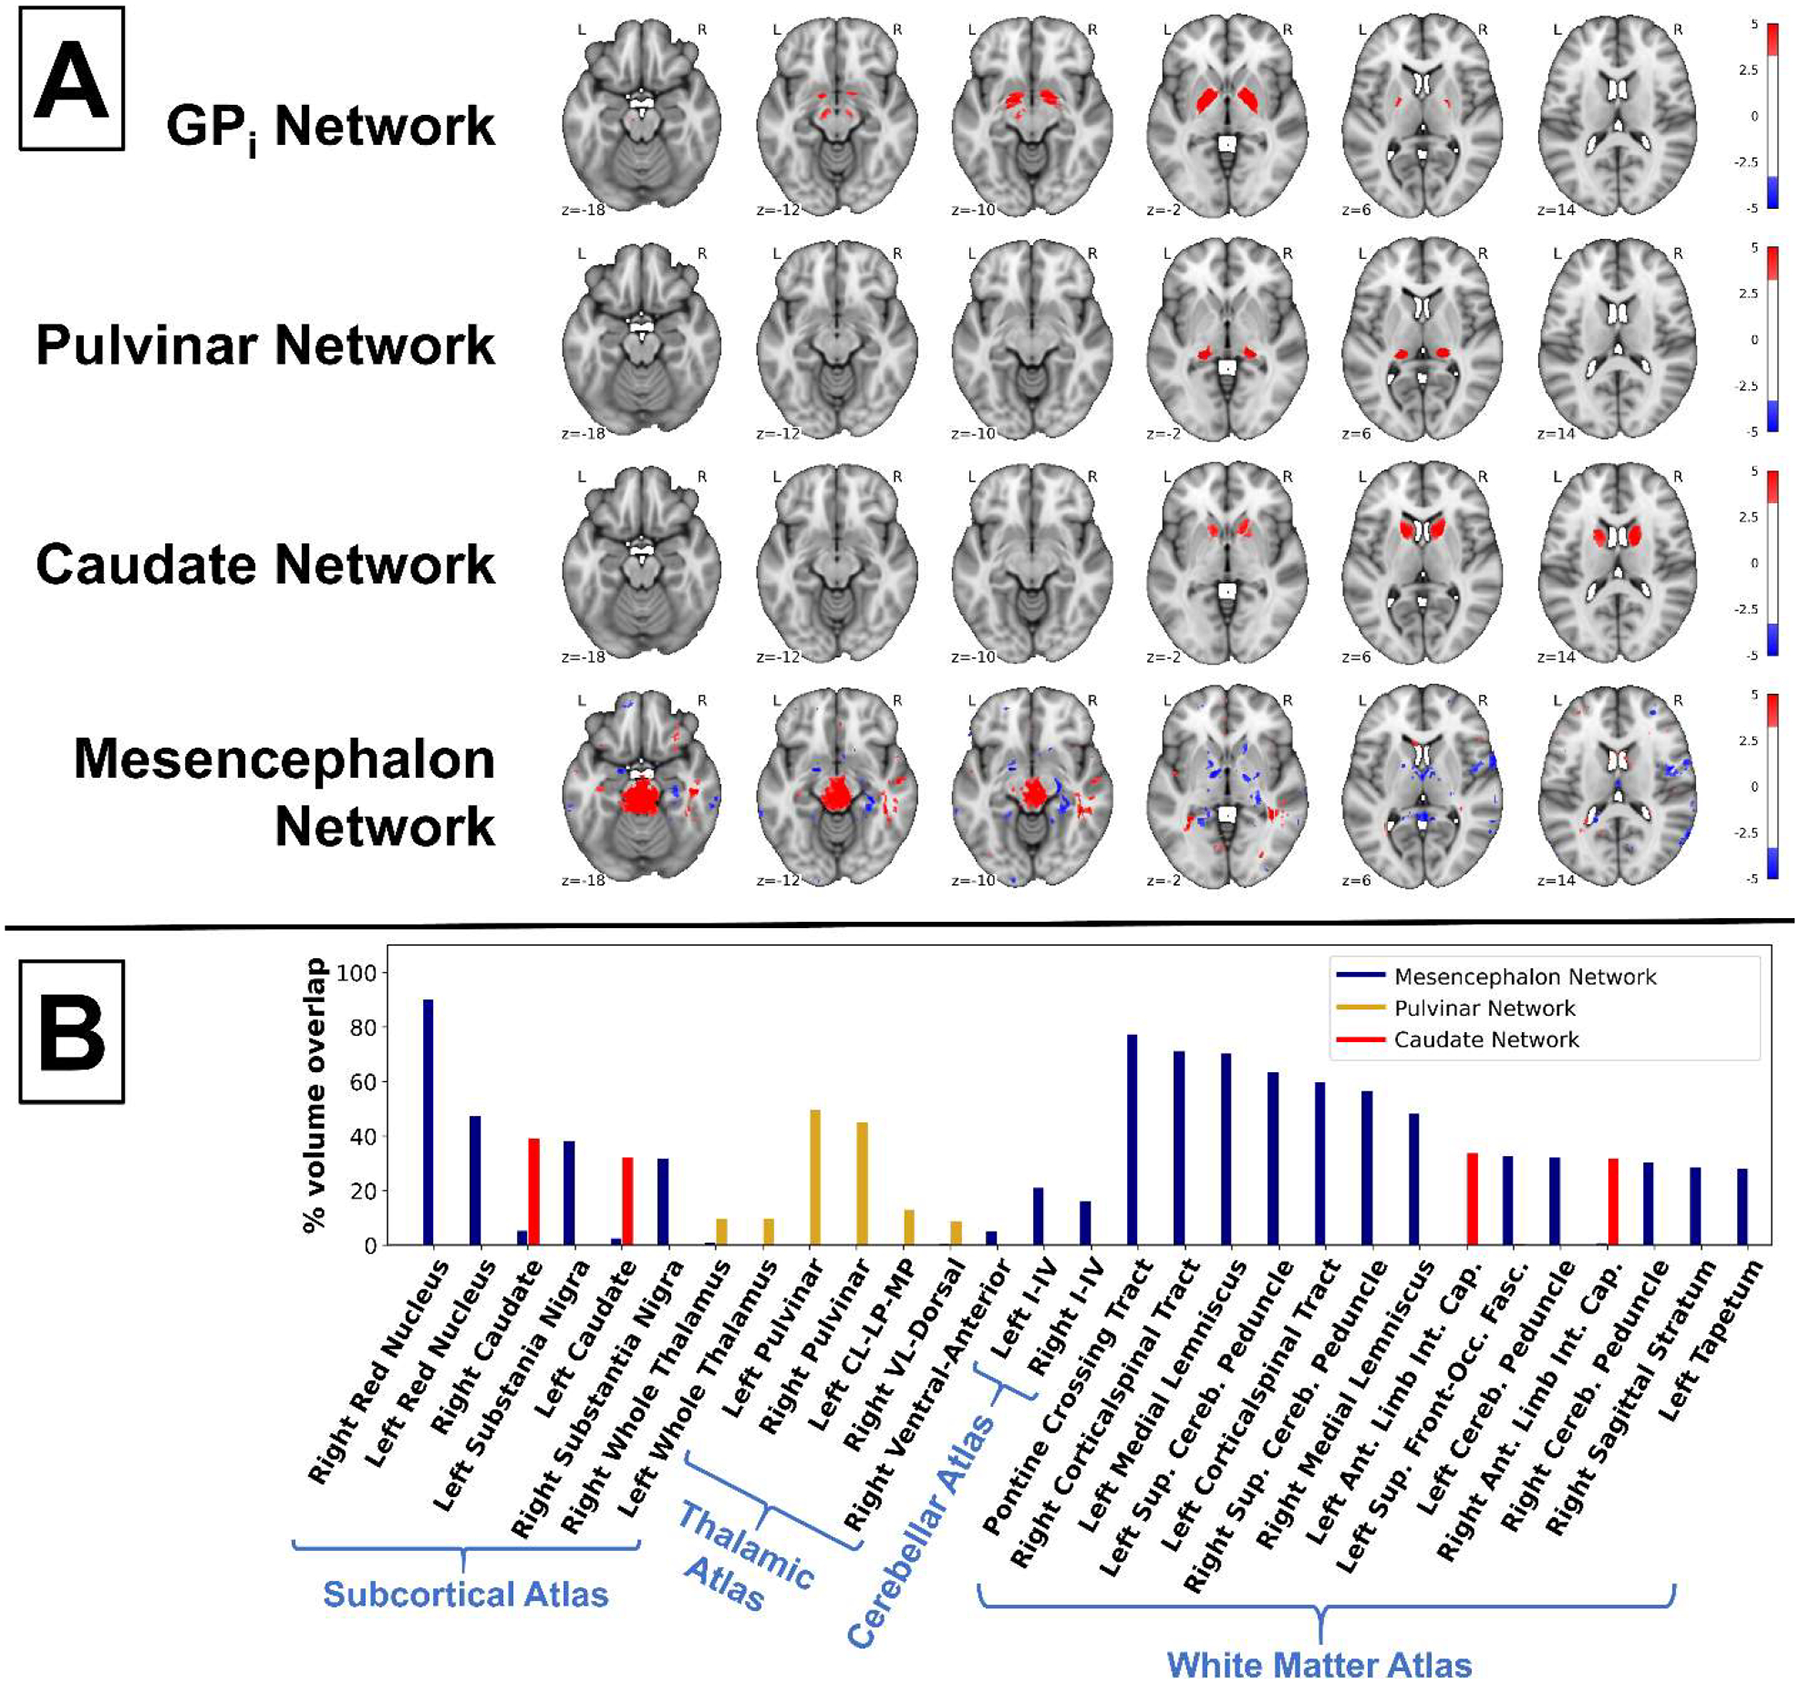
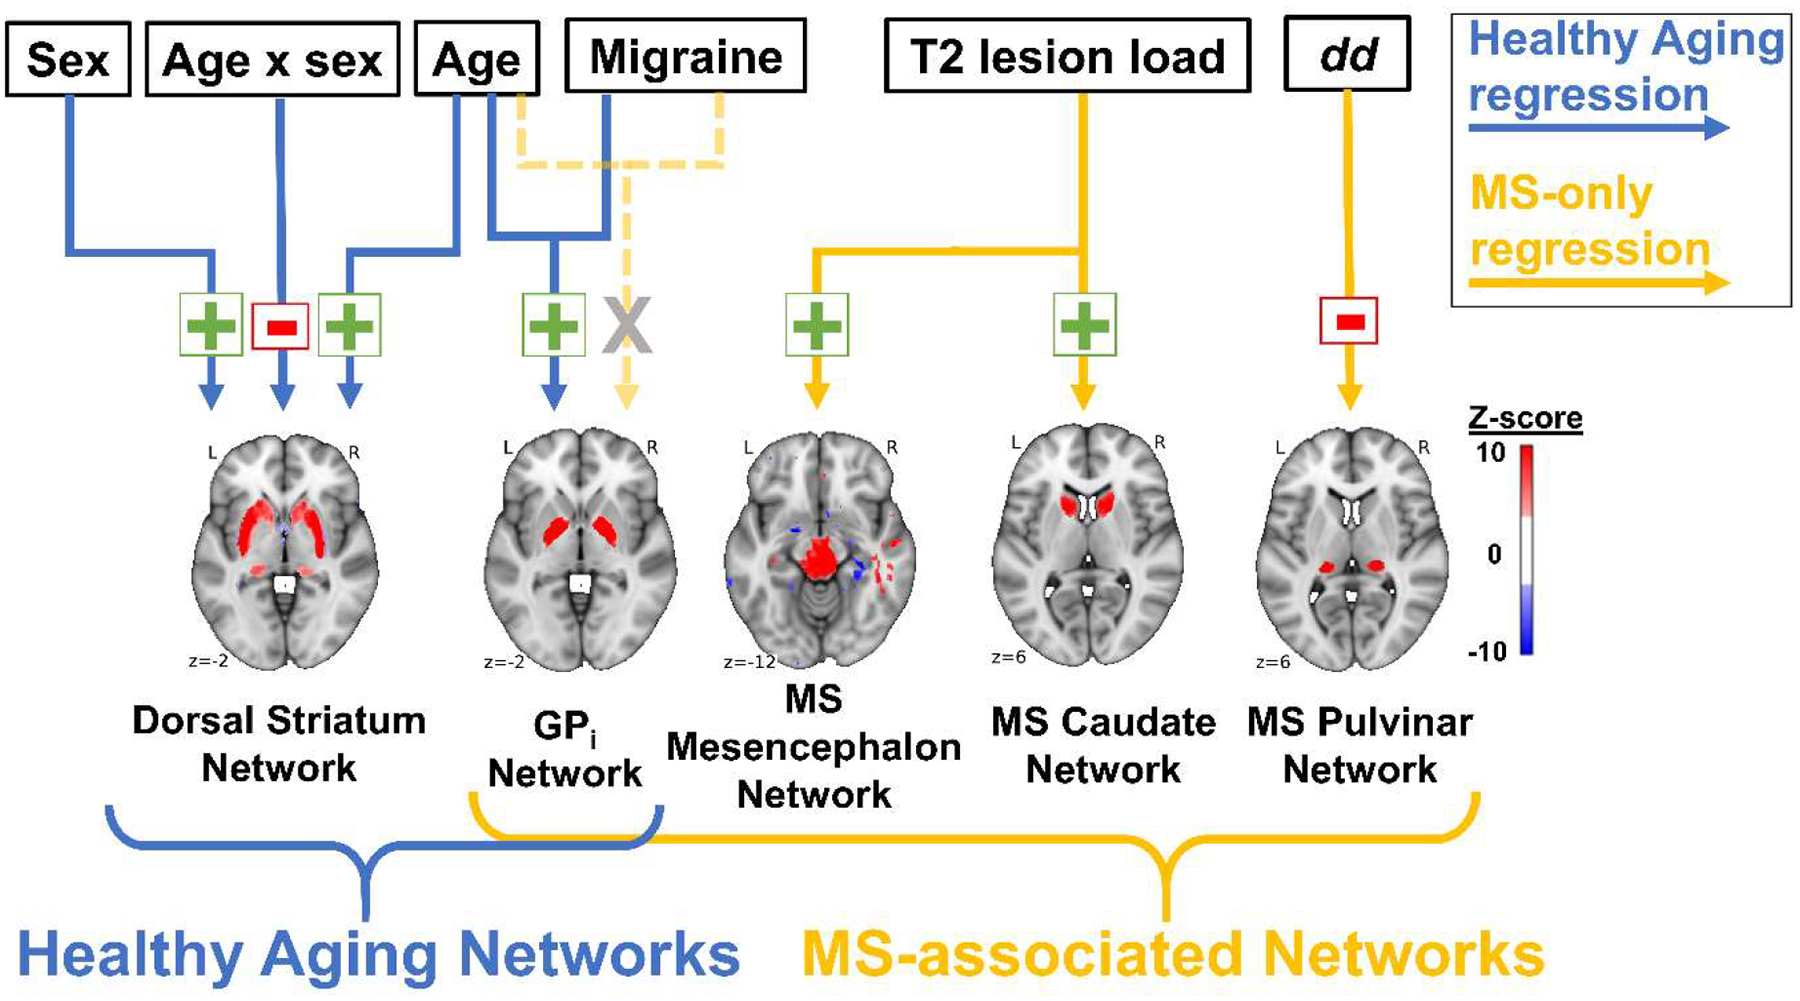
Brain iron homeostasis is necessary for healthy brain function. MRI and histological studies have shown altered brain iron levels in the brains of patients with multiple sclerosis (MS), particularly in the deep gray matter (DGM). Previous studies were able to only partially separate iron-modifying effects because of incomplete knowledge of iron-modifying processes and influencing factors. It is therefore unclear to what extent and at which stages of the disease different processes contribute to brain iron changes. We postulate that spatially covarying magnetic susceptibility networks determined with Independent Component Analysis (ICA) reflect, and allow for the study of, independent processes regulating iron levels. We applied ICA to quantitative susceptibility maps for 170 individuals aged 9-81 years without neurological disease ("Healthy Aging" (HA) cohort), and for a cohort of 120 patients with MS and 120 age- and sex-matched healthy controls (HC; together the "MS/HC" cohort). Two DGM-associated "susceptibility networks" identified in the HA cohort (the Dorsal Striatum and Globus Pallidus Interna Networks) were highly internally reproducible (i.e. "robust") across multiple ICA repetitions on cohort subsets. DGM areas overlapping both robust networks had higher susceptibility levels than DGM areas overlapping only a single robust network, suggesting that these networks were caused by independent processes of increasing iron concentration. Because MS is thought to accelerate brain aging, we hypothesized that associations between age and the two robust DGM-associated networks would be enhanced in patients with MS. However, only one of these networks was altered in patients with MS, and it had a null age association in patients with MS rather than a stronger association. Further analysis of the MS/HC cohort revealed three additional disease-related networks (the Pulvinar, Mesencephalon, and Caudate Networks) that were differentially altered between patients with MS and HCs and between MS subtypes. Exploratory regression analyses of the disease-related networks revealed differential associations with disease duration and T2 lesion volume. Finally, analysis of ROI-based disease effects in the MS/HC cohort revealed an effect of disease status only in the putamen ROI and exploratory regression analysis did not show associations between the caudate and pulvinar ROIs and disease duration or T2 lesion volume, showing the ICA-based approach was more sensitive to disease effects. These results suggest that the ICA network framework increases sensitivity for studying patterns of brain iron change, opening a new avenue for understanding brain iron physiology under normal and disease conditions.
Keywords: Aging; Iron; Multiple sclerosis; Network; QSM.
Copyright © 2022. Published by Elsevier Inc.
Conflict of interest statement
Declaration of competing interests Robert Zivadinov has received personal compensation from Bristol Myers Squibb, EMD Serono, Sanofi, Keystone Heart, Protembis, and Novartis for speaking and consultant fees and has received financial support for research activities from Sanofi, Novartis, Bristol Myers Squibb, Octave, Mapi Pharma, Keystone Heart, Protembis, and V-WAVE Medical. Bianca Weinstock-Guttman has participated in speakers bureaus for, served as a consultant for, and/or received research support from Biogen, EMD Serono, Novartis, Genentech, Celgene/Bristol Meyers Squibb, Sanofi & Genzyme, Janssen, Horizon, Bayer, and LabCorp. Dr. Weinstock-Guttman also serves on the editorial board for BMJ Neurology, Children, CNS Drugs, MS International, and Frontiers Epidemiology.
Figures
Similar articles
-
Age-dependent changes in brain iron deposition and volume in deep gray matter nuclei using quantitative susceptibility mapping.Neuroimage. 2023 Apr 1;269:119923. doi: 10.1016/j.neuroimage.2023.119923. Epub 2023 Feb 3. Neuroimage. 2023. PMID: 36739101
-
Deep gray matter changes in relapsing-remitting multiple sclerosis detected by multi-parametric, high-resolution magnetic resonance imaging (MRI).Eur Radiol. 2021 Feb;31(2):706-715. doi: 10.1007/s00330-020-07199-5. Epub 2020 Aug 26. Eur Radiol. 2021. PMID: 32851443
-
Decreasing brain iron in multiple sclerosis: The difference between concentration and content in iron MRI.Hum Brain Mapp. 2021 Apr 1;42(5):1463-1474. doi: 10.1002/hbm.25306. Epub 2020 Dec 30. Hum Brain Mapp. 2021. PMID: 33378095 Free PMC article.
-
Quantitative susceptibility mapping for iron monitoring of multiple subcortical nuclei in type 2 diabetes mellitus: a systematic review and meta-analysis.Front Endocrinol (Lausanne). 2024 Mar 6;15:1331831. doi: 10.3389/fendo.2024.1331831. eCollection 2024. Front Endocrinol (Lausanne). 2024. PMID: 38510699 Free PMC article.
-
Iron in Multiple Sclerosis and Its Noninvasive Imaging with Quantitative Susceptibility Mapping.Int J Mol Sci. 2016 Jan 14;17(1):100. doi: 10.3390/ijms17010100. Int J Mol Sci. 2016. PMID: 26784172 Free PMC article. Review.
Cited by
-
Quantitative susceptibility mapping of brain iron in healthy aging and cognition.Neuroimage. 2023 Nov 15;282:120401. doi: 10.1016/j.neuroimage.2023.120401. Epub 2023 Oct 5. Neuroimage. 2023. PMID: 37802405 Free PMC article. Review.
-
CSF Markers of Oxidative Stress Are Associated with Brain Atrophy and Iron Accumulation in a 2-Year Longitudinal Cohort of Early MS.Int J Mol Sci. 2023 Jun 12;24(12):10048. doi: 10.3390/ijms241210048. Int J Mol Sci. 2023. PMID: 37373196 Free PMC article.
-
Association between paramagnetic rim lesions and pulvinar iron depletion in persons with multiple sclerosis.Mult Scler Relat Disord. 2025 Jan;93:106187. doi: 10.1016/j.msard.2024.106187. Epub 2024 Nov 24. Mult Scler Relat Disord. 2025. PMID: 39644585 Free PMC article.
-
IRONMAP: Iron network mapping and analysis protocol for detecting over-time brain iron abnormalities in neurological disease.Imaging Neurosci (Camb). 2025 Apr 15;3:imag_a_00528. doi: 10.1162/imag_a_00528. eCollection 2025. Imaging Neurosci (Camb). 2025. PMID: 40800826 Free PMC article.
References
-
- Alkemade A, Mulder MJ, Groot JM, Isaacs BR, van Berendonk N, Lute N, Isherwood SJ, Bazin P-L, Forstmann BU, 2020. The Amsterdam Ultra-high field adult lifespan database (AHEAD): A freely available multimodal 7 Tesla submillimeter magnetic resonance imaging database. NeuroImage 221, 117200. 10.1016/j.neuroimage.2020.117200 - DOI - PubMed
Publication types
MeSH terms
Substances
Grants and funding
LinkOut - more resources
Full Text Sources
Medical
Miscellaneous
