

The first Japanese biobank of patient-derived pediatric acute lymphoblastic leukemia xenograft models
- PMID: 35879192
- PMCID: PMC9633318
- DOI: 10.1111/cas.15506
The first Japanese biobank of patient-derived pediatric acute lymphoblastic leukemia xenograft models
Abstract
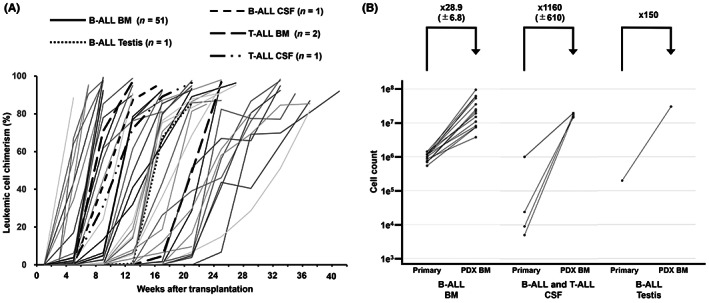
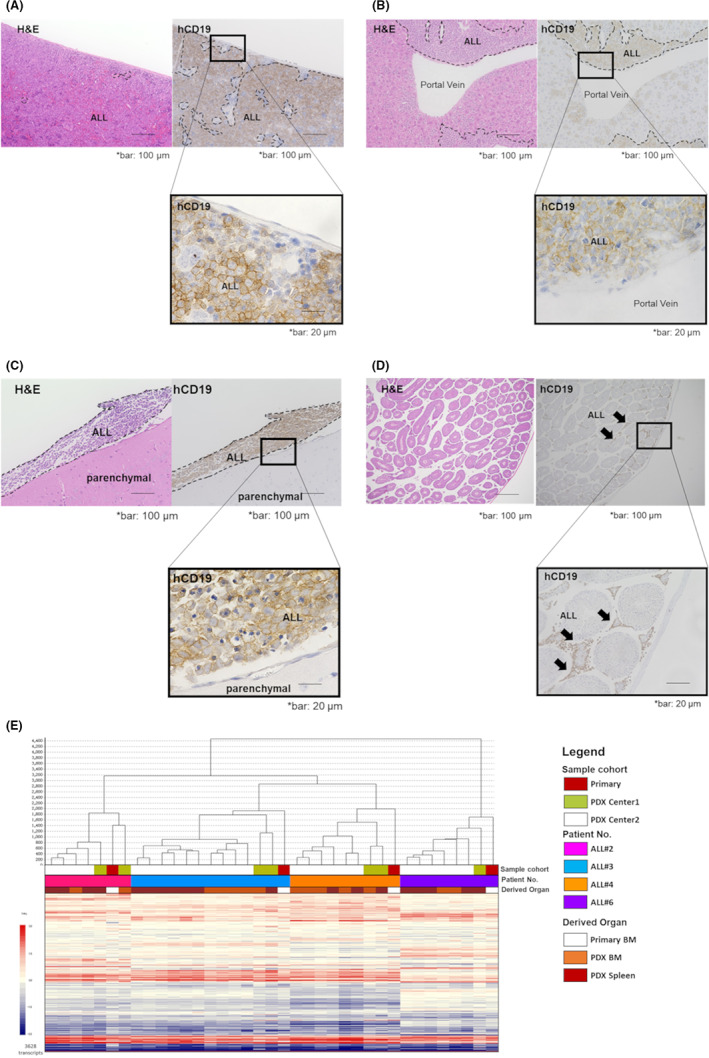
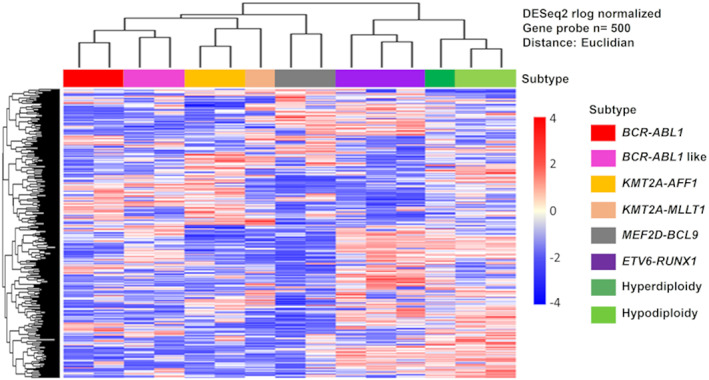
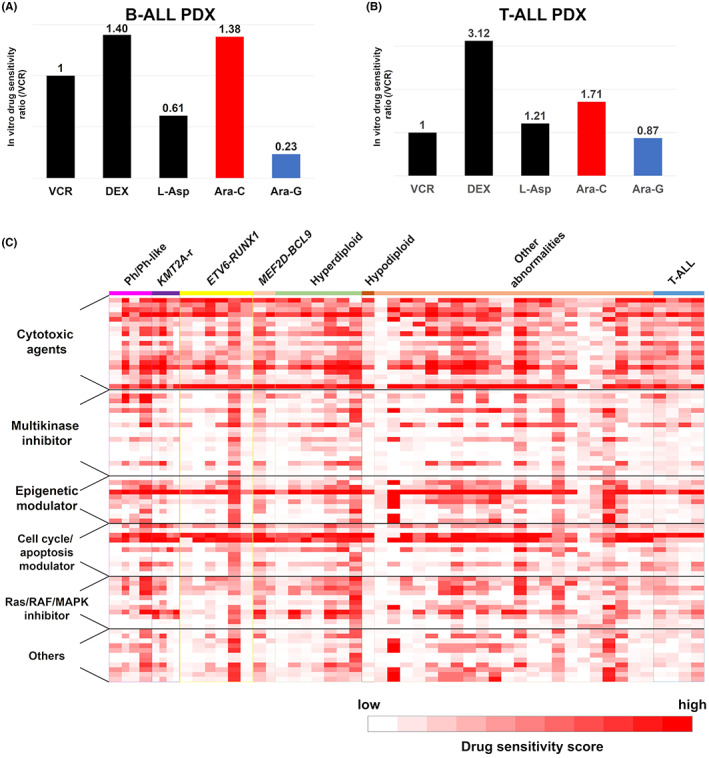
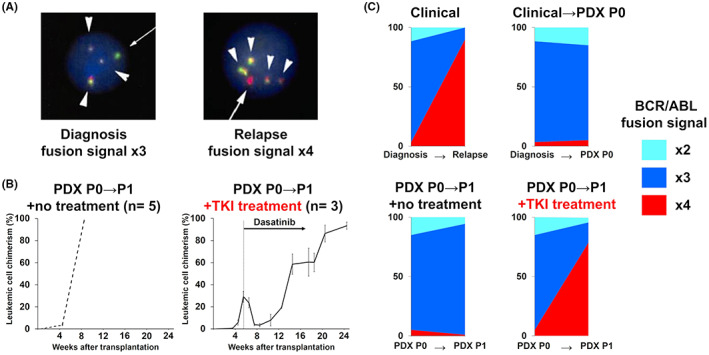
A lack of practical resources in Japan has limited preclinical discovery and testing of therapies for pediatric relapsed and refractory acute lymphoblastic leukemia (ALL), which has poor outcomes. Here, we established 57 patient-derived xenografts (PDXs) in NOD.Cg-Prkdcscid ll2rgtm1Sug /ShiJic (NOG) mice and created a biobank by preserving PDX cells including three extramedullary relapsed ALL PDXs. We demonstrated that our PDX mice and PDX cells mimicked the biological features of relapsed ALL and that PDX models reproduced treatment-mediated clonal selection. Our PDX biobank is a useful scientific resource for capturing drug sensitivity features of pediatric patients with ALL, providing an essential tool for the development of targeted therapies.
Keywords: biobank; leukemia; pediatric; preclinical; xenograft.
© 2022 The Authors. Cancer Science published by John Wiley & Sons Australia, Ltd on behalf of Japanese Cancer Association.
Figures
Similar articles
-
In vivo activity of the dual PI3Kδ and PI3Kγ inhibitor duvelisib against pediatric acute lymphoblastic leukemia xenografts.Pediatr Blood Cancer. 2023 Aug;70(8):e30398. doi: 10.1002/pbc.30398. Epub 2023 May 4. Pediatr Blood Cancer. 2023. PMID: 37140091
-
Optimization of a clofarabine-based drug combination regimen for the preclinical evaluation of pediatric acute lymphoblastic leukemia.Pediatr Blood Cancer. 2020 Apr;67(4):e28133. doi: 10.1002/pbc.28133. Epub 2019 Dec 25. Pediatr Blood Cancer. 2020. PMID: 31876116
-
Establishment and characterization of a non-gestational choriocarcinoma patient-derived xenograft model.BMC Cancer. 2023 Nov 13;23(1):1103. doi: 10.1186/s12885-023-11626-3. BMC Cancer. 2023. PMID: 37957624 Free PMC article.
-
Application of Highly Immunocompromised Mice for the Establishment of Patient-Derived Xenograft (PDX) Models.Cells. 2019 Aug 13;8(8):889. doi: 10.3390/cells8080889. Cells. 2019. PMID: 31412684 Free PMC article. Review.
-
[Knowledge and practice of patient-derived xenograft models in leukemia].Rinsho Ketsueki. 2022;63(9):1335-1343. doi: 10.11406/rinketsu.63.1335. Rinsho Ketsueki. 2022. PMID: 36198560 Review. Japanese.
Cited by
-
PRC2-mediated apoptosis evasion is a therapeutic target of MDS/AML harboring inv(3)/t(3;3) and monosomy 7.Hemasphere. 2025 Jul 13;9(7):e70149. doi: 10.1002/hem3.70149. eCollection 2025 Jul. Hemasphere. 2025. PMID: 40657304 Free PMC article.
-
Modeling the Tumor Microenvironment and Cancer Immunotherapy in Next-Generation Humanized Mice.Cancers (Basel). 2023 May 30;15(11):2989. doi: 10.3390/cancers15112989. Cancers (Basel). 2023. PMID: 37296949 Free PMC article. Review.
-
Patient-derived xenograft models in cancer therapy: technologies and applications.Signal Transduct Target Ther. 2023 Apr 12;8(1):160. doi: 10.1038/s41392-023-01419-2. Signal Transduct Target Ther. 2023. PMID: 37045827 Free PMC article. Review.
-
[Optimized treatment of childhood B-lineage acute lymphoblastic leukemia].Zhongguo Dang Dai Er Ke Za Zhi. 2023 Apr 15;25(4):344-349. doi: 10.7499/j.issn.1008-8830.2211041. Zhongguo Dang Dai Er Ke Za Zhi. 2023. PMID: 37073837 Free PMC article. Chinese.
-
Orthotopic and metastatic tumour models in preclinical cancer research.Pharmacol Ther. 2024 May;257:108631. doi: 10.1016/j.pharmthera.2024.108631. Epub 2024 Mar 11. Pharmacol Ther. 2024. PMID: 38467308 Free PMC article. Review.
References
-
- Pui CH, Sandlund JT, Pei D, et al. Improved outcome for children with acute lymphoblastic leukemia: results of Total therapy study XIIIB at St Jude Children's research hospital. Blood. 2004;104(9):2690‐2696. - PubMed
-
- Gao H, Korn JM, Ferretti S, et al. High‐throughput screening using patient‐derived tumor xenografts to predict clinical trial drug response. Nat Med. 2015;21(11):1318‐1325. - PubMed
-
- Izumchenko E, Meir J, Bedi A, Wysocki PT, Hoque MO, Sidransky D. Patient‐derived xenografts as tools in pharmaceutical development. Clin Pharmacol Ther. 2016;99(6):612‐621. - PubMed
-
- Jones L, Carol H, Evans K, et al. A review of new agents evaluated against pediatric acute lymphoblastic leukemia by the pediatric preclinical testing program. Leukemia. 2016;30(11):2133‐2141. - PubMed
