Effects of Sodium/Glucose Cotransporter 2 (SGLT2) Inhibitors on Cardiac Imaging Parameters: A Systematic Review and Meta-analysis of Randomized Controlled Trials
- PMID: 35879251
- PMCID: PMC9314220
- DOI: 10.4250/jcvi.2021.0159
Effects of Sodium/Glucose Cotransporter 2 (SGLT2) Inhibitors on Cardiac Imaging Parameters: A Systematic Review and Meta-analysis of Randomized Controlled Trials
Abstract
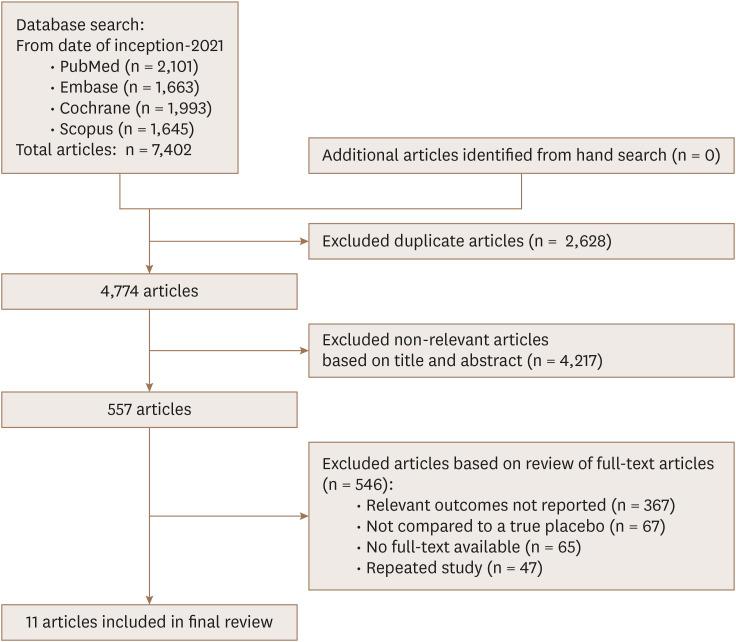
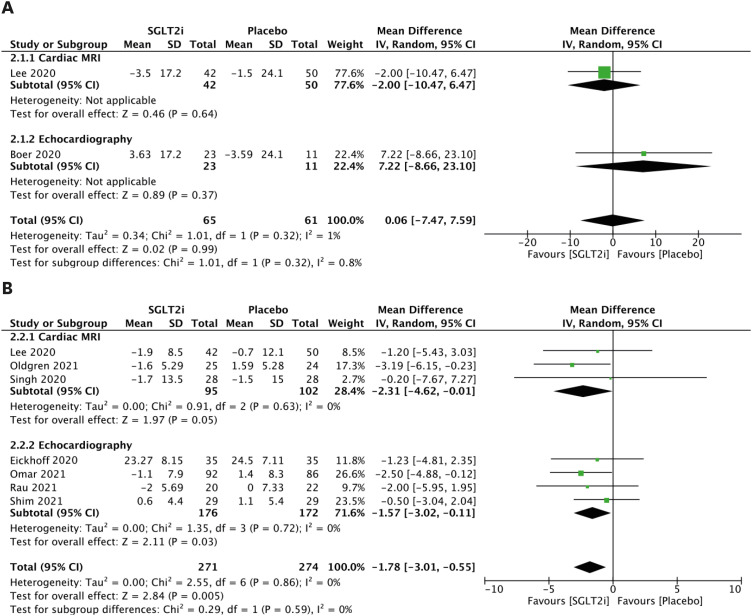
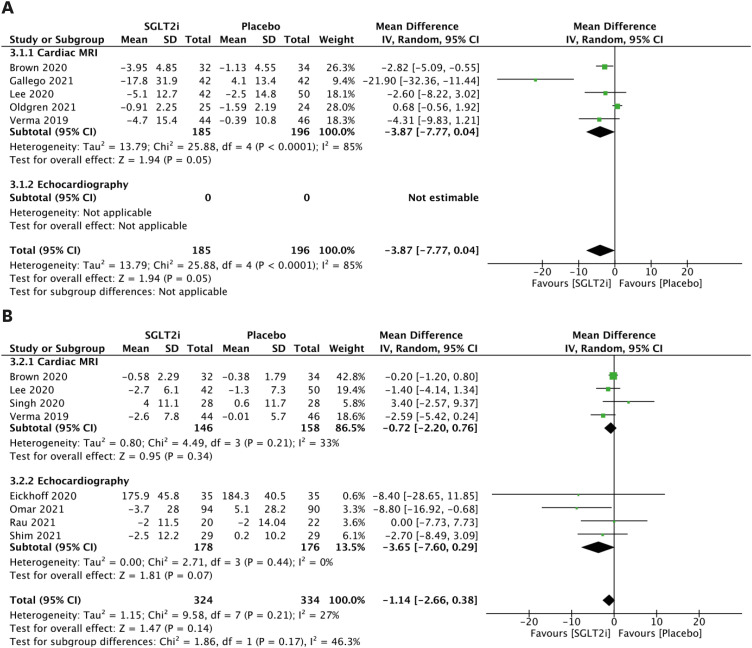
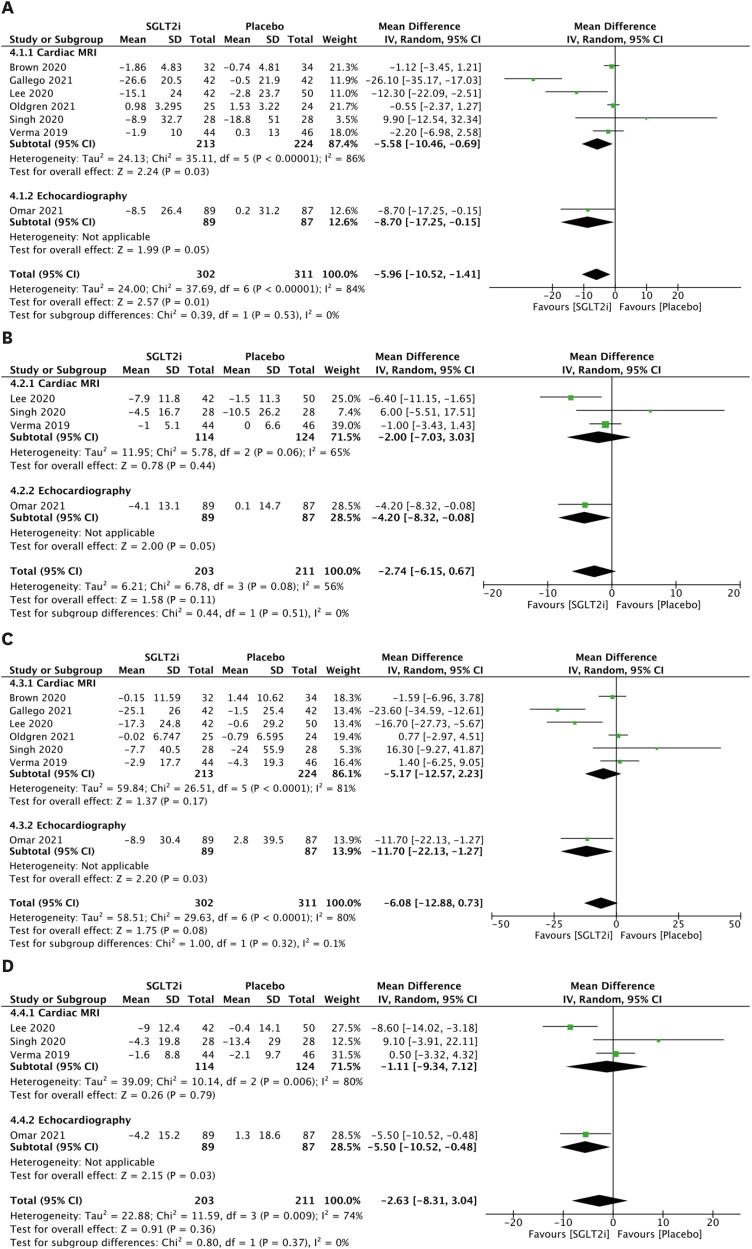
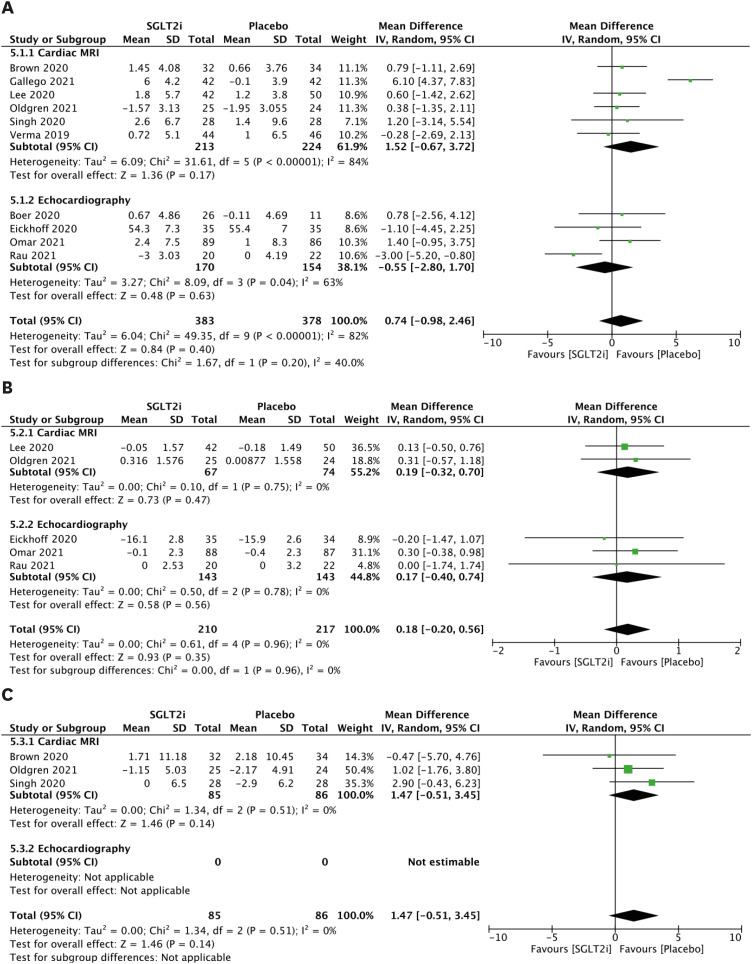
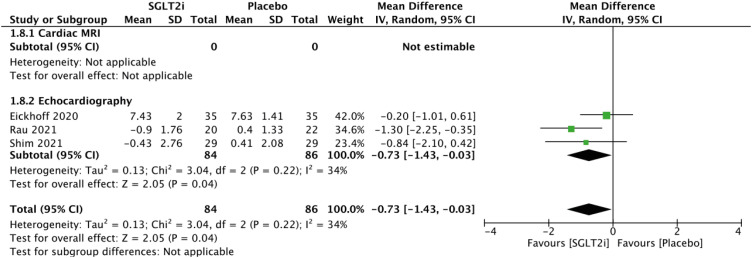
Recent studies have shown that sodium/glucose cotransporter 2 (SGLT2) inhibitors might exert favourable changes on cardiac parameters as observed on cardiovascular imaging. We conducted a systematic review and meta-analysis to determine the effects of SGLT2 inhibitors on cardiac imaging parameters. Four electronic databases (PubMed, Embase, Cochrane, Scopus) were searched for studies in which the effects of SGLT2 inhibitors on cardiac imaging parameters were examined. Studies in which a population was administered SGLT2 inhibitors and analysed by echocardiography and/or cardiac magnetic resonance (CMR) imaging were included. Random-effects pair-wise meta-analysis models were utilized to summarize the studies. A total of 11 randomized controlled trials was included with a combined cohort of 910 patients. Comparing patients receiving SGLT2 inhibitors with subjects receiving placebo, the mean change in CMR-measured left ventricular mass (LVM) was -3.87 g (95% confidence interval [CI], -7.77 to 0.04), that in left ventricular end-systolic volume (LVESV) was -5.96 mL (95% CI, -10.52 to -1.41) for combined LVESV outcomes, that in left atrial volume index (LAVi) was -1.78 mL/m² (95% CI, -3.01 to -0.55) for combined LAVi outcomes, and that in echocardiography-measured E/e' was -0.73 (95% CI, -1.43 to -0.03). Between-group differences were not observed in LVM and LVESV after indexation. The only between-group difference that persisted was for LAVi. Treatment with SGLT2 inhibitors resulted in reduction in LAVi and E/e' on imaging, indicating they might have an effect on outcomes associated with LV diastolic function.
Keywords: Echocardiography; Heart failure; Magnetic resonance imaging; Pharmacology.
Copyright © 2022 Korean Society of Echocardiography.
Conflict of interest statement
The authors have no financial conflicts of interest.
Figures
References
-
- Blankstein R. Cardiology patient page. Introduction to noninvasive cardiac imaging. Circulation. 2012;125:e267–e271. - PubMed
-
- Cavalcante JL, Lalude OO, Schoenhagen P, Lerakis S. Cardiovascular magnetic resonance imaging for structural and valvular heart disease interventions. JACC Cardiovasc Interv. 2016;9:399–425. - PubMed
-
- Shibayama K, Watanabe H. Clinical use of echocardiography in structural heart disease. Gen Thorac Cardiovasc Surg. 2016;64:365–372. - PubMed
-
- Zinman B, Wanner C, Lachin JM, et al. Empagliflozin, cardiovascular outcomes, and mortality in type 2 diabetes. N Engl J Med. 2015;373:2117–2128. - PubMed
Publication types
Grants and funding
LinkOut - more resources
Full Text Sources