. 2022 Jul 25;13(1):4275.
doi: 10.1038/s41467-022-31962-5.

Limited influence of irrigation on pre-monsoon heat stress in the Indo-Gangetic Plain

Affiliations

Limited influence of irrigation on pre-monsoon heat stress in the Indo-Gangetic Plain

Roshan Jha et al. Nat Commun. .

Abstract

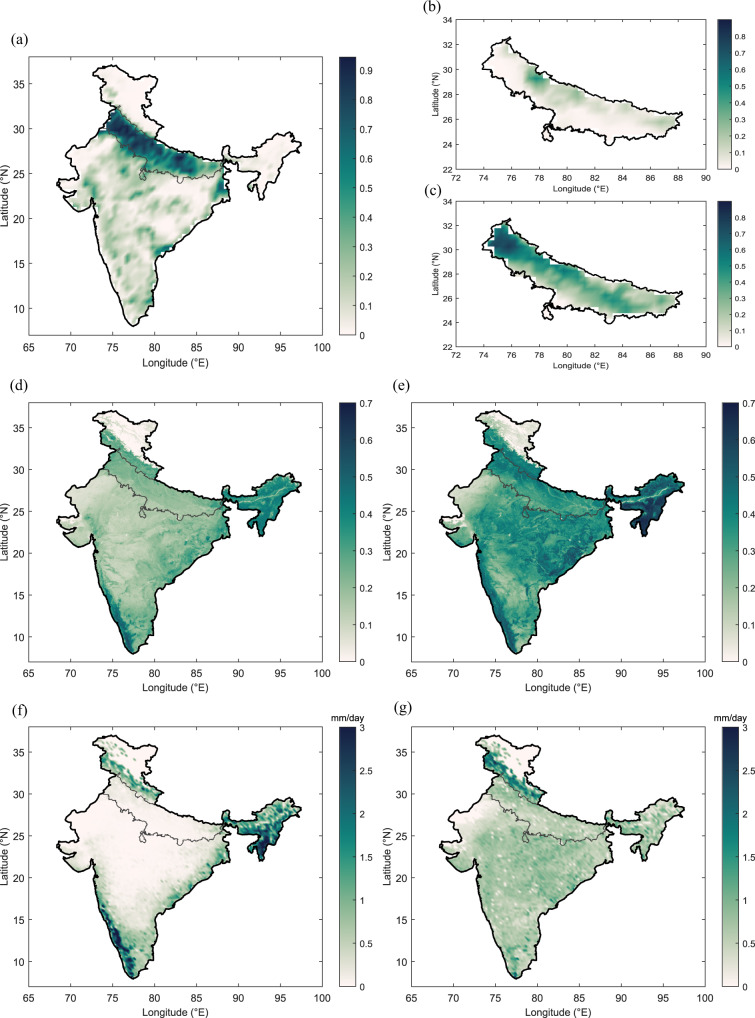
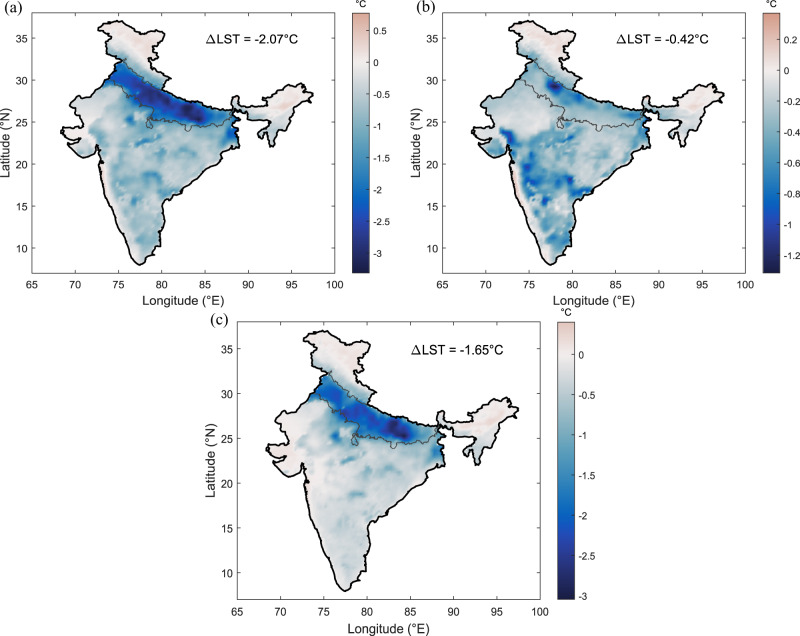
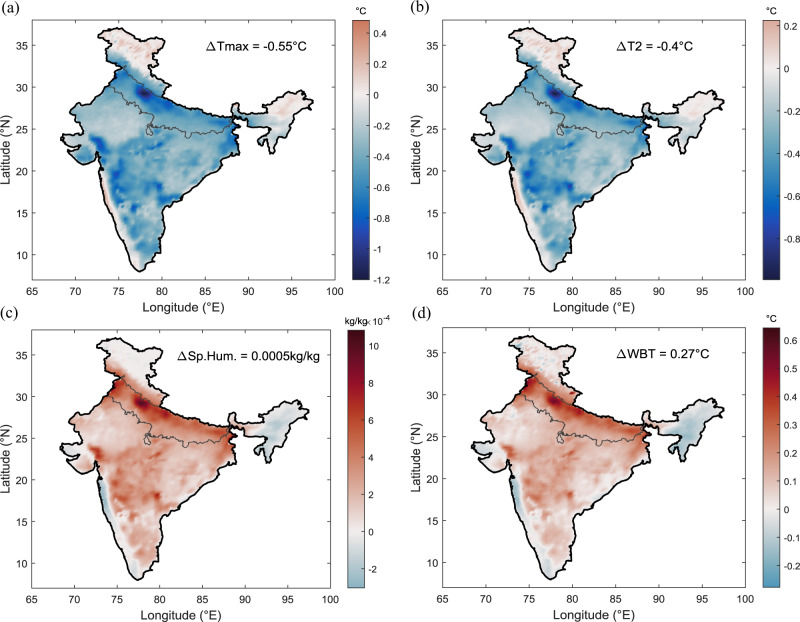
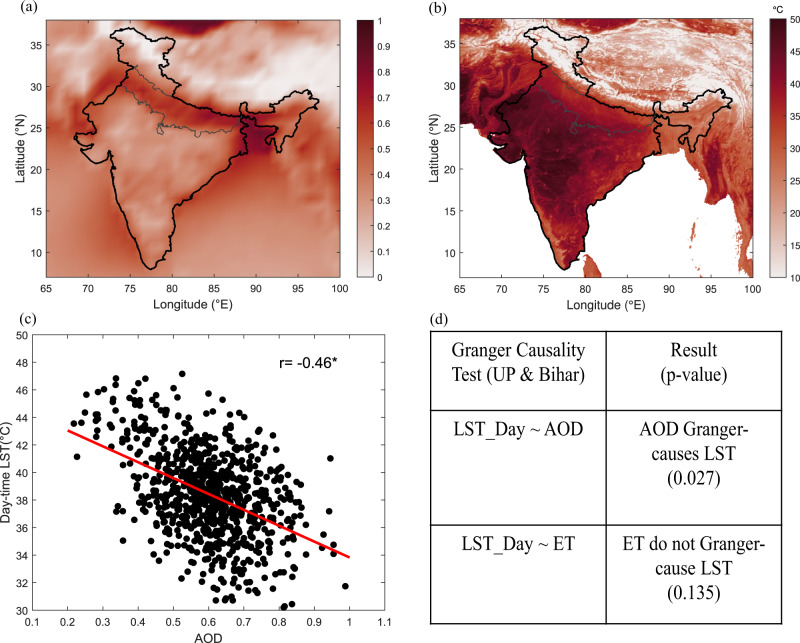
Hot extremes are anticipated to be more frequent and more intense under climate change, making the Indo-Gangetic Plain of India, with a 400 million population, vulnerable to heat stress. Recent studies suggest that irrigation has significant cooling and moistening effects over this region. While large-scale irrigation is prevalent in the Indo-Gangetic Plain during the two major cropping seasons, Kharif (Jun-Sep) and Rabi (Nov-Feb), hot extremes are reported in the pre-monsoon months (Apr-May) when irrigation activities are minimal. Here, using observed irrigation data and regional climate model simulations, we show that irrigation effects on heat stress during pre-monsoon are 4.9 times overestimated with model-simulated irrigation as prescribed in previous studies. We find that irrigation increases relative humidity by only 2.5%, indicating that irrigation is a non-crucial factor enhancing the moist heat stress. On the other hand, we detect causal effects of aerosol abundance on the daytime land surface temperature. Our study highlights the need to consider actual irrigation data in testing model-driven hypotheses related to the land-atmosphere feedback driven by human water management.


Conflict of interest statement

The authors declare no competing interests.

Figures

Fig. 1
Fig. 1. Comparison of pre-monsoon (April–May) and monsoon (June–September) in India.
a FAO annual irrigation fraction over India; Mean (2004–2016) fraction of grid cell under irrigation including paddy and non-paddy crop from agricultural census-based data during b Pre-monsoon c Monsoon; Mean EVI for the period 2001–2020 from moderate resolution imaging spectroradiometer (MODIS) for d pre-monsoon e monsoon; Mean ET (mm/day) for the period 2001–2020 from MODIS for f pre-monsoon g monsoon.
Fig. 2
Fig. 2. Influence of model-estimated and agricultural census-based irrigation volume on land surface temperature (LST).
Mean (2004–2016) difference in land surface temperature (°C) between different experiments. a Influence of model-estimated Irrigation (MOD—CTL). b Influence of agricultural census irrigation (AGR—CTL). c Magnitude of overestimation of irrigation feedback (MOD—AGR). The mean difference spatially averaged over Indo-Gangetic Plain is shown as ΔLST. CTL represents WRF-CLM4 simulation with no irrigation, AGR represents WRF-CLM4 simulation with agricultural census-based irrigation data and MOD represents WRF-CLM4 simulation with model-estimated irrigation data.
Fig. 3
Fig. 3. Influence of agricultural census-based irrigation on air temperature, specific humidity, and wet-bulb temperature (Tw).
Difference between AGR and CTL experiment during pre-monsoon season (April–May) for the period 2004–2016 for a Daily maximum temperature (°C). b Daily mean temperature (°C). c Specific humidity (kg/kg). d Wet-bulb temperature (°C). CTL represents WRF-CLM4 simulation with no irrigation and AGR represents WRF-CLM4 simulation with agricultural census-based irrigation data.
Fig. 4
Fig. 4. Relationship between MODIS aerosol optical depth (AOD) and MODIS daytime LST (°C).
Seasonal mean (April–May) during the period 2001–2020 for a AOD, b Daytime LST, c Scatter plot with Pearson’s correlation coefficient (r) for the Indo-Gangetic Plain. d Causal relationship between variables for Uttar Pradesh (UP) and Bihar: aerosol optical depth (AOD), evapotranspiration (ET) and daytime land surface temperature (LST) from MODIS using Granger causality test in vector auto-regression model (VAR) framework. The null hypothesis for the test is that lagged Variable1 do not explain the variation in Variable2.

References

    1. Thiery W, et al. Present-day irrigation mitigates heat extremes. J. Geophys. Res. 2017;122:1403–1422. doi: 10.1002/2016JD025740. - DOI
    1. Mathur R, AchutaRao K. A modelling exploration of the sensitivity of the India’s climate to irrigation. Clim. Dyn. 2020;54:1851–1872. doi: 10.1007/s00382-019-05090-8. - DOI
    1. Thiery W, et al. Warming of hot extremes alleviated by expanding irrigation. Nat. Commun. 2020;11:1–7. doi: 10.1038/s41467-019-14075-4. - DOI - PMC - PubMed
    1. Miralles, D. G., Gentine, P., Seneviratne, S. I. & Teuling, A. J. Land-atmospheric feedbacks during droughts and heatwaves: state of the science and current challenges. Ann. N. Y. Acad. Sci. 1–17 10.1111/nyas.13912 (2018). - PMC - PubMed
    1. Kueppers LM, Snyder MA, Sloan LC. Irrigation cooling effect: Regional climate forcing by land-use change. Geophys. Res. Lett. 2007;34:1–5. doi: 10.1029/2006GL028679. - DOI

Publication types