. 2022 Jul 25;13(1):4313.
doi: 10.1038/s41467-022-31753-y.

An analysis of 45 large-scale wastewater sites in England to estimate SARS-CoV-2 community prevalence

Affiliations

An analysis of 45 large-scale wastewater sites in England to estimate SARS-CoV-2 community prevalence

Mario Morvan et al. Nat Commun. .

Abstract

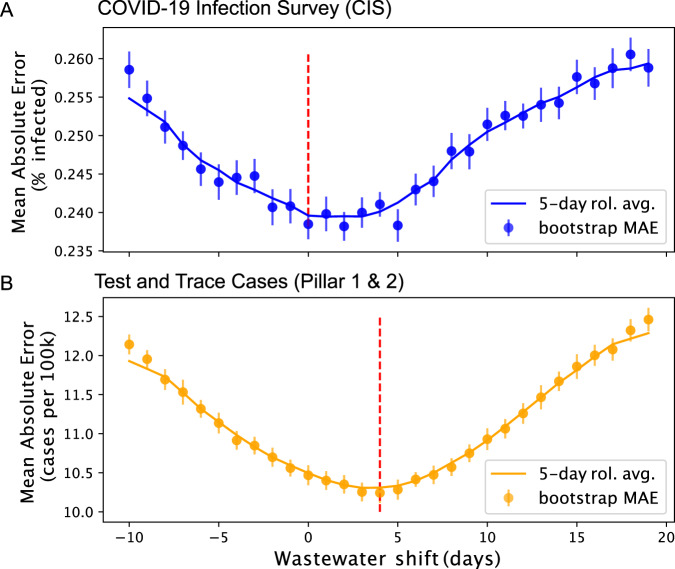
Accurate surveillance of the COVID-19 pandemic can be weakened by under-reporting of cases, particularly due to asymptomatic or pre-symptomatic infections, resulting in bias. Quantification of SARS-CoV-2 RNA in wastewater can be used to infer infection prevalence, but uncertainty in sensitivity and considerable variability has meant that accurate measurement remains elusive. Here, we use data from 45 sewage sites in England, covering 31% of the population, and estimate SARS-CoV-2 prevalence to within 1.1% of estimates from representative prevalence surveys (with 95% confidence). Using machine learning and phenomenological models, we show that differences between sampled sites, particularly the wastewater flow rate, influence prevalence estimation and require careful interpretation. We find that SARS-CoV-2 signals in wastewater appear 4-5 days earlier in comparison to clinical testing data but are coincident with prevalence surveys suggesting that wastewater surveillance can be a leading indicator for symptomatic viral infections. Surveillance for viruses in wastewater complements and strengthens clinical surveillance, with significant implications for public health.


Conflict of interest statement

The authors declare no competing interests.

Figures

Fig. 1
Fig. 1. Geographical summary of the data used to estimate SARS-CoV-2 from wastewater.
A Map of Coronavirus Infection Survey (CIS) regions (outlined in blue) and the locations of wastewater (WW) catchments used in this study (in red). B Regional 7-day rolling averages (median) of CIS prevalence estimates (black) with 95% credible intervals using Bayesian modelling (grey regions), with corresponding predictions of prevalence from WW data only (blue) with 95% confidence interval from bootstrapping (blue vertical lines), and raw SARS-CoV-2 concentrations (yellow, right axis). The WW prevalence estimates are provided at a sub-regional level and combined to produce regional estimates for comparison.
Fig. 2
Fig. 2. Comparison of the outputs from the phenomenological model to CIS prevalence estimates.
A Example fit between the phenomenological model estimates (green region) and the wastewater and prevalence data from three CIS sub-regions (blue dots), selected to illustrate three cases: sub-region (A) (good correspondence), sub-region (B) (concentrations tend to be low), and sub-region (C) (concentrations tend to be high). Model estimates of prevalence from WW data are in the same order of magnitude and follow the shape of the relationship between concentrations and prevalence using distributions of likely parameter values, but confidence intervals are wide. The combined uncertainty in parameter values exceeds the variability seen in the data. B The percentage of data points within each sub-region that fall within the 50% credible interval of the phenomenological model. C The median concentrations per positivity rate. Only CIS sub-regions that overlap with the original 44 wastewater catchment sites are shown. Sites with a poor fit to the model (yellow in sub-plot B) show either relatively low (dark blue) or relatively high (dark red) concentrations in sub-plot (C). Sites with a good fit to the model (dark green) tend to show intermediate concentrations (white).
Fig. 3
Fig. 3. Gradient boosted regression tree (GBRT) model performance across regions of England.
A Trained using SARS-CoV-2 concentration alone, and (B) including the full set of time-varying and site-specific data. Lower and upper hinges of the box plot corresponds to first and third quartile with middle line corresponding to the median. The bars indicate the 2.5th and 97.5th percentile of the values.
Fig. 4
Fig. 4. Conditional predictions of SARS-CoV-2 prevalence from WW compared to the CIS positivity estimates (“True value”) in the log10 space.
A Random effects model and (B) gradient boosted regression tree (GBRT) model. The red line indicates the diagonal where a well-fitted model would result in most predictions falling on the diagonal.
Fig. 5
Fig. 5. Lead and lag analysis of the WW data when compared to (A) CIS and (B) Test and Trace cases.
The shift (in days) associated with the minimal error is indicated by the red dotted line. A minimal error reached for a positive number of WW shifted days can be interpreted as a lead from wastewater by as many days. No clear lead of WW over CIS has been observed in this analysis, but an approximate 4 days lead over T&T has been observed. Vertical bars indicate the 95% confidence intervals of the mean absolute error across regions.

References

    1. Lancet T. COVID-19: fighting panic with information. Lancet. 2020;395:537. doi: 10.1016/S0140-6736(20)30379-2. - DOI - PMC - PubMed
    1. Franceschi VB, et al. Population-based prevalence surveys during the Covid-19 pandemic: A systematic review. Rev Med Virol. 2021;31:e2200. doi: 10.1002/rmv.2200. - DOI - PMC - PubMed
    1. Pouwels KB, et al. Community prevalence of SARS-CoV-2 in England from April to November, 2020: results from the ONS Coronavirus Infection Survey. Lancet Public Health. 2021;6:e30–e38. doi: 10.1016/S2468-2667(20)30282-6. - DOI - PMC - PubMed
    1. Noushad M, Al-Saqqaf IS. COVID-19 case fatality rates can be highly misleading in resource-poor and fragile nations: the case of Yemen. Clin. Microbiol. Infect. 2021;27:509–510. doi: 10.1016/j.cmi.2021.01.002. - DOI - PMC - PubMed
    1. Richterich, P. Severe underestimation of COVID-19 case numbers: effect of epidemic growth rate and test restrictions. Preprint at medRxiv10.1101/2020.04.13.20064220 (2020).

Publication types

LinkOut - more resources