. 2022 Jul 25;13(1):4291.
doi: 10.1038/s41467-022-32000-0.

Phenylalanine impairs insulin signaling and inhibits glucose uptake through modification of IRβ

Affiliations

Phenylalanine impairs insulin signaling and inhibits glucose uptake through modification of IRβ

Qian Zhou et al. Nat Commun. .

Abstract

Whether amino acids act on cellular insulin signaling remains unclear, given that increased circulating amino acid levels are associated with the onset of type 2 diabetes (T2D). Here, we report that phenylalanine modifies insulin receptor beta (IRβ) and inactivates insulin signaling and glucose uptake. Mice fed phenylalanine-rich chow or phenylalanine-producing aspartame or overexpressing human phenylalanyl-tRNA synthetase (hFARS) develop insulin resistance and T2D symptoms. Mechanistically, FARS phenylalanylate lysine 1057/1079 of IRβ (F-K1057/1079), inactivating IRβ and preventing insulin from promoting glucose uptake by cells. SIRT1 reverse F-K1057/1079 and counteract the insulin-inactivating effects of hFARS and phenylalanine. F-K1057/1079 and SIRT1 levels in white blood cells from T2D patients are positively and negatively correlated with T2D onset, respectively. Blocking F-K1057/1079 with phenylalaninol sensitizes insulin signaling and relieves T2D symptoms in hFARS-transgenic and db/db mice. These findings shed light on the activation of insulin signaling and T2D progression through inhibition of phenylalanylation.


Conflict of interest statement

The authors declare no competing interests.

Figures
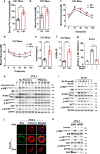
Fig. 1
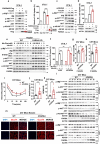
Fig. 1. Phenylalanine induces symptoms of type 2 diabetes (T2D) in mice and cells.
af Phenylalanine-supplemented chow induces T2D symptoms in mice. Male C57 mice (n = 10) were fed standard chow (SC) or phenylalanine-supplemented chow (Phe). Relative blood Phe (a), blood glucose (b), glucose tolerance (c), insulin tolerance (d), and blood insulin levels (e) and HOMA-IR values (f) were measured in fasted mice after 12 weeks of feeding. g Me-Phe treatment impairs insulin-stimulated 2-DG uptake. 2-DG Uptake by insulin-stimulated 3T3-L1 differentiated adipocytes were detected in the absence or presence of Me-Phe in the culture media (n = 5). h-i, Me-Phe treatment impairs insulin signaling. Time- (h) and dose-dependent (i) effects of Me-Phe on the phosphorylation of IR, IRS1, AKT, and AS160 in 3T3-L1 adipocytes were detected. Insulin signaling was activated before treatment to detect the inhibition of insulin signaling. j Me-Phe treatment decreases GLUT4 membrane translocation. Membrane GLUT4 levels were detected by immunofluorescence in 3T3-L1 adipocytes and insulin-stimulated 3T3-L1 adipocytes in the absence or presence of Me-Phe in the culture media. k PAH knockdown impairs insulin signaling. The effects of insulin on the phosphorylation of IR, AKT, and AS160 were detected in 3T3-L1 adipocytes and in 3T3-L1 adipocytes after PAH knockdown. Student’s t tests (unpaired, two-tailed) are applied for all statistical analyses in this figure. Values are expressed as the mean ± SEM. Significance was indicated as *p < 0.05, **p < 0.01, ***p < 0.001.
Fig. 2
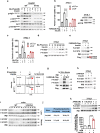
Fig. 2. FARS overexpression phenocopies phenylalanine treatment efficacy.
a FARSA/B overexpression impairs insulin signaling. Phosphorylation of insulin signaling components was detected in 3T3-L1 adipocytes and in 3T3-L1 adipocytes overexpressing both FARSA and FARSB (FARSA/B). b FARSA/B overexpression inhibits 2-DG uptake. The 2-DG uptake ability of 3T3-L1 adipocytes and 3T3-L1 adipocytes overexpressing FARSA/B was determined (n = 5). c FARSA silencing sensitizes insulin signaling. Phosphorylation of insulin signaling components was detected in 3T3-L1 adipocytes and 3T3-L1 adipocytes with FARSA knockdown using siRNA. d FARSA silencing increases 2-DG uptake by the cells. The 2-DG uptake ability of 3T3-L1 adipocytes and 3T3-L1 adipocytes with FARSA knockdown was analyzed (n = 5). e Me-Phe fails to affect insulin signaling in FARSA-knockout cells. The ability of Me-Phe to decrease the phosphorylation of insulin signaling components was tested in HepG2 cells and FARSA-knockout HepG2 cells. f FARSA silencing desensitizes phenylalanine to decrease 2-DG uptake. The ability of phenylalanine to inhibit 2-DG uptake was compared between 3T3-L1 adipocytes and FARSA knockdown 3T3-L1 adipocytes (n = 5). gk hFARSA overexpression induces T2D symptoms in mice. Blood glucose at 4 weeks (g) and 8 weeks (h), insulin tolerance (i), and blood insulin levels (j) and HOMA-IR values (k) in fasted 8-week-old hFARSA-transgenic C57 mice were measured (WT, n = 9, hFARSA-transgenic, n = 10 mice). l hFARSA overexpression inhibits insulin signaling. Phosphorylation of components of the insulin signaling pathway was detected in the adipose, muscle, and liver tissues of C57 and hFARSA-transgenic C57 mice. m hFARSA overexpression blunts GLUT4 membrane translocation stimulated by insulin. The distribution of GLUT4 in the muscle tissues of C57 and hFARSA-transgenic C57 mice was detected after the same dose of insulin was injected. Significance was indicated as two-tailed, unpaired, t test for (b, d, gk), one-way ANOVA test for (f). Values are expressed as the mean ± SEM. *p < 0.05, **p < 0.01, ***p < 0.001.
Fig. 3
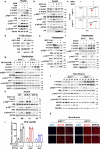
Fig. 3. FARS phenylalanylates IR Lys1057/1079.
a Me-Phe has negligible effects on insulin signaling in IR-KO HepG2 cells. Phosphorylation of the components of the insulin signaling pathway was detected in HepG2 and IR-KO HepG2 cells in the absence and presence of Me-Phe. b FARSA/B overexpression has no effect on 2-DG uptake in IR-silenced 3T3-L1 adipocytes. 2-DG uptake was detected in 3T3-L1 adipocytes and IR-silenced 3T3-L1 adipocytes (n = 5). c Me-Phe fails to inhibit 2-DG uptake in IR-silenced 3T3-L1 adipocytes. 2-DG uptake was detected in WT and IR-silenced 3T3-L1 adipocytes in the absence and presence of Me-Phe (n = 5). d Me-Phe increases F-K1057/1079 levels. The levels of F-K1057/1079 were detected in 3T3-L1 adipocytes at the indicated time points after the cells were treated with Me-Phe. e FARSA/B overexpression increases F-K1057/1079 levels. F-K1057/1079 levels were detected in 3T3-L1 adipocytes and in 3T3-L1 adipocytes overexpressing FARSA/B. f FARSA/B phenylalanylates IR K1057 and K1079 peptides. The ability of recombinant FARSA/B and FARSAY412R/F438R/B to phenylalanylate K1057-and K1079-containing IR peptides in vitro was tested. The formation of phenylalanylated products (red arrows) was assayed by mass spectrometry. g FARSA/B phenylalanylates IRβ. The abilities of recombinant FARSA/B and FARSAY412R/F438R/B to phenylalanylate recombinant IR were tested. The formation of F-K1057/1079 was detected using western blotting. h FARSA knockdown reduces F-K1057/1079 levels. F-K1057/1079 levels were detected in 3T3-L1 adipocytes and FARSA-knockdown 3T3-L1 adipocytes. i hFARSA overexpression increases F-K1057/1079 levels. The levels of F-K1057/1079 were detected in the liver and muscle tissues of C57 and hFARSA-transgenic C57 mice. j Phenylalanine treatment increases F-K1057/1079 levels. The levels of F-K1057/1079 were quantified in 3T3-L1 adipocytes that were untreated or treated with phenylalanine. k Aspartame increases F-K1057/1079 levels. The levels of F-K1057/1079 were detected in 3T3-L1 adipocytes at the indicated doses after the cells were treated with aspartame (APM). Significance was indicated as two-tailed, unpaired, t test for (k), one-way ANOVA test for (b, c). Values are expressed as the mean ± SEM. *p < 0.05, **p < 0.01, ***p < 0.001.
Fig. 4
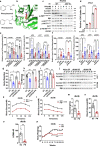
Fig. 4. Abrogating IR K1057/1079 phenylalanylation prevents phenylalanine and FARS from inhibiting insulin signaling.
a, b K1057/1079 phenylalanylation determines cell responses to insulin stimulation. The phosphorylation levels of components of the insulin signaling pathway were detected in HepG2 cells and HepG2 cells with either IRβ K1057, K1079, or both, and switched to non-phenylalanylation memetic arginine (a) or phenylalanylation memetic phenylalanine (b) with CRISPR-Cas9 in the absence and presence of insulin. c, d K1057/1079 phenylalanylation inactivates IRβ and inhibits glucose uptake. The effects of insulin on the phosphorylation levels of the components of the insulin signaling pathway (c) and 2-DG uptake (n = 5) (d) were detected in IR knockdown 3T3-L1 adipocytes with IRβ, IRβ2K/R, and IRβ2K/F expressed at comparable levels. e, f Absence of K1057/K1079 abrogates Me-Phe to alter insulin signaling and glucose uptake. The responses of insulin signaling (e) and 2-DG uptake (n = 5) (f) to Me-Phe treatment were detected in IR knockdown 3T3-L1 adipocytes treated with IRβ, IRβ2K/R, and IRβ2K/F expressed at comparable levels. g, h FARS overexpression fails to inhibit insulin signaling and glucose uptake when K1057/K1079 is absent in 3T3-L1 cells. The responses of insulin signaling (g) and 2-DG uptake (n = 5) (h) to FARSA/B overexpression were detected in IR knockdown 3T3-L1 adipocytes expressing IRβ, IRβ2K/R, and IRβ2K/F, respectively. One-way ANOVA are applied for all statistical analyses in this figure. Values are expressed as the mean ± SEM. Significance was indicated as *p < 0.05, **p < 0.01, ***p < 0.001.
Fig. 5
Fig. 5. SIRT1 dephenylalanylates K1057/1079 phenylalanylation and sensitizes insulin signaling.
a Sirtuin inhibition elevates F-K1057 and F-K1079 levels and inactivates insulin signaling. F-K1057/1079 levels and phosphorylation of components of insulin signaling were detected in HepG2 cells that were untreated and treated with NAM (5 mM) and TSA (0.5 μM). b SIRT1 decreases F-K1057/1079 levels and activates insulin signaling. F-K1057/1079 levels and phosphorylation of components of insulin signaling were detected in HepG2 cells and HepG2 cells overexpressing SIRT1, SIRT2, SIRT6, and SIRT 7, respectively. c SIRT1 removes F-K1057 and F-K1079 in vitro. Recombinant SIRT1 was incubated with synthetic F-K1057- and F-K1079-containing IRβ peptides in deacetylation buffer and the resulting peptides were analyzed by MS. d SIRT1 dephenylalanylates intact IRβ via deacetylase activity. Recombinant SIRT1 and deacetylase-inactivated SIRT1H363Y were incubated with IRβ in deacetylation buffer, and the levels of F-K1057/1079 were detected. e SIRT1 overexpression decreases F-K1057/1079 levels and activates insulin signaling. F-K1057/1079 levels and phosphorylation levels of components of the insulin signaling pathway were detected in mouse primary hepatocytes and mouse primary hepatocytes overexpressing SIRT1. f SIRT1 inhibitor fails to alter F-K1057/1079 levels and insulin signaling in Sirt1-/- mouse primary hepatocytes. Effects of EX527 (10 μM) on F-K1057/1079 levels and phosphorylation levels of components of the insulin signaling pathway were detected in wild-type and Sirt1-/- C57 mouse primary hepatocytes. g SIRT1+/+ and SIRT1-/- mouse hepatocytes (F-K1057/1079) respond differently to phenylalanine. F-K1057/1079 levels and insulin-stimulated insulin signaling responses to phenylalanine were detected in SIRT1+/+ and SIRT1-/- mouse primary hepatocytes. h, i Absence of K1057/1079 abrogates SIRT1-mediated activation of insulin signaling and 2-DG uptake. The ability of SIRT1 overexpression to activate insulin signaling (h) in wild-type, IRβ2K/R, and IRβ2K/F knock-in HepG2 cells, and 2-DG uptake (n = 5) (i) in IR knockdown 3T3-L1 adipocytes expressing IRβ, IRβ2K/R, and IRβ2K/F was assessed. Significance was indicated as one-way ANOVA. Values are expressed as the mean ± SEM. *p < 0.05, **p < 0.01, ***p < 0.001. j Sirt1 knockout increases F-K1057/1079 levels and impairs insulin signaling. F-K1057/1079 levels and phosphorylation of components of insulin signaling were detected in the muscles of wild-type and Sirt1-/- mice. k Sirt1 knockout decreases membrane enrichment of GLUT4. Cellular GLUT4 distribution was detected by immunofluorescence in the muscles of wild-type and Sirt1-/- mice.
Fig. 6
Fig. 6. Elevation of F-K1057/1079 levels in patients with T2D.
a Phenylalanine levels are elevated in plasma samples from patients with T2D. Phenylalanine levels were measured in plasma samples from patients with T2D (n = 62, red spots, hereafter in this figure) and matched control samples (n = 60, black spots, hereafter in this figure). b Phenylalanine levels are positively associated with HbA1c levels in plasma samples from patients with T2D. Phenylalanine levels in patients with T2D and healthy subjects were plotted against their corresponding HbA1c levels. c F-K1057/1079 levels and insulin signaling are inversely regulated in human WBCs. F-K1057/1079 levels and insulin signaling were detected in human WBCs treated with the indicated levels of phenylalanine in the culture media. d Phe-fed mice have higher F-K1057/1079 levels and lower insulin signaling. F-K1057/1079 levels and insulin signals were detected in Phe-fed and normal chow-fed mice (n = 6). eh F-K1057/1079 levels are correlated with T2D. F-K1057 (e) and F-K1079 levels (f) were compared between patients with T2D and matched control samples, and F-K1057 (g) and F-K1079 levels (h) were plotted against their corresponding HbA1c levels. i, j SIRT1 protein levels are low in patients with T2D. SIRT1 levels in patients with T2D and healthy subjects were measured (i) and their values were plotted against their corresponding HbA1c levels (j). k, l FARSA protein levels are negligibly altered in patients with T2D. The FARSA levels of patients with T2D and healthy subjects were measured (k), and their values were plotted against their corresponding HbA1c levels (l). Student’s t tests (unpaired, two-tailed) are applied for all statistical analyses in this figure. Values are expressed as the mean ± SEM. Significance was indicated as *p < 0.05, **p < 0.01, ***p < 0.001.
Fig. 7
Fig. 7. Decreasing F-K1057/1079 restores insulin signaling.
a Phenylalaninol is structurally analogous to phenylalanine. The molecular formulae of phenylalanine and phenylalaninol are shown. b Phenylalaninol and phenylalanine may occupy the same binding site of FARSA. Computer simulations show that phenylalaninol fits the phenylalanine binding site of FARSA. c Phenylalaninol decreases F-K1057/1079 levels and activates insulin signaling. The F-K1057/1079 levels of IRβ and phosphorylation levels of components of insulin signaling were detected in HepG2 cells and IRβ2K/F knock-in HepG2 cells in the presence of different levels of phenylalaninol. d Phenylalaninol activates glucose uptake. The 2-DG uptake of 3T3-L1 cells and insulin-stimulated 3T3-L1 cells was measured in the absence and presence of 2 mM phenylalaninol (n = 5). e, f Phenylalaninol decreases F-K1057/1079 levels and activates insulin signaling in hFARSA-transgenic and aspartame-fed mice. The liver F-K1057/1079 levels (left) and insulin signaling were quantified for male wild-type and hFARSA-transgenic mice that were fed with standard and phenylalaninol-supplemented chow (e) and for male wild-type mice that were fed with standard, aspartame-supplemented, and chow supplemented with both aspartame and phenylalaninol (f). All values were normalized to those of wild-type mice fed standard chow (n = 9). gi Phenylalaninol chow relieves diabetic symptoms in hFARSA-transgenic mice. Male wild-type and hFARSA-transgenic C57 mice were fed standard or phenylalaninol-supplemented chow for 12 weeks (n = 9). Body weight (g), fat mass (h), and fasting blood glucose level (i) were measured. jp Phenylalaninol decreases F-K1057/1079 levels and relieves diabetic symptoms in db/db mice. Male db/db mice were fed standard or phenylalaninol-supplemented chow for 12 weeks (n = 10). The F-K1057/1079 levels in mouse liver and muscle tissues (j), glucose tolerance (k), insulin tolerance (l), blood insulin (m), blood glucose levels (n), HOMA-IR values (o), and body weights (p) were measured. Significance was indicated as two-tailed, unpaired, t test for (d), (kp), one-way ANOVA test for (ei). Values are expressed as the mean ± SEM. *p < 0.05, **p < 0.01, ***p < 0.001.

Similar articles

Cited by

References

    1. Saltiel, A. R. Insulin signaling in health and disease. J. Clin. Invest.131, e142241 (2021). - PMC - PubMed
    1. Van Obberghen E, et al. Surfing the insulin signaling web. Eur. J. Clin. Invest. 2001;31:966–977. doi: 10.1046/j.1365-2362.2001.00896.x. - DOI - PubMed
    1. Lizcano JM, Alessi DR. The insulin signalling pathway. Curr. Biol. 2002;12:R236–R238. doi: 10.1016/S0960-9822(02)00777-7. - DOI - PubMed
    1. Rowland AF, Fazakerley DJ, James DE. Mapping insulin/GLUT4 circuitry. Traffic. 2011;12:672–681. doi: 10.1111/j.1600-0854.2011.01178.x. - DOI - PubMed
    1. Frojdo S, Vidal H, Pirola L. Alterations of insulin signaling in type 2 diabetes: A review of the current evidence from humans. Bba-Mol. Basis Dis. 2009;1792:83–92. doi: 10.1016/j.bbadis.2008.10.019. - DOI - PubMed

Publication types