. 2022 Jul 25;13(1):4298.
doi: 10.1038/s41467-022-31941-w.

Lymphatic-preserving treatment sequencing with immune checkpoint inhibition unleashes cDC1-dependent antitumor immunity in HNSCC

Affiliations

Lymphatic-preserving treatment sequencing with immune checkpoint inhibition unleashes cDC1-dependent antitumor immunity in HNSCC

Robert Saddawi-Konefka et al. Nat Commun. .

Abstract

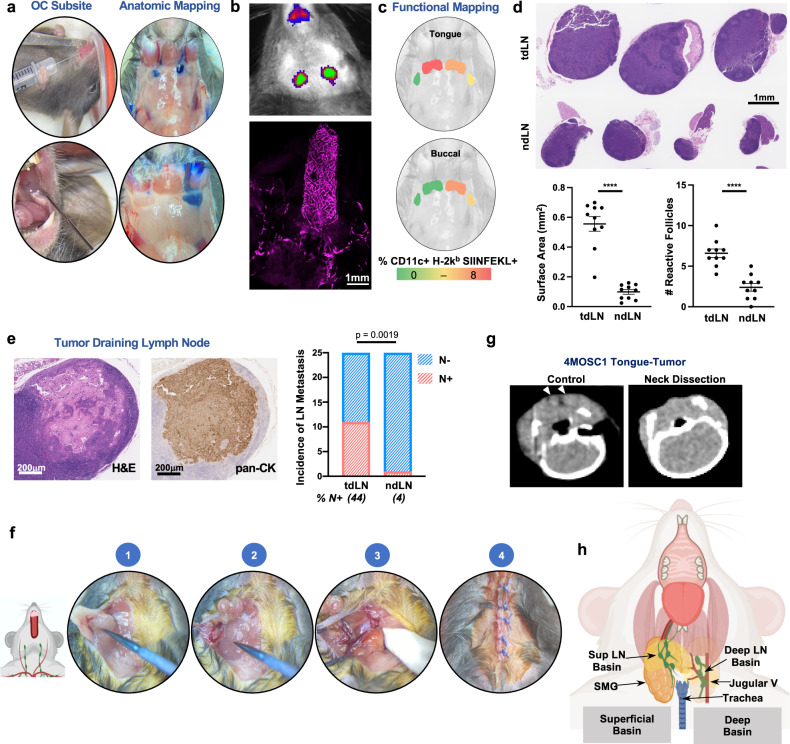
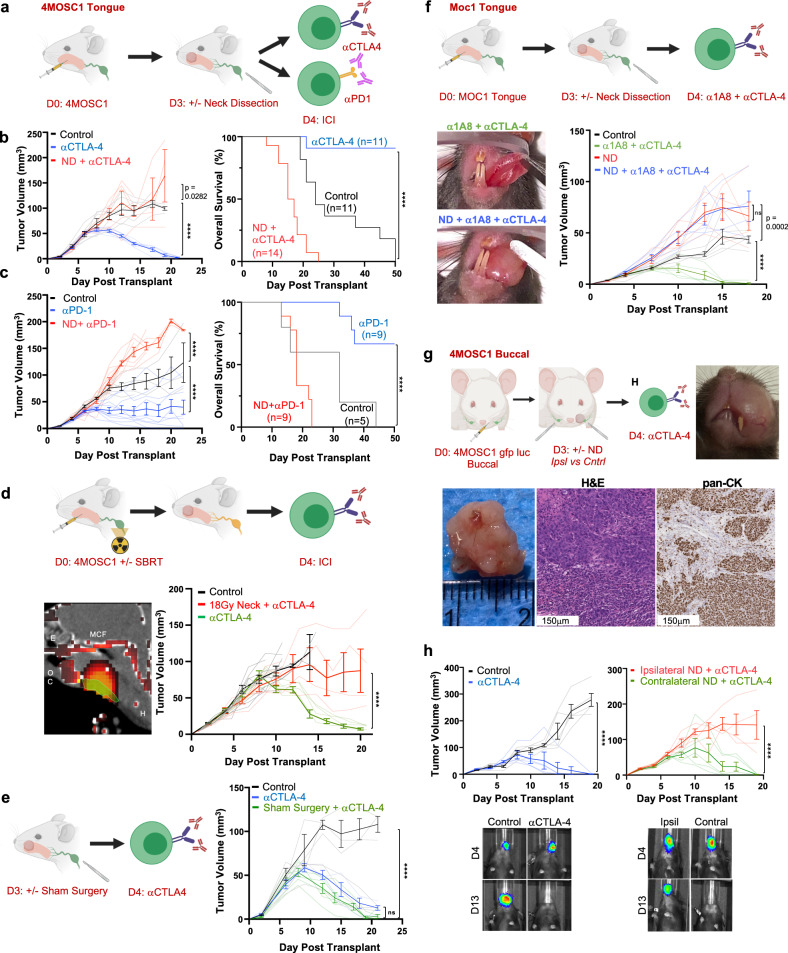
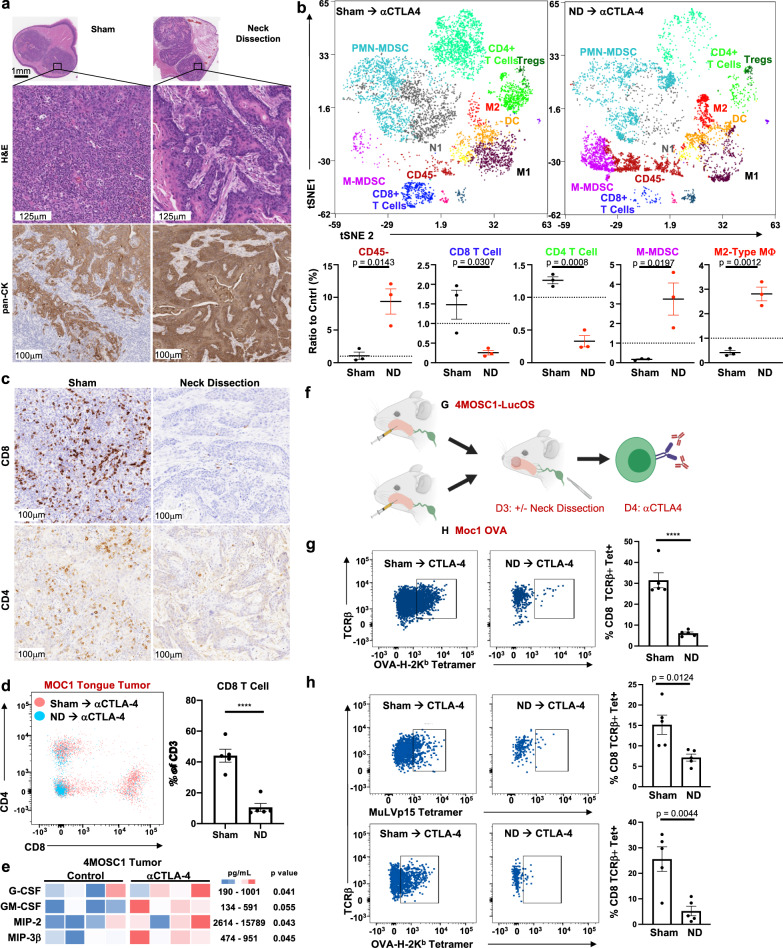
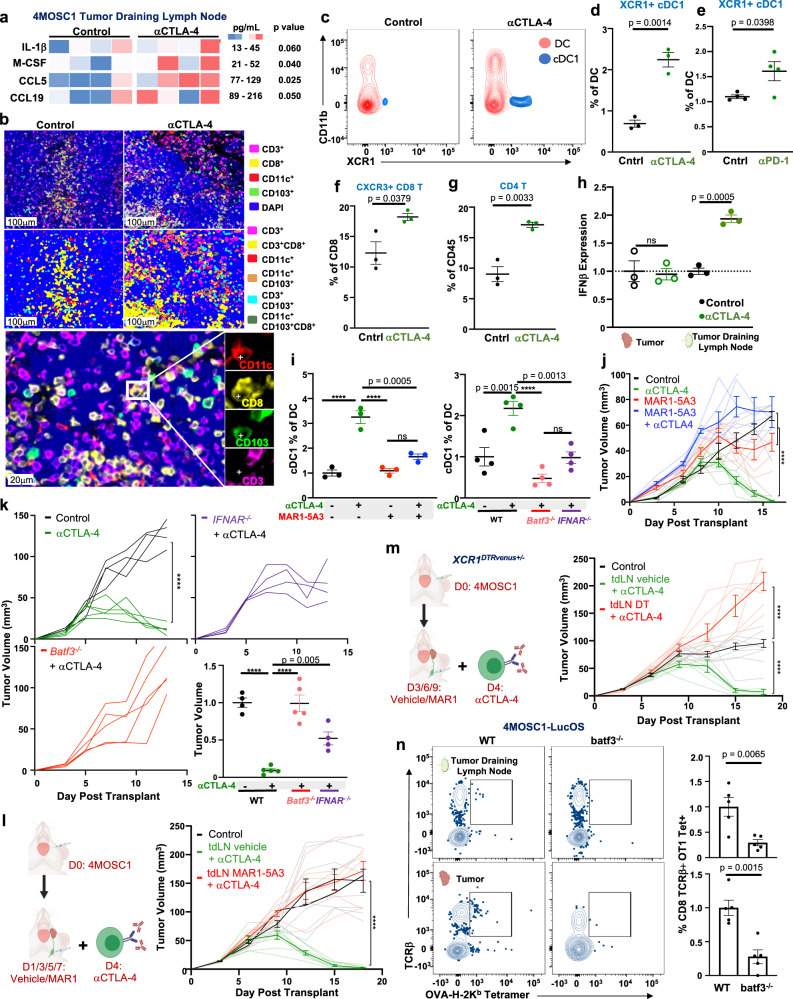
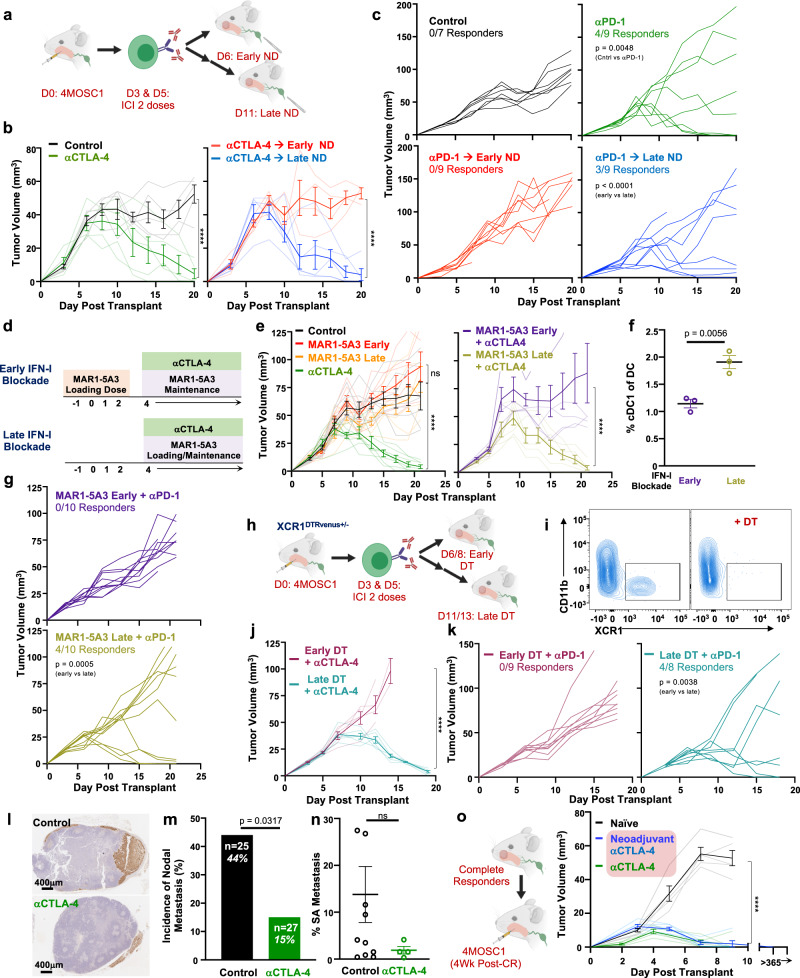
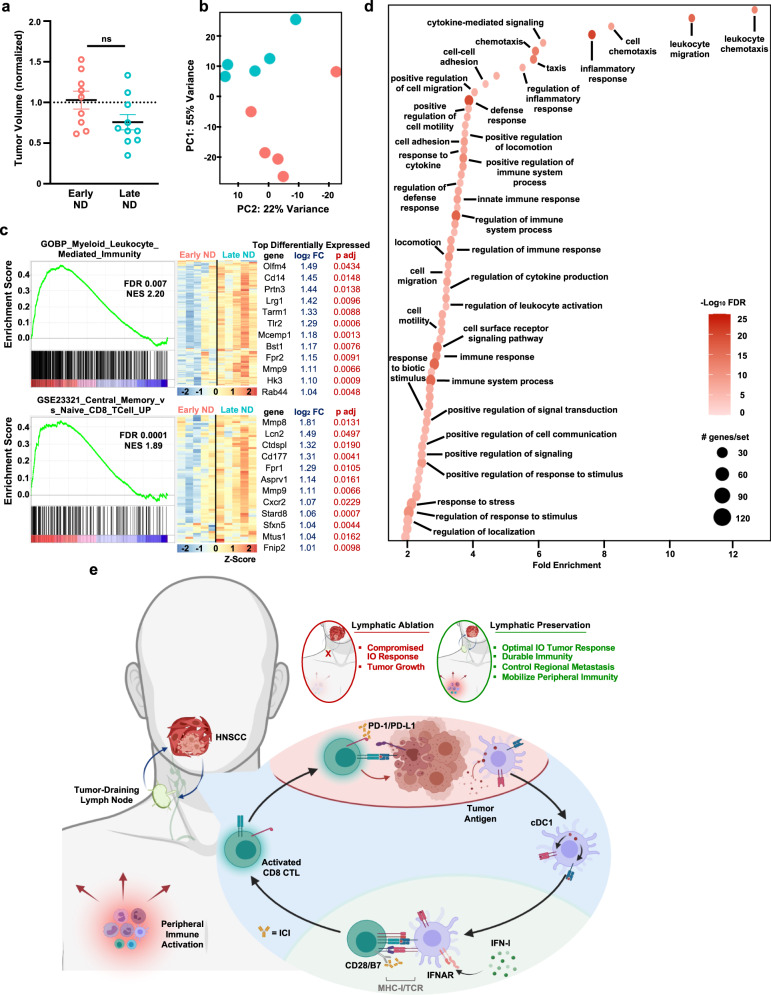
Despite the promise of immune checkpoint inhibition (ICI), therapeutic responses remain limited. This raises the possibility that standard of care treatments delivered in concert may compromise the tumor response. To address this, we employ tobacco-signature head and neck squamous cell carcinoma murine models in which we map tumor-draining lymphatics and develop models for regional lymphablation with surgery or radiation. We find that lymphablation eliminates the tumor ICI response, worsening overall survival and repolarizing the tumor- and peripheral-immune compartments. Mechanistically, within tumor-draining lymphatics, we observe an upregulation of conventional type I dendritic cells and type I interferon signaling and show that both are necessary for the ICI response and lost with lymphablation. Ultimately, we provide a mechanistic understanding of how standard oncologic therapies targeting regional lymphatics impact the tumor response to immune-oncology therapy in order to define rational, lymphatic-preserving treatment sequences that mobilize systemic antitumor immunity, achieve optimal tumor responses, control regional metastatic disease, and confer durable antitumor immunity.


Conflict of interest statement

The authors declare no competing interests.

Figures

Fig. 1
Fig. 1. Cervical lymphatic mapping and neck dissection model.
a Illustrative photographs depicting anatomic lymphatic mapping following injection of 5% Evans Blue dye into oral cavity (OC) subsites. b Top: Illustrative IVIS image to depict anatomic lymphatic mapping following injection of anti-LYVE-ef660 antibody into the tongue (1s exposure with the Cy5.5 channel on the IVIS 2000). Bottom: Representative image of a clearing-enhanced 3D (Ce3D) en bloc resected tongue-neck specimen stained with anti-LYVE-ef660 (1:100), imaged with the Leica SP8 confocal microscope. c Representative images demonstrating functional mapping following injection of SIINFEKL peptide/CpG adjuvant. Depicted are lymphatic basins, overlayed with heatmaps, to indicate the % CD11c + H-2kb SIINFEKL + cells identified by flow cytometry. d Putative tumor-draining lymph nodes (tdLNs) and non-draining lymph nodes (ndLNs) were harvested from 4MOSC1 tumor-bearing animals on day 10. Top: Representative H&E-stained tdLN and ndLN shown with (bottom) scoring for overall surface area and the number of reactive follicles (n = 10 independent samples/group). e Left: Representative tdLN with the focus of metastatic disease shown, stained by H&E and with anti-pan-CK antibody. Right: Quantification of the incidence of metastatic disease in tdLN and ndLN, shown in a contingency plot (n = 25/group, Fisher’s exact test). f Illustrative photographs demonstrating the key procedural steps of the murine neck dissection. (1) dissection to reflect the submandibular gland from the superficial lymphatic basin, (2) superficial lymphatic basin liberated from underlying tissues, (3) completed dissection of the deep lymphatic basin with the jugular venous plexus in situ along the floor of the neck, (4) closure. g Representative axial CT images of the neck obtained from an untreated 4MOSC1-tongue tumor-bearing animal or following neck dissection (arrowhead = cervical lymph node). h Cartoon image to diagram murine cervical lymphatic basins in the context of adjacent, critical head, and neck anatomy. The differences between experimental groups were analyzed using independent, two-sided Student t tests (d) or fisher’s exact test (e). All data represent averages ± SEM, except where indicated. ****P < 0.0001. ns not statistically significant. Source data are provided as a Source Data file.
Fig. 2
Fig. 2. Draining lymphatic basins are required for tumor response to immune checkpoint inhibition.
a Experimental schema for b, c. b Left: Representative tumor growth kinetics from 4MOSC1 tumor-bearing animals treated with αCTLA-4 following neck dissection (ND, red lines) or no surgery (blue lines) (n = 6/group); right: compiled overall survival data (ND + αCTLA-4 ICI, red lines n = 14; αCTLA-4 monotherapy, blue lines n = 1; control, black lines n = 11). c Left: Representative tumor growth kinetics from 4MOSC1 tumor-bearing animals treated with αPD-1 following ND (red lines) or no surgery (blue lines) (n = 9/treatment group, n = 5 control); right: compiled overall survival data (ND + αPD-1 ICI, red lines n = 9; αPD-1 monotherapy, blue lines n = 9; control, black lines n = 5). d Top: Experimental schema; bottom left: representative sagittal CT image illustrating a single 18 Gy dose of radiation therapy targeting the cervical lymphatics (green indicates the area of contouring; red heatmap identifies the intensity of delivered ablative single fraction radiation therapy, OC = oral cavity, E = ethmoid, MCF = middle cranial fossa, H = hyoid). Bottom right: Representative tumor growth kinetics from 4MOSC1 tumor-bearing animals treated with αCTLA-4 monotherapy following 18 Gy delivered to the neck on day 0 (red lines, n = 5) or no radiation (green lines, n = 5) or control animals (black lines, n = 6). e Left: Experimental schema; right: tumor growth kinetics from 4MOSC1 tumor-bearing animals randomized to receive sham surgery and αCTLA-4 (green lines, n = 6), αCTLA-4 alone (blue lines, n = 5) or control (black lines, n = 3). f Top: Experimental schema; bottom left: representative photographs of MOC1 tumor-bearing animals treated with combination α1A8 + αCTLA-4 with or without ND at day 15; bottom right: Tumor growth kinetics comparing combination treatment (green lines) and treatment after neck dissection (blue lines) (n = 5 animals/group). g Top left: Experimental schema for h; top right: representative photograph of a 4MOSC1 buccal tumor, day 16 (representative of n = 5 animals); bottom: representative gross specimen and immunohistochemical images of buccal tumors stained with H&E or anti-pan-CK antibody (representative of n = 5 tumors). h Top: Tumor growth kinetics from 4MOSC1 buccal tumor-bearing animals treated with αCTLA-4 (blue lines, n = 5) versus control (black lines, n = 5) or following ipsilateral (red lines, n = 5) versus contralateral ND (green lines, n = 5); bottom: representative images of 4MOSC1-LucOS tumor-bearing animals after indicated IO treatment, day 4 or 13 after tumor transplantation and surgery at day 3 (n = 4–5 animals/group). The differences between experimental groups were analyzed using simple linear regression analysis (b, c, left, d, e, f, h); and, survival analysis was performed using the Kaplan–Meier method and log-rank tests (b, c, right). All data represent averages ± SEM, except where indicated. ****P < 0.0001. ns not statistically significant. Source data are provided as a Source Data file.
Fig. 3
Fig. 3. Regional tumor-draining lymphatics coordinate antigen-specific CD8-driven immunity in the tumor microenvironment.
a Representative immunohistochemical images of 4MOSC1-tongue tumors from animals subjected to neck dissection or sham surgery followed by αCTLA-4 therapy, harvested at day 10. Shown are whole tumor sections, representative high-power H&E, and anti-pan-CK stained sections (representative of n = 5 tumors/treatment group). b Top: Representative tSNE plots shown from time-of-flight mass cytometry (CyTOF), comparing 4MOSC1-tongue tumors from animals subjected to neck dissection or sham surgery followed by αCTLA-4, harvested at day 10; bottom: quantification of selected populations identified in the TIME of the aforementioned groups (n = 3 samples/group). c Representative high-power IHC images probing for CD8+ or CD4+ cells in 4MOSC1-tongue tumors from animals subjected to neck dissection or sham surgery followed by αCTLA-4 therapy, harvested at day 10 (representative of n = 5 tumors/treatment group). d Flow plot and quantification comparing the CD4+ and CD8+ T-cell populations of MOC1 tongue tumors from animals subjected to neck dissection or sham surgery followed by αCTLA-4 therapy (red = sham surgery cohort, blue = neck dissection cohort, n = 5/group). e Heatmap comparing the expression of select chemokines and cytokines from the TIME of either control or αCTLA-4 treated 4MOSC1-tongue tumor-bearing animals at day 8 (n = 4/group). f Experimental schema—(g) 4MOSC1-LucOS or (h) MOC1-OVA tumors. Animals were randomized to receive sham surgery or neck dissection followed by treatment with αCTLA-4, after which tumors were harvested for flow cytometry to detect tumor-specific antigen tumor-infiltrating T cells. g Left: Representative flow cytometry plots and; right: quantification identifying TCRβ + OVA-H-2kb Tetramer+ CD8+ T cells from 4MOSC1-LucOS tumor-bearing animals harvested at day 10 after sham surgery or neck dissection and αCTLA-4 (n = 5/group). h Left: Representative flow cytometry plots; and right: quantification identifying TCRβ + MuLVp15 Tetramer+ or OVA-H-2kb Tetramer+ CD8+ T cells from MOC1-OVA tongue tumor-bearing animals harvested at day 10 after sham surgery or neck dissection and αCTLA-4 (n = 5/group). The differences between experimental groups were analyzed using independent, two-sided Student t tests (b, d, e, g, h). All data represent averages ± SEM, except where indicated. ****P < 0.0001. ns not statistically significant. Source data are provided as a Source Data file.
Fig. 4
Fig. 4. Tumor-draining lymphatics harbor a population of conventional type I dendritic cells critical for the response to ICI.
a Heatmap comparing the expression of select chemokines and cytokines from tumor-draining lymph nodes of either control or αCTLA-4 treated 4MOSC1 tumor-bearing animals, day 8 (n = 4/group). b Representative multiplex immunofluorescence images identifying putative conventional type I dendritic cells (cDC1s) within the control or αCTLA-4 treated tdLNs from 4MOSC1 tumor-bearing animals, day 10 (representative of n = 10 tdLN/treatment group). c Representative flow cytometry contour plots identifying cDC1s (Ly6c-CD64-CD19-NK-CD11c + MHCIIhi CD11b-XCR1 +) from the tdLNs of control or αCTLA-4 treated 4MOSC1 tumor-bearing animals, day 10. d Quantification of cDC1s in tdLN after αCTLA-4 (n = 3). e Quantification of cDC1 in tdLN after αPD-1 (n = 4). f Quantification of activated CXCR3 + CD8+ T cells in the tdLNs of control or αCTLA-4-treated 4MOSC1 tumor-bearing animals, day 10 (n = 3). g Quantification of CD4+ T cells in the tdLNs of control or αCTLA-4-treated 4MOSC1 tumor-bearing animals, day 10 (n = 3). h IFNβ ELISA from tumor and tdLN from control or αCTLA-4 treated 4MOSC1 tumor-bearing animals, normalized to control, day 10 (n = 3). i Left: Quantification of cDC1s in the tdLNs of 4MOSC1 tumor-bearing WT animals treated with αCTLA-4 (green), MAR1-5A3 blocking antibody (red lines) or combination (blue lines) (n = 3 animals/group), day 10; (Right) and, in the tdLNs of WT (black), batf3–/– (red), or ifnar–/– (purple) animals treated with αCTLA-4 (n = 4 animals/group), day 10. j Tumor growth kinetics from 4MOSC1 tumor-bearing animals treated with αCTLA-4 (green lines, n = 7), MAR1-5A3 blocking antibody (red lines, n = 6), combination therapy (blue lines, n = 6) or control (black lines, n = 6). k Tumor growth kinetics from 4MOSC1 tumor-bearing WT control (black lines, n = 4) and αCTLA-4 treated animals (green lines, n = 5) versus αCTLA-4 treated batf3–/– (red lines, n = 5) or ifnar−/− (purple lines, n = 4); bottom right: tumor volume normalized to control at day 13. l Left: Experimental schema: 5 μg of MAR1-5A3 blocking antibody or vehicle was injected into the tdLN every 2 days, beginning day 1, for a total of 4 doses. Following the development of conspicuous tumors, animals were randomized to receive αCTLA-4. Right: Tumor growth kinetics from 4MOSC1 buccal tumor-bearing animals treated with αCTLA-4 ICI and tdLN-injected local IFNAR blockade (red lines) or vehicle (green lines) (n = 8 animals/treatment group). m Left: Experimental schema: 1 μg of diphtheria toxin or vehicle was injected into the tdLN every 3 days, beginning on day 3, for a total of three doses. Following the development of conspicuous tumors, XCR1DTRVenus+/– animals were randomized to receive αCTLA-4. Right: Tumor growth kinetics from 4MOSC1 buccal tumor-bearing animals treated with αCTLA-4 ICI and tdLN-injected local diphtheria toxin (red lines, n = 7) or vehicle (green lines, n = 7) versus control (black lines, n = 8). n Left: Representative flow cytometry plots and; right: quantification identifying TCRβ + OVA-H-2kb Tetramer+ CD8+ T cells from 4MOSC1-LucOS tongue tumor-bearing WT or batf3−/− animals, day 10 (n = 5). The differences between experimental groups were analyzed using independent, two-sided Student t tests (a, dh, n, right), one-way ANOVA (i, k, bottom right) or simple linear regression analysis (jm). All data represent averages ± SEM, except where indicated. ****P < 0.0001. ns not statistically significant. Source data are provided as a Source Data file.
Fig. 5
Fig. 5. Rational IO treatment sequencing drives primary tumor treatment responses and immunosurveillance to protect against locoregional nodal metastasis.
a Experimental schema for b, c. b Tumor growth kinetics from 4MOSC1 tumor-bearing control animals (black lines, n = 5) or αCTLA-4-treated animals (green lines, n = 5), followed by either early (red lines, n = 4) or late (blue lines, n = 5) neck dissection. c Tumor growth kinetics from 4MOSC1 tumor-bearing control animals (black lines, n = 7) or αPD-1-treated animals (green lines, n = 9), followed by either early (red lines, n = 9) or late (blue lines, n = 9) neck dissection. d Experimental schema for e, g. e Left: Tumor growth kinetics from 4MOSC1 tumor-bearing control animals (black lines, n = 7) or αCTLA-4 treated animals (green lines, n = 7), early IFNAR blockade animals (red lines, n = 7), or late IFNAR blockade animals (orange lines, n = 7). Right: Tumor growth kinetics from 4MOSC1-tongue tumor-bearing animals treated with αCTLA-4 after receiving early IFNAR blockade (purple lines, n = 6) or late IFNAR blockade (dark yellow lines, n = 7). f Percent cDC1s in the tdLNs of 4MOSC1 tumor-bearing animals treated with αCTLA-4 after receiving early (purple lines) or late (dark yellow lines) IFNAR blockade (n = 3/group). g Tumor growth kinetics from 4MOSC1 tumor-bearing animals treated with αPD-1 after receiving early (purple lines) or late (dark yellow lines) IFNAR blockade (n = 10/group). h Experimental schema for j, k. i Representative flow cytometry plots demonstrating the conditional depletion of cDC1s in αCTLA-4 treated 4MOSC1-tongue tumor-bearing XCR1DTRvenus+/− animals one day after systemic delivery of diphtheria toxin (DT) (representative of n = 5 independent samples/group). j Tumor growth kinetics from 4MOSC1 umor-bearing XCR1DTRvenus+/− animals treated with αCTLA-4 and (purple lines) or late (turquoise lines) DT (n = 3 animals/treatment group). k Tumor growth kinetics from 4MOSC1 tumor-bearing XCR1DTRvenus+/− animals treated with αPD-1 and early (purple lines, n = 9) or late (turquoise lines, n = 8) DT. l Representative immunohistochemical images of tdLNs stained with pan-CK rom 4MOSC1-tongue tumor-bearing animals treated with two doses of αCTLA-4 compared to control, day 11, with; (m) Incidence of metastatic disease in tdLNs (n = 25–27 individual tumor-draining lymph nodes/group); and, (n) Quantification of the burden of metastatic disease among tdLNs with occult nodal disease from 4MOSC1 tumor-bearing animals treated with two doses of αCTLA-4 (n = 4) compared to control (n = 11). o Left: Experimental schema; right: tumor growth kinetics in naive (black lines) or previous complete responders after either six doses (green lines) or two doses of αCTLA-4 (blue lines) (naive n = 5/group; long-term survival, n = 3/group). The differences between experimental groups were analyzed using independent, two-sided Student t tests (f, n), fisher’s exact test (m) or simple linear regression analysis (b, c, e, g, j, k, o). All data represent averages ± SEM, except where indicated. ****P < 0.0001. ns not statistically significant. Source data are provided as a Source Data file.
Fig. 6
Fig. 6. Lymphatic-sparing IO therapy mobilizes peripheral antitumor immunity.
a Normalized tumor volumes on day 9 or 10 after orthotopic transplantation of 106 4MOSC1 tumor cells and treatment in vivo with two doses of αCTLA-4 followed by either an early (red, n = 9) or late (blue, n = 10) neck dissection—day 6 versus day 11. b Principal component analysis plot from whole blood RNA sequencing, performed at day 10 after transplantation of 106 4MOSC1 tumor cells and treatment in vivo with two doses of αCTLA-4 followed by either an early (red) or late (blue) neck dissection—day 6 versus day 11, calculated and plotted with DESeq2, n = 5. c Left: Representative gene set enrichment mountain plots of differentially expressed genes; and right: corresponding heatmaps depicting the row normalized Z-score of the top differentially expressed genes from those gene sets identified in analysis of whole blood RNA sequencing after transplantation of 106 4MOSC1 tumor cells and treatment in vivo with two doses of αCTLA-4, followed by either an early (red), or late (blue) neck dissection. d Bubble plot illustrating the top hits from a Gene Ontology analysis, illustrating GO hits enriched in late vs early ND treatment sequencing groups as described in Fig. 5a (log2FC > 1, adjusted P value < 0.05 upregulated genes identified in analysis of whole blood RNA sequencing; n = 5). e Cartoon describing the central role that the tumor-draining lymph node plays in the response to ICI therapy and the outcome of rational, lymphatic-preserving treatment sequencing in HNSCC; see text for details. The differences between experimental groups were analyzed using independent, two-sided t tests (a), DESeq2 (c) or Log2FC P < 0.05 (d). All data represent averages ± SEM, except where indicated. ns   not statistically significant. Source data are provided as a Source Data file.

Similar articles

Cited by

References

    1. Siegel RL, Miller KD, Jemal A. Cancer statistics, 2020. CA: A Cancer J. Clin. 2020;70:7–30. - PubMed
    1. Chow LQM, Longo DL. Head and neck cancer. N. Engl. J. Med. 2020;382:60–72. doi: 10.1056/NEJMra1715715. - DOI - PubMed
    1. Johnson DE, et al. Head and neck squamous cell carcinoma. Nat. Rev. Dis. Prim. 2020;6:92. doi: 10.1038/s41572-020-00224-3. - DOI - PMC - PubMed
    1. Loganathan, S. K. et al. Rare driver mutations in head and neck squamous cell carcinomas converge on NOTCH signaling. https://www.science.org/doi/epdf/10.1126/science.aax0902 (2020). - DOI - PubMed
    1. Wang Z, et al. Disruption of the HER3-PI3K-mTOR oncogenic signaling axis and PD-1 blockade as a multimodal precision immunotherapy in head and neck cancer. Nat. Commun. 2021;12:2383. doi: 10.1038/s41467-021-22619-w. - DOI - PMC - PubMed

Publication types

Substances