. 2022 Jul 25;13(1):4302.
doi: 10.1038/s41467-022-31950-9.

Single-cell transcriptome atlas of the human corpus cavernosum

Affiliations

Single-cell transcriptome atlas of the human corpus cavernosum

LiangYu Zhao et al. Nat Commun. .

Abstract

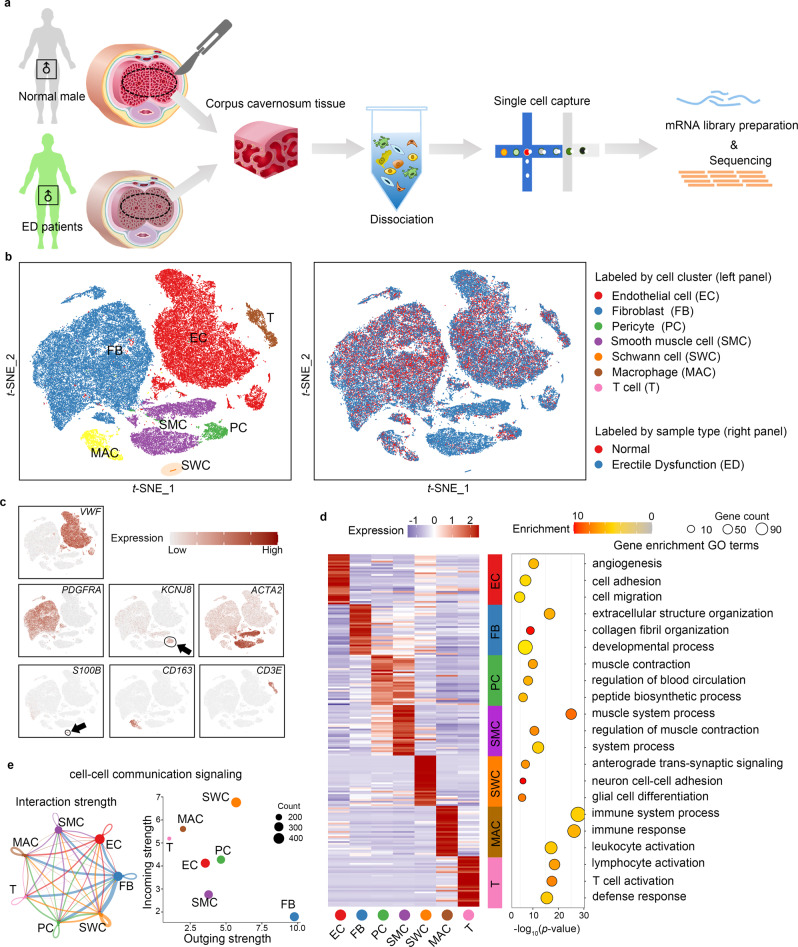
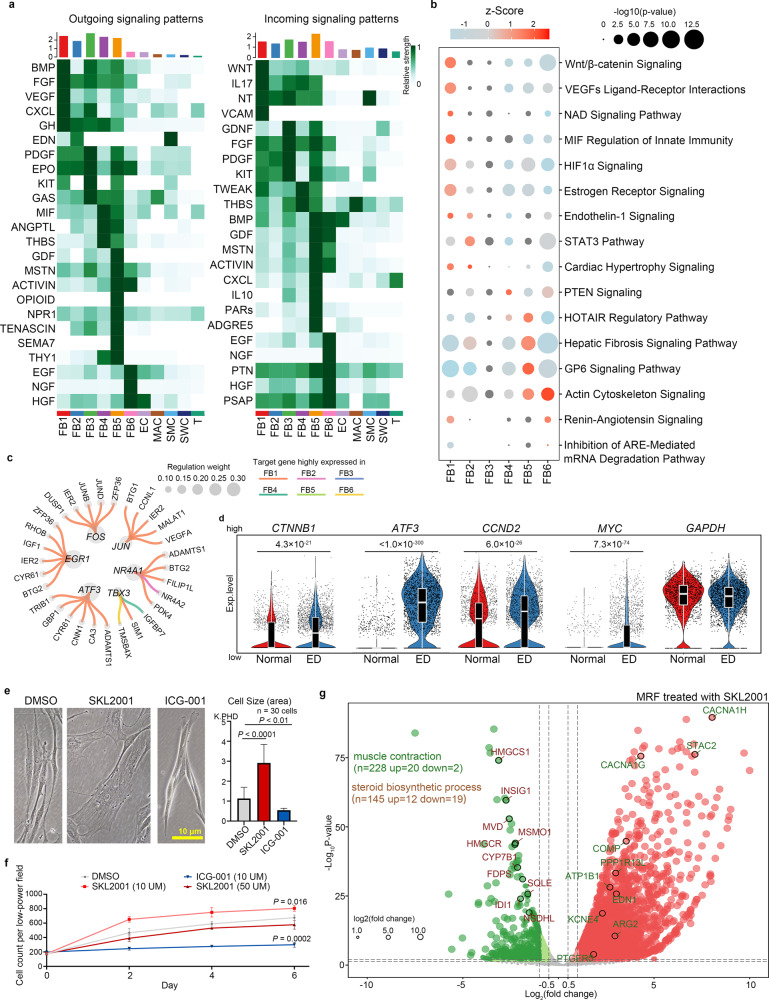
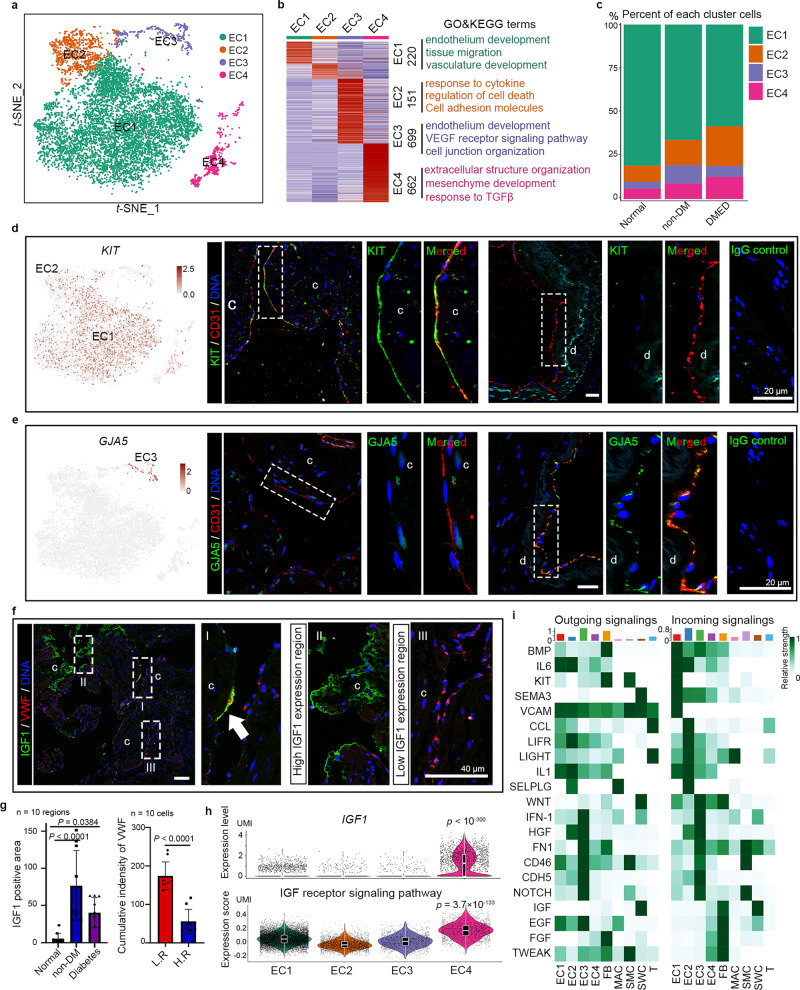
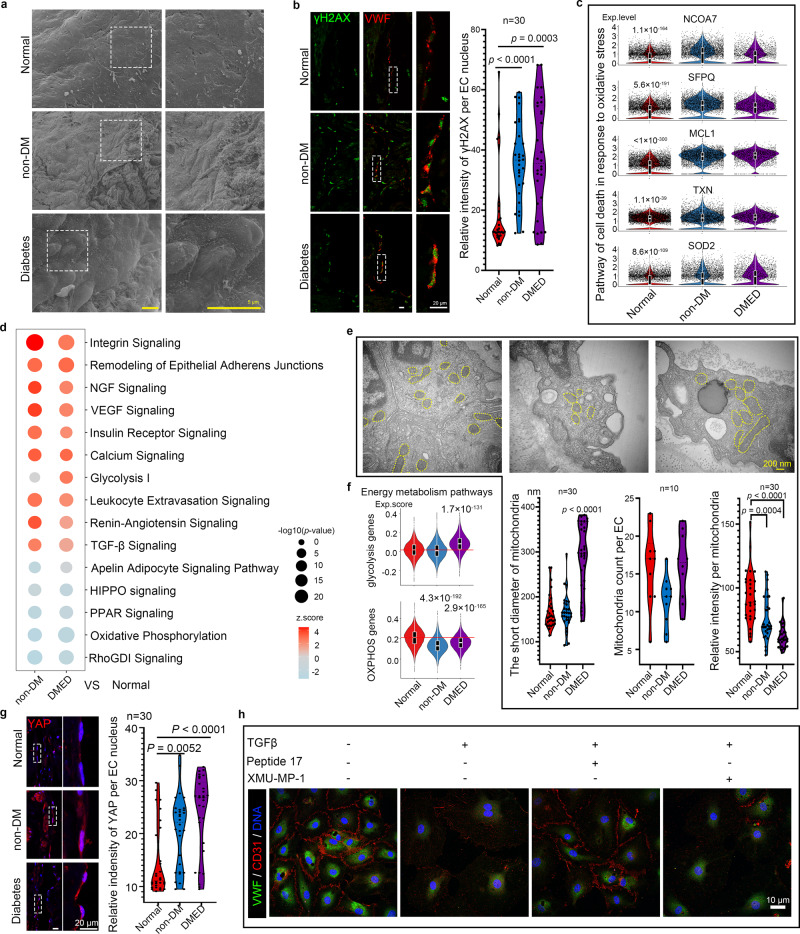
The corpus cavernosum is the most important structure for penile erection, and its dysfunction causes many physiological and psychological problems. However, its cellular heterogeneity and signalling networks at the molecular level are poorly understood because of limited access to samples. Here, we profile 64,993 human cavernosal single-cell transcriptomes from three males with normal erection and five organic erectile dysfunction patients. Cell communication analysis reveals that cavernosal fibroblasts are central to the paracrine signalling network and regulate microenvironmental homeostasis. Combining with immunohistochemical staining, we reveal the cellular heterogeneity and describe a detailed spatial distribution map for each fibroblast, smooth muscle and endothelial subcluster in the corpus cavernosum. Furthermore, comparative analysis and related functional experiments identify candidate regulatory signalling pathways in the pathological process. Our study provides an insight into the human corpus cavernosum microenvironment and a reference for potential erectile dysfunction therapies.


Conflict of interest statement

The authors declare no competing interests.

Figures

Fig. 1
Fig. 1. Global expression profiling of human corpus cavernosum cells in normal male and ED patients by single-cell RNA-seq.
a Schematic illustration of the experimental workflow in this study. b t-distributed stochastic neighbour embedding (tSNE) plots of all corpus cavernosum cells from eight donors (three normal males and five ED patients). Cells are coloured according to their types (left panel) or state (right panel; red = Normal, blue = Erectile dysfunction). c Expression patterns of the following marker genes for each cluster are projected on the tSNE plot of all CC cells: VWF (endothelial cells), PDGFRA (fibroblast), KCNJ8 (pricytes), ACTA2 (smooth muscle cells), S100B (Schwann cells), CD163 (macrophages) and CD3E (T cells). A gradient of light grey to dark red indicates low to high expression levels. d Heatmap of the top 30 DEGs in each major cluster (left panel), with the GO analysis (biological process) according to the DEGs of each major cluster shown as a bubble diagram (right panel). A gradient of light blue to dark red indicates low to high expression levels in the heatmap. Statistical analysis was based on Fisher’s exact test; two-tailed; the confidence interval is 95%. A gradient of red to grey indicates low to high P-values in the bubble diagram and the size of the bubbles indicates the count of enriched DEGs for each GO term. e Cell–cell communication signalling network among the seven major clusters analysed with CellChat. The width of the lines indicates the number of pairs. Different colours represent different signal sources. The right panel showed that cell clusters were located based on the count of their significant incoming (Y-axis) or outgoing (X-axis) signalling pattern.
Fig. 2
Fig. 2. Transcription characteristics and heterogeneity among the six FB subclusters.
a tSNE plots of the six fibroblast (FB) subclusters. Cells are coloured according to their types (left panel) or expression level of the marker gene (right panel). b Bubble diagram of the top five DEGs in each FB subcluster. A gradient of grey to red indicates low to high expression levels. The size of bubbles indicates the percentage of cells positive for DEGs in each subcluster. c Heatmap showing the DEGs in each FB subcluster (left panel) based on normal samples. The GO terms (biological process) associated with their DEGs are listed in the right panel. The count of DEGs for each FB subcluster are listed in the middle panel. d Bar plot showing the cell count proportion of each FB subcluster in normal and ED CC. e Cell function (proliferation and death) predicted by IPA analysis according to the DEGs of each FB subcluster shown as a bubble diagram. A gradient of light blue to red indicates inhibition to activation of the term. The size of the bubble indicates the P-value. f Violin plot combined with box plot showing the expression score of the three major energy metabolism pathway genes in each FB subcluster. Box plots indicate median (middle line), 25th, 75th percentile (box) and 5th and 95th percentile (whiskers) as well as outliers (single points).
Fig. 3
Fig. 3. Regulatory signalling of FB phenotypic transformation.
a Heatmap of the CellChat signalling in each FB subcluster. The left panel shows the outgoing signalling patterns (expression weight value of signalling molecules) and the right panel shows the incoming signalling patterns (expression weight value of signalling receptors). A gradient of white to dark green indicates low to high expression weight value in the heatmap. b Bubble diagram of the top activated IPA pathway in each FB subcluster. A gradient of light blue to red indicates inhibition to activation of the term. The size of the bubble indicates the P-value from high to low. c The top candidate master regulators and their target genes for the FB1 subcluster. The bubble size indicates the weight from high to low. d Violin plot combined with box plot showing the expression level of the genes downstream of the WNT pathway between normal male and ED patients. The housekeeping gene GAPDH is also listed as a reference. Box plots indicate median (middle line), 25th, 75th percentile (box) and 5th and 95th percentile (whiskers) as well as outliers (single points). The statistical analysis was made by Wilcoxon (Mann–Whitney) rank-sum test; two-tailed; the confidence interval is 95%. e The morphology of cultured FBs after SKL2001 (P < 0.0001) or ICG-001 treatment (P = 0.0015). Data are shown as mean ± SD. The scale bar represents 10 µm. The statistical analysis was made by ANOVA with Tukey’s multiple comparisons test; two-tailed; the confidence interval is 95%. f The statistical analysis of cell count in the group treated with SKL2001 (P = 0.016) or ICG-001 (P = 0.0002) for 7 days, data were shown as mean ± SD, n = 3 independent experiments. The statistical analysis was made by ANOVA with Tukey’s multiple comparisons test; two-tailed; the confidence interval is 95%. g Volcano plot showing the DEGs between FBs treated with SKL2001 and negative controls by RNA sequencing.
Fig. 4
Fig. 4. The heterogeneity within the SMC cluster.
a tSNE plots of the four SMC subclusters. The cells are coloured according to their subcluster or the expression level of classic actin and myosin genes. VSMC: vascular smooth muscle cells; CCSMC: corpus cavernosal trabecular smooth muscle cells; PC: pericyte; MFB: myofibroblast. b The DEGs in each SMC subcluster (left panel) based on normal samples are shown as a heatmap, and the GO terms (biological process) associated with their DEGs are listed in the right panel. The count of the DEGs for each SMC subcluster is listed in the middle panel. c CCSMC and VSMC could be distinguished according to DES protein expression. H&E staining showing the main region of the CC (upper panel). tSNE plots showing that DES is specifically expressed in the CCSMC subcluster (left panel). Immunofluorescence co-staining of DES (red) and SMA (green) in CC paraffin sections. The scale bar represents 100 µm. a, septum pectiniforme; b, region near septum pectiniforme; c, cavernosal trabecular region (sinusoid); d, cavernous artery; e, nerve bundles; f, small vessels. d The heterogenous expression pattern of smooth muscle contraction-related genes in the four SMC subclusters. P-values with a horizontal line on the violins represent statistical differences between this subcluster and the other subclusters within the SMC cluster. The statistical analysis was made by ANOVA with Tukey’s multiple comparisons test; two-tailed; the confidence interval is 95%. P-values without a line on the violins represent a significant difference between this disease type and the two other types within one subcluster. Box plots indicate median (middle line), 25th, 75th percentile (box) and 5th and 95th percentile (whiskers) as well as outliers (single points).
Fig. 5
Fig. 5. The heterogeneity within the EC cluster.
a tSNE plots of the four EC subclusters. b The DEGs in each EC subcluster (left panel) are shown as a heatmap, and the GO terms (biological process) associated with their DEGs are listed in the right panel. c Bar plot showing the proportion of each FB subcluster in each disease group. d, e tSNE plots showing the expression pattern of d KIT and e GJA5 in the EC cluster. Immunofluorescence co-staining of d CD31 (red)/KIT (green) and e CD31 (red)/GJA5 (green) in corpus cavernosum paraffin sections. The right panel is an enlargement of the dotted box in the middle panel. The scale bar represents 20 µm. f Immunofluorescence co-staining (upper panel) of VWF (red) and IGF1 (green) in CC paraffin sections. The right panels are an enlargement of the dotted box in the left panel. The arrow marks VWF/IGF1 double-positive cells (EC4). The scale bar represents 40 µm. c, sinusoid (cavernosal trabecular); d, cavernous artery. g The size of the IGF1-positive region and the immunofluorescence intensity of VWF in the IGF1-negative region (L.R.) or in the IGF1-highly expressed region (H.R.). Data are shown as mean ± SD. n = 10 different regions or cells. The statistical analysis was made by ANOVA with Tukey’s multiple comparisons test; two-tailed; the confidence interval is 95%. h The transcript level of IGF1 signalling genes shown as a violin plot combined with a box plot. Box plots indicate median (middle line), 25th, 75th percentile (box) and 5th and 95th percentile (whiskers) as well as outliers (single points). The statistical analysis was made by Wilcoxon (Mann–Whitney) rank-sum test; two-tailed; the confidence interval is 95%. i Heatmap of the CellChat signalling in each EC subcluster.
Fig. 6
Fig. 6. Pathological features of endothelial injury in ED CC.
a Scanning electron microscope image of normal and ED cavernosal trabecular endothelium. The scale bar represents 5 µm. b Immunofluorescence co-staining of VWF (red) and γH2AX (green) in CC paraffin sections. The statistical analysis of relative fluorescence intensity per EC nucleus (n = 30 cells in 5 different regions of each group) was made by ANOVA with Tukey’s multiple comparisons test; two-tailed; the confidence interval is 95%. The scale bar represents 20 µm. c Violin plot combined with box plot showing the expression level in each EC subcluster. The statistical analysis was made by Wilcoxon (Mann–Whitney) rank-sum test; two-tailed; the confidence interval is 95%. d Bubble diagram of the top activated and inhibited IPA pathways based on the DEGs of ED EC compared with normal EC. Statistical analysis was based on Fisher’s exact test; two-tailed; the confidence interval is 95%. e Transmission electron microscope image of normal and ED cavernosal trabecular endothelium. The bottom panel shows the statistical analysis of the short diameter per mitochondrion (n = 30 mitochondria), mitochondria count per EC (n = 10 cells), and relative intensity per mitochondrion (n = 30 mitochondria) made by ANOVA with Tukey’s multiple comparisons test; two-tailed; the confidence interval is 95%. The scale bar represents 200 nm. f Violin plot combined with box plot showing the expression level of the genes that are associated with energy metabolism. Statistical analysis between the normal EC and the other two groups was made by two-tailed Wilcoxon rank-sum test in R. g Immunofluorescence staining of YAP (red) in CC paraffin sections. The statistical analysis of relative fluorescence intensity per EC nucleus in normal and ED CC was made by ANOVA with Tukey’s multiple comparisons test based on 30 ECs in 5 different fields; two-tailed; the confidence interval is 95%. The scale bar represents 20 µm. h Immunofluorescence co-staining of CD31 (red) and VWF (green) in cavernosal trabecular ECs treated with TGF-β, Peptide 17, and/or XMU-MP-1. The scale bar represents 10 µm.

References

    1. Shafik A, Shafik I, El Sibai O, Shafik AA. On the pathogenesis of penile venous leakage: role of the tunica albuginea. BMC Urol. 2007;7:14. doi: 10.1186/1471-2490-7-14. - DOI - PMC - PubMed
    1. Shafik A, el-Sibai O, Shafik AA. Magnetic stimulation of the cavernous nerve for the treatment of erectile dysfunction in humans. Int. J. Impot. Res. 2000;12:137–141. doi: 10.1038/sj.ijir.3900521. - DOI - PubMed
    1. Ding YQ, Takada M, Kaneko T, Mizuno N. Colocalization of vasoactive intestinal polypeptide and nitric oxide in penis-innervating neurons in the major pelvic ganglion of the rat. Neurosci. Res. 1995;22:129–131. doi: 10.1016/0168-0102(95)00884-V. - DOI - PubMed
    1. Alwaal A, Zaid UB, Lin CS, Lue TF. Stem cell treatment of erectile dysfunction. Adv. Drug Deliv. Rev. 2015;82–83:137–144. doi: 10.1016/j.addr.2014.11.012. - DOI - PubMed
    1. Terentes-Printzios, D, Ioakeimidis, N., Rokkas, K. & Vlachopoulos, C. Interactions between erectile dysfunction, cardiovascular disease and cardiovascular drugs. Nat. Rev. Cardiol.10.1038/s41569-021-00593-6 (2021). - PubMed

Publication types