. 2022 Jul 25;13(1):4283.
doi: 10.1038/s41467-022-32017-5.

KSTAR: An algorithm to predict patient-specific kinase activities from phosphoproteomic data

Affiliations

KSTAR: An algorithm to predict patient-specific kinase activities from phosphoproteomic data

Sam Crowl et al. Nat Commun. .

Abstract

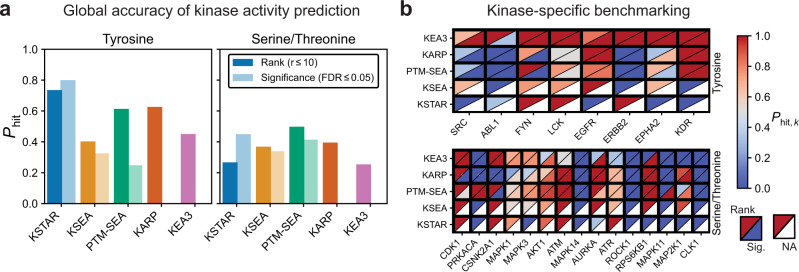
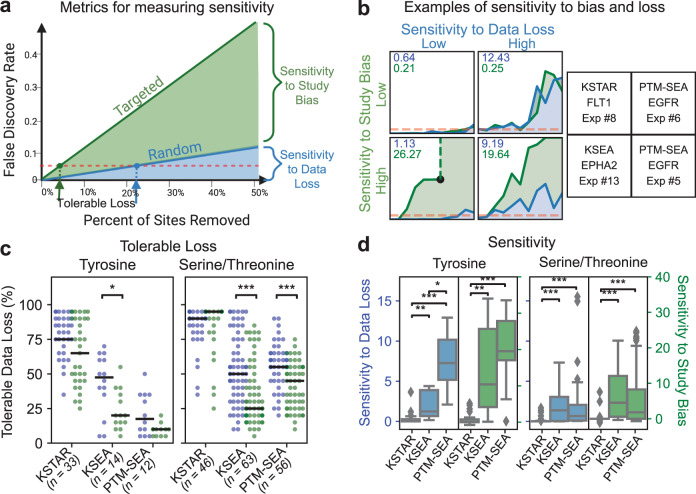
Kinase inhibitors as targeted therapies have played an important role in improving cancer outcomes. However, there are still considerable challenges, such as resistance, non-response, patient stratification, polypharmacology, and identifying combination therapy where understanding a tumor kinase activity profile could be transformative. Here, we develop a graph- and statistics-based algorithm, called KSTAR, to convert phosphoproteomic measurements of cells and tissues into a kinase activity score that is generalizable and useful for clinical pipelines, requiring no quantification of the phosphorylation sites. In this work, we demonstrate that KSTAR reliably captures expected kinase activity differences across different tissues and stimulation contexts, allows for the direct comparison of samples from independent experiments, and is robust across a wide range of dataset sizes. Finally, we apply KSTAR to clinical breast cancer phosphoproteomic data and find that there is potential for kinase activity inference from KSTAR to complement the current clinical diagnosis of HER2 status in breast cancer patients.


Conflict of interest statement

The authors declare no competing interests.

Figures

Fig. 1
Fig. 1. Overview of KSTAR algorithm.
First, we heuristically prune dense and highly overlapping weighted kinase-substrate prediction graphs from NetworKIN into many sparse, binary graphs. Statistical enrichment is calculated for an experiment that has a defined set of phosphorylation sites for every kinase across all networks using a hypergeometric distribution. We generate and calculate enrichment in 150 random experiments using the same approach. Next, we use the Mann-Whitney U test to measure the likelihood that the enrichment p-values in the real experiment are more significant than the random experiments, giving us a final p-value, which accounts for the underlying enrichment of substrates in a network, aggregates that information across the different network configurations, and controls for the kinase- and experiment-specific behavior of enrichment that occurs by random chance. We measure the false positive rate by measuring the distribution-based test for a random experiment against the remaining 149 random experiments, repeating this for 100 times. Finally, the numerical KSTAR “score” (the -log10 transformation of the Mann–Whitney U-test) is presented in graphical format where the dot size is larger when there is more evidence phosphorylation sites are coordinately sampled from a kinase network. The FPR is indicated by “Significance” of having less than a specific empirical FPR. Source data are provided with this paper.
Fig. 2
Fig. 2. KSTAR applied to diverse cell models of kinase activation and inhibition.
Full KSTAR results for data in this figure available in Supplementary Note 3). Panel titles give the reference for the publication study of the phosphoproteomic data. All KSTAR predictions use the same legend for score size and significance as given above panel A. a Predicted activation patterns of HMEC cell lines (P for parental 184A1 and 24H for HER2 overexpressing 184A1) in response to EGF and HRG stimulation. b Predicted activation patterns of TCR stimulation in Jurkat cells shows early and robust activation of TCR-specific kinases (this figure is in seconds). c Predicted kinase patterns in response to inhibition of BCR-ABL inhibition by dasatinib in K562 cells with a detailed plot of significance changes for the ABL family kinases demonstrating a decrease, but continued activity of the oncogene. Kinase activity decreases in receptor tyrosine kinases (RTKs) correspond with findings of the original publication as do changes in the off-target interactions with Src family kinases (SFKs). d AKT inhibition by five inhibitors, all competitive ATP inhibitors, except MK-2206 an allosteric inhibitor of AKT, demonstrate robust inhibition of all AKT homologs and interesting increases in CSNK2A1. e Vemurafenib treatment, targeting the BRAFV600E mutation found in Colo205 colorectal cancer cells, but not the HCT116 cell line, demonstrates a decrease in MAPK activity specific to BRAF mutation, although still statistically significant MAPK activity. Source data are provided with this paper.
Fig. 3
Fig. 3. Comparing accuracy of KSTAR to other available kinase activity algorithms.
KSTAR and four other publicly available kinase activity algorithms (KSEA, PTM-SEA, KARP, KEA3) were applied to a suite of inhibition and stimulation datasets. Accuracy measures expected activity changes as defined by Phit—the fraction of conditions for which a perturbed kinase was found differentially active, either based on activity rank (in the top 10 kinases) or significance (FDR <= 0.05), which is not available (NA) for KARP and KEA3. a Global accuracy of each algorithm for tyrosine or serine/threonine kinases. b Kinase-specific accuracy of each kinase activity algorithm, separated based on accuracy metric (rank, upper left triangle or significance, lower right triangle) and kinase type (Tyrosine, Y or Serine/Threonine, ST). The heatmaps only include kinases for which all algorithms had available predictions (full heatmaps in Supplementary Note 4). Source data are provided with this paper.
Fig. 4
Fig. 4. Comparing sensitivity to data loss and study bias.
a Metrics defined to measure sensitivity to data loss and study bias. For a kinase in a prediction that starts as significant, we select data to be removed based on completely random selection or semirandom selection where high study bias sites are removed first. Results were obtained at every 5% loss increment, with each data point in the curve indicating the average false discovery rate across five replicates. Tolerable loss is defined as the percent of sites that can be removed before the majority of trials (3 out of 5) stop showing statistically significant activity for the kinase. Sensitivity is defined as the area under the random curve (data loss) or between the targeted and random curve (study bias). b Example loss curves that illustrate the difference between low or high sensitivity to data loss and/or study bias. The sensitivity to data loss (blue) and sensitivity to study bias (green) for each curve are displayed in the upper left of each plot. The right panels define the algorithm, kinase, and the benchmark experiment number (indicated in Supplementary Table 3 and Supplementary Table 4) that gave rise to these curves. The black dot in KSEA/EPHA2 in lower left quadrant indicates that KSEA was no longer able to calculate EPHA2 activity at that value of targeted data loss. c Tolerable loss under random (blue) or targeted (green) removal for all tested conditions for each algorithm (each dot represents the measurement of tolerable loss for a single condition, black line indicates the median). Results are provided for tyrosine kinases (left) and serine/threonine kinase (right). Total number of conditions tested are given under the algorithm name. Only conditions where the perturbed kinase had statistically significant activity with the full dataset were used. To determine if the observed decrease in tolerable loss obtained between random and targeted attacks was statistically significant, a one-tailed Mann-Whitney U-test was used (*p = 0.0099, ***p < 0.0001). d The global measure, based on algorithm, for sensitivity to data loss (blue and left panels) or study bias (green and right panels). Box indicates median (center line), 25th and 75th percentiles (box boundaries), 1.5x the IQR of the box edge (whiskers), and any outliers beyond 1.5x IQR (points). If no outliers exist, whiskers indicate maxima or minima. Statistical significance was obtained from a two-tailed Mann–Whitney U test (*p = 0.00007, **p < 1e − 5, ***p < 1e − 10). A subset of biologically independent experiments from the benchmarking dataset in Fig. 3 were used for each algorithm, based on whether the perturbed kinase was predicted to have statistically significant activity (FDR ≤ 0.05) when the complete experiment was used (KSTAR (Y): n = 33, KSTAR (ST): n = 46, KSEA (Y): n = 14, KSEA (ST): n = 12, PTM-SEA (Y): n = 12, PTM-SEA (ST): n = 56). Source data are provided with this paper.
Fig. 5
Fig. 5. Tissue-specific profiles of kinase activities across independent studies of non-small cell lung carcinoma (NSCLC) and chronic myeloid leukemia (CML) cell lines.
a Comparison of the phosphoproteomic results obtained by each study (left) and the kinase activity profile predicted by KSTAR (right). We used similarity metrics to match the different data types -- Jaccard similarity for phosphoproteomics and Spearman’s rank correlation for kinase activity profiles. The ordering of the experiments in each heatmap is based on hierarchical clustering of the full kinase activity profile (Supplementary Note 5). b Kinases with the highest average activity ranking in NSCLC and CML cell lines. A rank of 1 indicates the most active kinase and a rank of 50 indicates the least active. For each study, kinases were sorted by their Mann-Whitney p-values to obtain the experiment-specific ranking, and then the average rank across experiments was calculated for each kinase. c Kinase activity profiles for top-ranked kinases. Both the kinases and experiments were sorted using hierarchical clustering with ward linkage. Full KSTAR results for data in this figure available in Supplementary Note 5. d A systematic evaluation of how KSTAR and KEA3 perform at identifying similarities between tissues of the same type and differentiate between tissues of different types based on predicted kinase activity/enrichment. KSTAR activity scores (or KEA3 kinase rankings) from each dataset were compared using Spearman's rank correlation, and results are plotted for within-tissue comparisons (NSCLC vs. NCLSC or CML vs. CML, n = 27 total pairwise comparisons across 11 biologically independent experiments) and between tissue comparisons (NSCLC vs. CML, n = 28 total pairwise comparisons across 11 biologically independent experiments). Box indicates median (center line), 25th and 75th percentiles (box boundaries), and the maxima and minima (whiskers). Points indicate a single pairwise comparison between experiments. Source data are provided with this paper.
Fig. 6
Fig. 6. KSTAR applied to breast cancer biopsies in three studies.
HER2 is used when referring to clinical diagnosis and ERBB2-activity for ERBB2/HER2 activity predictions. a KSTAR predictions of ERBB2-activity for the 77 breast cancer patients in the CPTAC dataset and their clinical IHC/FISH HER2-status is given (samples are ranked by ERBB2-activity prediction score). The table gives the total number of HER2-positive and HER-negative patients and the KSTAR predictions for ERBB2/HER2 activity for the best of three cutoffs (score-based) considered for designation of ERBB2-active: FPR < = 0.05, FPR < = 0.1, and score >3. b Predictions of EGFR and ERBB2 activities for the patient-derived xenograft (PDX) models published in Huang et al. subset that were treated with lapatinib (EGFR/HER2 targeted therapy), where WHIM14 is a HER2-negative tumor that showed a surprising response to lapatinib treatment. The table reports the HER2-status of all 25 PDX tumors and KSTAR ERBB2/HER2-activity predictions. c The ERBB2-activity predictions for tumor biopsies of patients enrolled in a HER2-positive study by Satpathy et al.. Five patients were non-pathologically complete responders (non-pCR) and the remainder were pathologically complete responders (pCR). Biopsies were taken pre-treatment and most patient's also had an on-treatment biopsy taken with phosphoproteomic profiling. The first three non-responders were reclassified for HER2-status upon additional analysis in Satpathy et al. and results are shown as one false positive and two classified as “Pseudo-positives”. Full KSTAR results for data in this figure available in Supplementary Note 6. Source data are provided with this paper.

Similar articles

Cited by

References

    1. Kinch MS. An analysis of FDA-approved drugs for oncology. Drug Discov. Today. 2014;19:1831–1835. doi: 10.1016/j.drudis.2014.08.007. - DOI - PubMed
    1. Yang K, wu Fu L. Mechanisms of resistance to BCR-ABL TKIs and the therapeutic strategies: A review. Crit. Rev. Oncol./Hematol. 2015;93:277–292. doi: 10.1016/j.critrevonc.2014.11.001. - DOI - PubMed
    1. Barouch-Benton, R. Mechanisms of Drug-Resistance in Kinases. Expert Opin. Investig. Drugs20, 153–208 (2011). - PMC - PubMed
    1. Satpathy, S. et al. Microscaled proteogenomic methods for precision oncology. Nat. Commun.11 (2020). 10.1038/s41467-020-14381-2. - PMC - PubMed
    1. Mertins P, et al. Proteogenomics connects somatic mutations to signalling in breast cancer. Nature. 2016;534:55–62. doi: 10.1038/nature18003. - DOI - PMC - PubMed

Publication types