. 2022 Jul 25;13(1):4170.
doi: 10.1038/s41467-022-31890-4.

Dysfunctional ERG signaling drives pulmonary vascular aging and persistent fibrosis

Affiliations

Dysfunctional ERG signaling drives pulmonary vascular aging and persistent fibrosis

Nunzia Caporarello et al. Nat Commun. .

Erratum in

Abstract

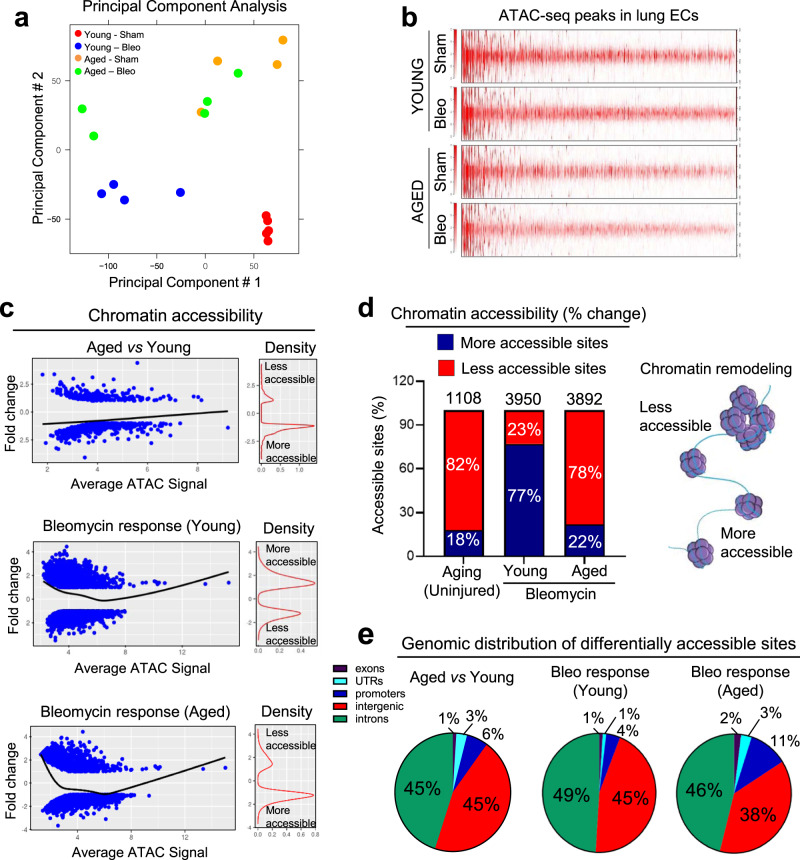
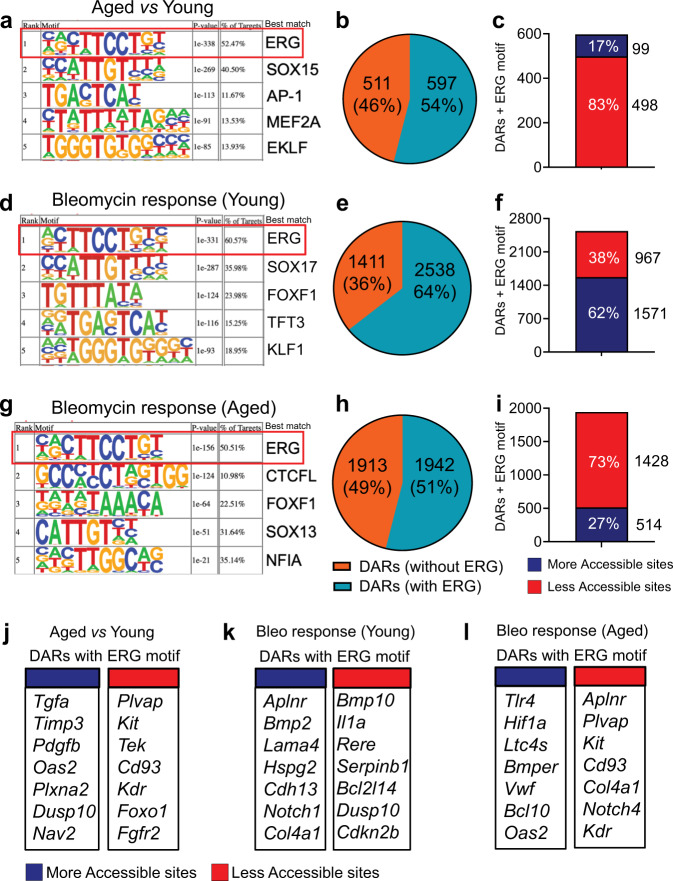
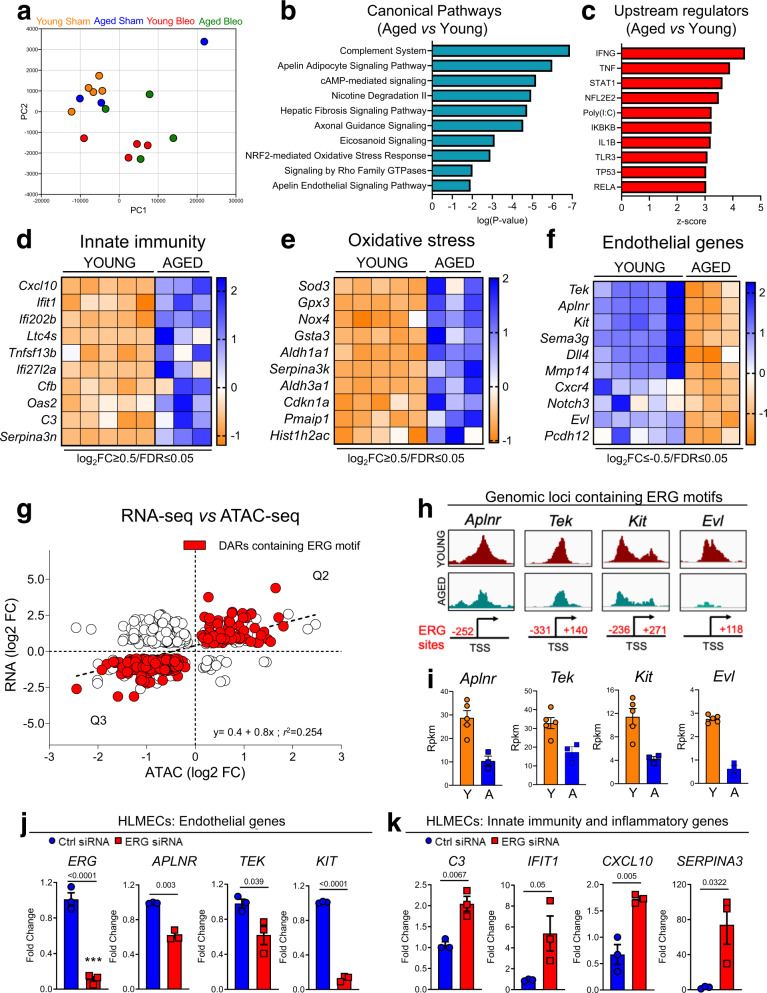
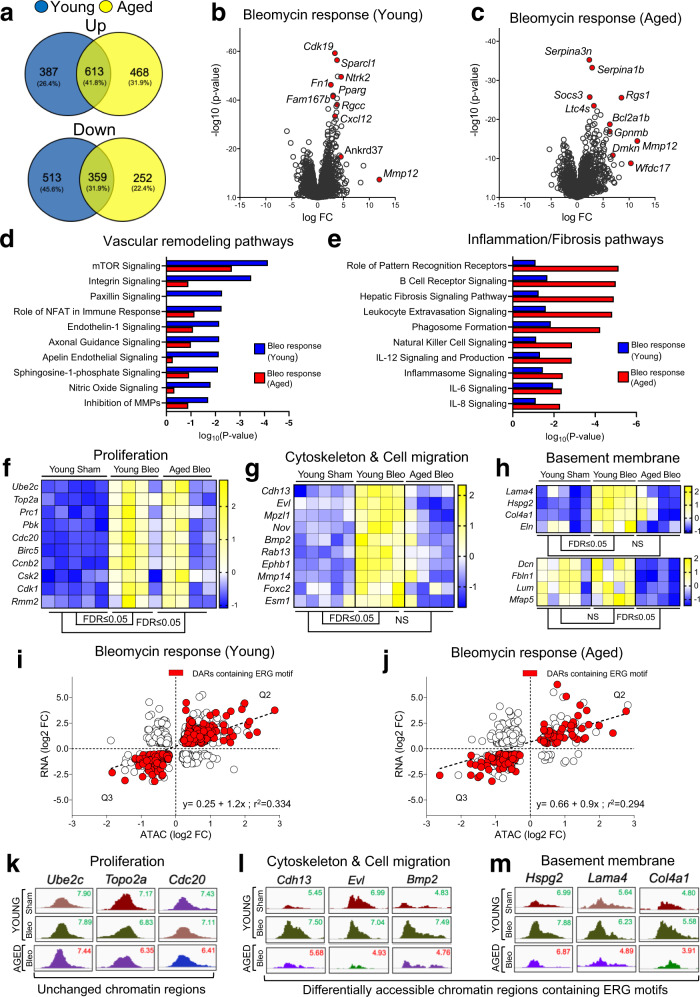
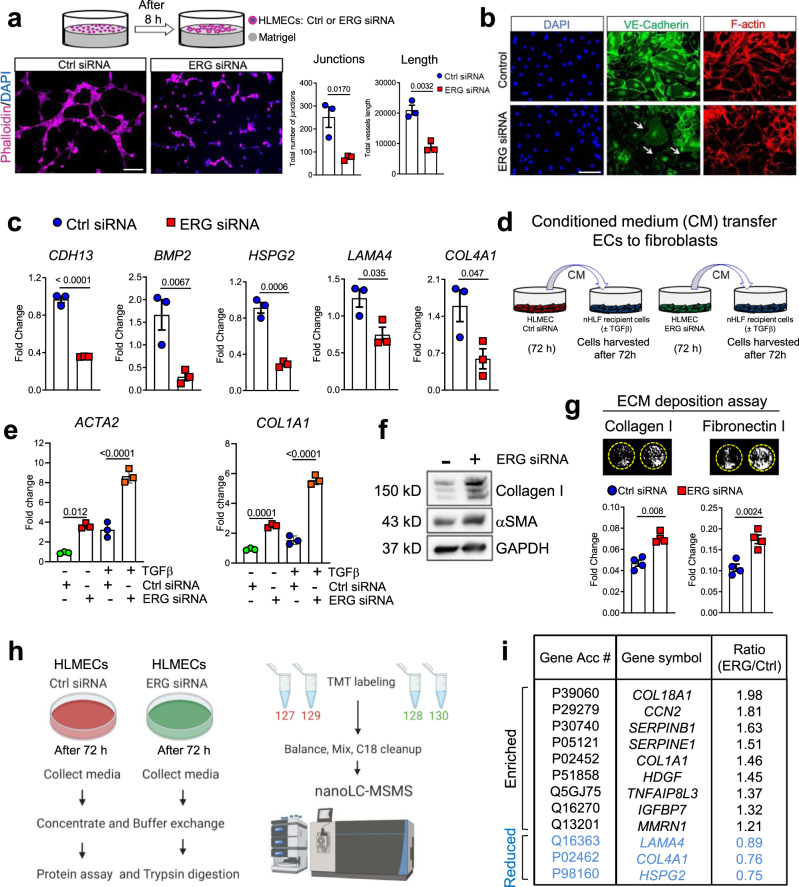
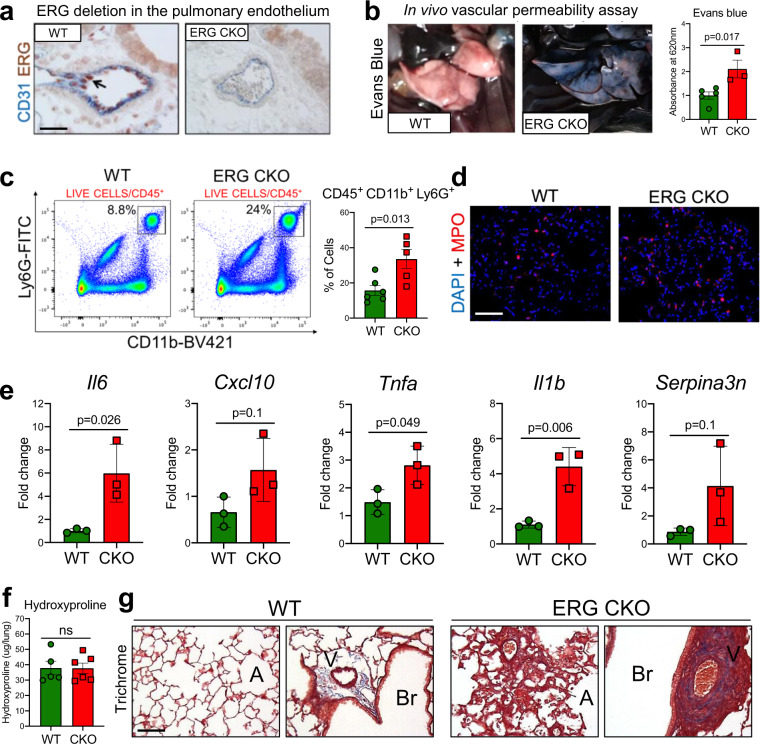
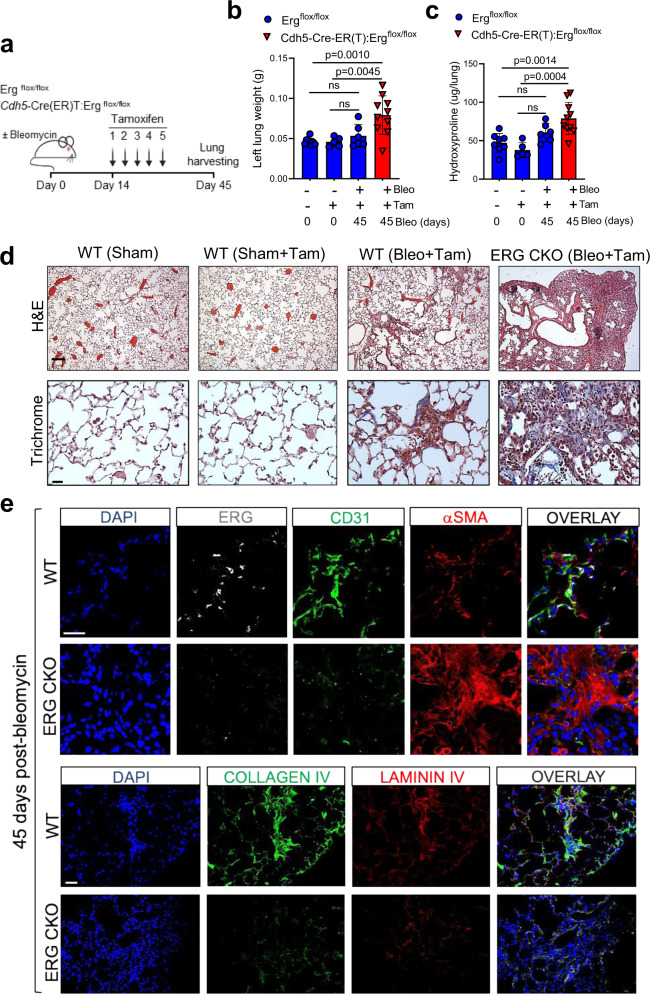
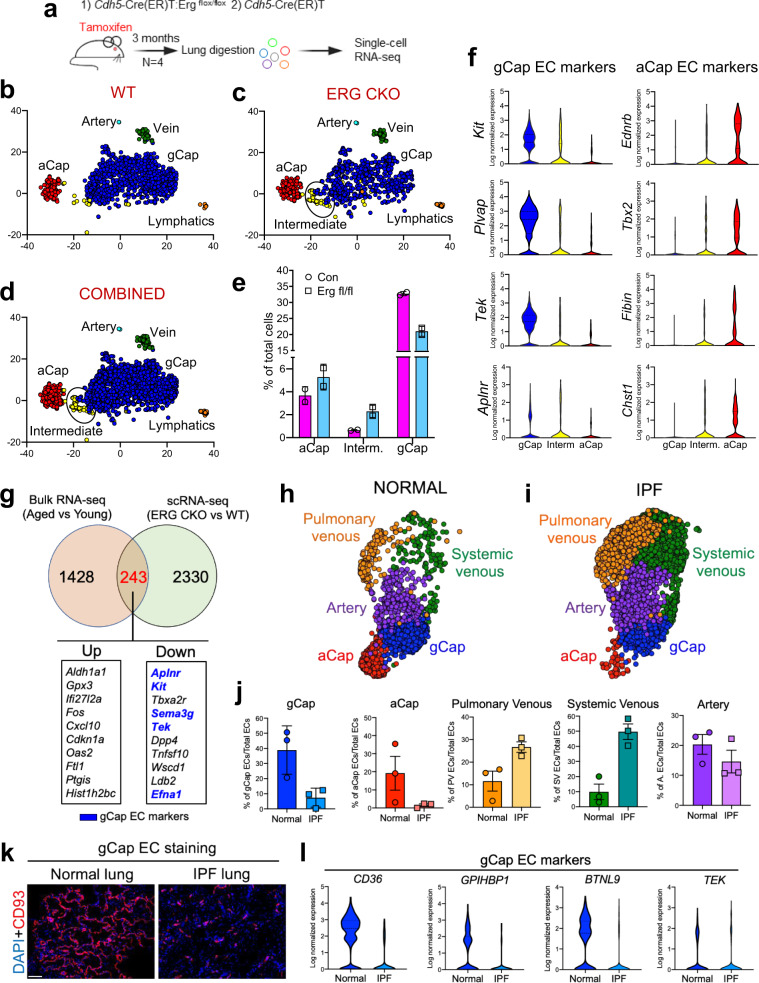
Vascular dysfunction is a hallmark of chronic diseases in elderly. The contribution of the vasculature to lung repair and fibrosis is not fully understood. Here, we performed an epigenetic and transcriptional analysis of lung endothelial cells (ECs) from young and aged mice during the resolution or progression of bleomycin-induced lung fibrosis. We identified the transcription factor ETS-related gene (ERG) as putative orchestrator of lung capillary homeostasis and repair, and whose function is dysregulated in aging. ERG dysregulation is associated with reduced chromatin accessibility and maladaptive transcriptional responses to injury. Loss of endothelial ERG enhances paracrine fibroblast activation in vitro, and impairs lung fibrosis resolution in young mice in vivo. scRNA-seq of ERG deficient mouse lungs reveales transcriptional and fibrogenic abnormalities resembling those associated with aging and human lung fibrosis, including reduced number of general capillary (gCap) ECs. Our findings demonstrate that lung endothelial chromatin remodeling deteriorates with aging leading to abnormal transcription, vascular dysrepair, and persistent fibrosis following injury.


Conflict of interest statement

The authors declare no competing interests.

Figures

Fig. 1
Fig. 1. The landscape of chromatin accessibility in young and aged mouse lung ECs.
a Principal component analysis (PCA) of accessible loci as determined by ATAC-seq of freshly sorted lung ECs from young and aged mice, either Sham operated and 30 days after intratracheal Bleomycin delivery. Each dot represents an individual mouse (Young Sham 2-month-old, N = 5; Young Bleo 2-month-old, N = 4; Aged Sham 18-month-old, N = 4; Aged Bleo 18-month-old, N = 5). b Genome-wide ATAC-seq peaks in lung ECs. Each column represents one peak. The color represents the intensity of chromatin accessibility (dark red/more accessible and light red/less accessible). c Relative changes of chromatin accessibility in aged vs young ECs from sham mice, and in injured young and injured aged ECs vs young sham. Each dot represents one ATAC-seq peak. Black line in the left panel indicates average fold changes of peaks with the same ATAC-seq intensity. The density of open and closed peaks is shown under the density curve in the right panel. d Overall percentage of accessible chromatin sites in aged vs young ECs from sham mice, and in injured young and injured aged ECs vs young sham. e Genomic distribution of differentially accessible regions between young and aged lung ECs. The majority of differentially accessible sites were in introns and intergenic regions.
Fig. 2
Fig. 2. Motif analysis identifies ERG as a putative driver of lung vascular repair.
a, b De novo DNA motif analysis identifies ERG enrichment in more than 50% of differentially accessible chromatin sites in aged lung ECs relative to young ones. c In aged lung ECs ERG motif was associated with chromatin regions that exhibited reduced accessibility. d, e ERG enrichment was also observed in differentially accessible chromatin regions in young lung ECs following bleomycin challenge. f In young lung ECs ERG motif was associated with chromatin regions that exhibited increased accessibility. g, h Similarly to young lung ECs, ERG motif was also enriched in aged lung ECs following bleomycin challenge. i As opposed to young lung ECs, injured aged lung ECs exhibited ERG enrichment in chromatin areas with reduced accessibility. Motifs displayed in a, d, g were ranked by p value. j Representative ERG-target genes associated with differentially accessible chromatin regions in aged vs young lung ECs, and in injured young (k) and in injured aged lung ECs (l) relative to uninjured young lung ECs. ATAC-seq peaks associated with genes displayed in j, k, l were identified by a p value ≤0.05.
Fig. 3
Fig. 3. RNA-seq analysis identifies unique transcriptional signatures in lung ECs during aging.
a Principal components analysis (PCA) of RNA-seq data from freshly sorted lung ECs isolated from young and aged mice either sham or 30 following bleomycin (Young Sham 2-month-old, N = 5; Young Bleo 2-month-old, N = 4; Aged Sham 18-month-old, N = 3; Aged Bleo 18-month-old, N = 4). b, c Ingenuity pathway analysis shows canonical pathways and upstream regulators enriched in aged lung ECs relative to young ones. P values were generated in IPA using Fisher’s test (log2 FC ≤−0.5 or ≥0.5, p value ≤0.05). p value and activation z-score were used for plotting canonical pathways and activated upstream regulators respectively. df Heatmaps showing differentially expressed gene signatures (innate immunity, oxidative stress, and endothelial lineage) in aged lung ECs relative to young ones in absence of injury (log2 FC ≥0.5 and FDR <0.05). A colored scale was used to display upregulated (blue) and downregulated (orange) genes. g Scatter plot showing the correlation between promoter accessibility and gene expression. Red dots indicate ERG targets. ATAC-seq peaks with a p value ≤0.05 and genes detected by RNA-seq with log2 FC ≤−0.5 or ≥0.5 and FDR ≤0.05 were plotted to compare the differentially accessible peaks and differentially expressed genes. Source data is provided as a Source Data file. h Genomic snapshots showing reduced chromatin accessibility of ERG-target genes with aging. i Histograms of RNA expression RPKM values showing reduced transcription of ERG-target genes with aging (Young Sham 2-month-old n = 5; Aged Sham 18-month-old n = 3). Values are summarized as mean and SD. Source data is provided as a Source Data file. j, k qPCR analyses of selected genes from RNA-seq demonstrated that ERG silencing in human lung microvascular ECs (HLMECs) recapitulated the gene expression signature observed in aging, including increased expression of inflammatory and innate immunity genes and reduced expression of endothelial genes (N = 3 independent experiments). Values are summarized as mean and SD and statistical analysis is performed using a two-tailed Student’s t-test. Source data is provided as a Source Data file. *P < 0.05, **P < 0.01, ***P < 0.001.
Fig. 4
Fig. 4. RNA-seq analysis identifies maladaptive transcriptional responses of aged lung ECs to injury.
a Venn Diagrams showing upregulated and downregulated genes in young and aged lung ECs following bleomycin delivery. b, c Volcano plots showing the distribution of differentially expressed genes based on fold changes and significance between young Bleo and young Sham and between aged Bleo and young Sham. Red dots represent the highest expressed and most significant genes in injured lung ECs compared to uninjured ones. d, e Pathway analysis identifies the top differentially regulated canonical pathways in injured young and injured aged lung ECs relative to uninjured ones. Vascular remodeling pathways were enriched in injured young lung ECs relative to uninjured ones whereas inflammation and fibrosis pathways were enriched in injured aged lung ECs relative to uninjured ones (data in the graphs are displayed as p value). p values for canonical pathways were generated in IPA using Fisher’s test. Log(p values) ≤−0.5 or ≥0.5 (p value ≤0.05) is being used for plotting noteworthy canonical pathways and activated upstream regulators respectively. fh Heatmaps showing differentially expressed angiogenic gene signatures (proliferation, cytoskeleton & cell migration, and basement membrane) in young and aged lung ECs relative to uninjured young ones (log2 FC ≥0.5 and FDR <0.05). A colored scale was used to display upregulated (yellow) and downregulated (blue) genes. i, j Scatter plots showing the correlation between promoter accessibility and gene expression. Red dots indicate ERG targets. RNA-seq cutoff: log2 FC ≤−0.5 or ≥0.5 and FDR ≤0.05, ATAC-seq cutoff: p value ≤0.05. Source data is provided as a Source Data file. k Genomic snapshots showing comparable chromatin accessibility of proliferation genes between young and aged lung ECs post-injury. l, m Genomic snapshots showing increased chromatin accessibility in ERG-target genes associated with vascular remodeling and angiogenesis in injured young EC. On the contrary, no changes in chromatin accessibility for these genes were observed in injured aged lung ECs.
Fig. 5
Fig. 5. ERG silencing in HLMECs cells impairs angiogenesis and enhances the secretion of fibrogenic mediators.
a Effect of ERG-siRNA on VEGFA induced in vitro angiogenesis. Representative fields are shown. Quantitative analysis of tube formation was indicated as the total number of junctions and total vessel length. Image analysis in the whole photographed area were performed by using the software AngioTool. N = 3 independent experiments. Values are summarized as mean and SD and analyzed using a two-tailed Student’s t-test. Source data is provided as a Source Data file. Scale bar: 50 μm. b Immunofluorescence staining shows reduction of VE-Cadherin and loss of cellular junctions (arrows) in ERG-silenced HLMECs compared to control cells. A representative image of n = 3 independent experiments is shown. Scale bar: 50 μm. c Quantitative PCR analysis in ERG-silenced HLMECs compared to control cells. N = 3 independent experiments. Values are summarized as mean and SD and analyzed using a two-tailed Student’s t-test. Source data is provided as a Source Data file. d HLMECs were transfected prior to CM collection and transferred to recipient nHLFs. e qPCR analysis of recipient nHLF exposed to ERG-siRNA derived CM compared to cells exposed to control siRNA derived CM (N = 3 independent experiments). Values are summarized as mean and SD and analyzed using a one-way analysis of variance followed by Tukey’s post hoc test. Source data is provided as a Source Data file. f Western blotting analysis of nHLs recipient cells exposed to ERG-siRNA derived CM compared to control siRNA derived CM. N = 1 experiment. g ECM deposition assay in nHLFs exposed to ERG-siRNA derived CM compared to cells exposed to control siRNA derived CM (N = 4 independent experiments, analyzed using two-tailed Student’s t-test). Values are summarized as mean and SD. Source data is provided as a Source Data file. h Workflow employed for the analysis of the secretome in CM collected from control or ERG-silenced HLMECs (created with BioRender.com). i List of secreted proteins from control or ERG-silenced HLMECs ranked by their abundance ratio ERG/control. CM from three independent experiments was pulled and subjected to mass spectrometry. Source data is provided as a Source Data file. *P < 0.05, **P < 0.01, ***P < 0.001.
Fig. 6
Fig. 6. Conditional deletion of ERG in ECs promotes pulmonary vascular leak, vessel remodeling, and lung inflammation.
a Representative images of lung sections from control and Erg CKO animals (young mice, 2-month-old) after tamoxifen injections, stained with an anti-ERG antibody (red) and co-stained with an anti-CD31 antibody (blue) to evaluate Erg deletion in lung ECs (WT n = 6; CKO n = 5). Scale bar: 20 μM. b Vessel permeability assessed by i.v. injection of Evans blue (WT n = 5; CKO n = 3). Values are summarized as mean and SD and analyzed using a two-tailed Student’s t-test. Source data are provided as a Source Data file. c FACS analysis of the whole CD45+ population and the overall fractions of CD45+/CD11b+/Ly6G+ neutrophils in mouse lungs from WT and ERG CKO mice (WT n = 6; CKO n = 5). Values are summarized as mean and SD and analyzed using a two-tailed Student’s t-test. Source data are provided as a Source Data file. d Representative images of mouse lung sections were captured from WT and ERG CKO animals (WT n = 6; CKO n = 5). DAPI (blue) and the neutrophil marker MPO (red). Scale bar: 20 μm. e Transcriptional analysis of whole lung homogenates obtained from WT and ERG CKO mice (WT n = 3; CKO n = 3). Values are summarized as mean and SD and analyzed using a two-tailed Student’s t-test. Source data are provided as a Source Data file. f Hydroxyproline assessment in WT and ERG CKO animals in the absence of injury (45 days after last tamoxifen injection) (WT n = 5; CKO n = 6). Values are summarized as mean and SD and analyzed using a two-tailed Student’s t-test. Source data is provided as a Source Data file. g Representative images of Masson’s Trichrome staining in lung sections from control and Erg CKO mice in the absence of injury, 45 days after last tamoxifen injection (WT n = 5; CKO n = 6). Scale bar: 100 μM.
Fig. 7
Fig. 7. Loss of endothelial ERG impairs lung capillary regeneration and fibrosis resolution in young mice.
a Schematic showing the experimental workflow to evaluate the effect of ERG deletion on bleomycin-induced lung fibrosis. b, c Lung weight and hydroxyproline assessments in WT and in ERG CKO animals (young mice, 2-month-old). Values are summarized as mean and SD and analyzed using one-way analysis of variance (followed by Tukey’s post hoc test) (WT n = 8; WT + tamoxifen n = 5; WT + bleomycin+tamoxifen n = 6; CKO + bleomycin+tamoxifen n = 10). Source data are provided as a Source Data file. d Representative images of H&E (scale bar: 100 μM) and Masson’s Trichrome (scale bar: 50 μM) staining in lung sections from WT and ERG CKO mice 45 days after bleomycin delivery (WT n = 8; WT + tamoxifen n = 5; WT + bleomycin+tamoxifen n = 6; CKO + bleomycin+tamoxifen n = 10). e Representative images of mouse lung sections were captured from control and Erg CKO animals. Top panel: DAPI (blue), ERG (white), CD31 (green), and αSMA (red); bottom panel: DAPI (blue), Collagen IV (green), Laminin IV (red) (WT n = 8; WT + tamoxifen n = 5; WT + bleomycin+tamoxifen n = 6; CKO + bleomycin+tamoxifen n = 10). Scale bar 20 μM.
Fig. 8
Fig. 8. ERG-deficient mouse lungs manifest capillary abnormalities and fibrogenic features resembling aged and IPF lungs.
a Schematic showing the experimental strategy to perform scRNA-seq analysis. bd Wild type, Erg CKO, and combined t-SNE visualization to identify subpopulations. Colors denote corresponding clusters (N = 2). e Percent of aCAP, intermediate, and gCAP endothelial cells of total endothelial cells. Source data are provided as a Source Data file. f Violin plots of gCAP and aCAP gene expression in each endothelial cell population. g Venn Diagrams showing the comparison between the RNA-seq (Young vs Aged) and the scRNA-seq of ERG-deficient lung ECs (RNA-seq cutoff: log 2FC ≤−0.5 or ≥0.5 and FDR ≤0.05; scRNA-seq cutoff: log 2FC ≤−1 or ≥1 and FDR ≤0.001). h, i UMAP of endothelial cells from the publicly available dataset of normal and IPF lungs. j Percent of endothelial cell subpopulations of total ECs in normal (n = 3 independent samples) and IPF (n = 3 independent samples) lungs. Source data is provided as a Source Data file. k Representative images of human lung sections were captured from control and IPF lungs. DAPI (blue) and the human gCap EC marker CD93 (red). Scale bar 100 μM. l Violin plot of the expression of the human gCap EC markers CD36, GPIHBPI, BTNL9, and TEK in normal and IPF lungs. Values are summarized as mean and SD.

References

    1. Jambusaria, A. et al. Endothelial heterogeneity across distinct vascular beds during homeostasis and inflammation. Elife10.7554/eLife.51413 (2020). - PMC - PubMed
    1. Rafii S, Butler JM, Ding BS. Angiocrine functions of organ-specific endothelial cells. Nature. 2016;529:316–325. - PMC - PubMed
    1. Ungvari Z, Tarantini S, Donato AJ, Galvan V, Csiszar A. Mechanisms of vascular aging. Circ. Res. 2018;123:849–867. - PMC - PubMed
    1. Xu X, et al. Age-related impairment of vascular structure and functions. Aging Dis. 2017;8:590–610. - PMC - PubMed
    1. Evans CE, Iruela-Arispe ML, Zhao YY. Mechanisms of endothelial regeneration and vascular repair and their application to regenerative medicine. Am. J. Pathol. 2021;191:52–65. - PMC - PubMed

Publication types