. 2022 Jul 25;13(1):4293.
doi: 10.1038/s41467-022-31986-x.

A facile way to construct sensor array library via supramolecular chemistry for discriminating complex systems

Affiliations

A facile way to construct sensor array library via supramolecular chemistry for discriminating complex systems

Jia-Hong Tian et al. Nat Commun. .

Abstract

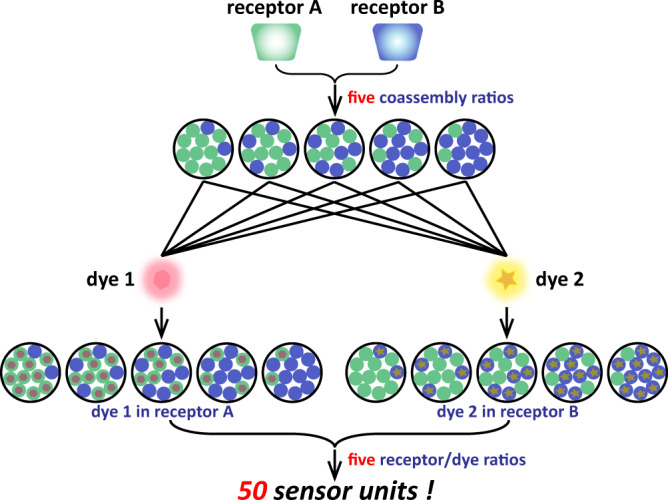
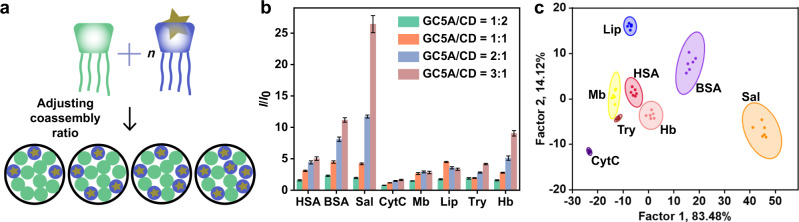
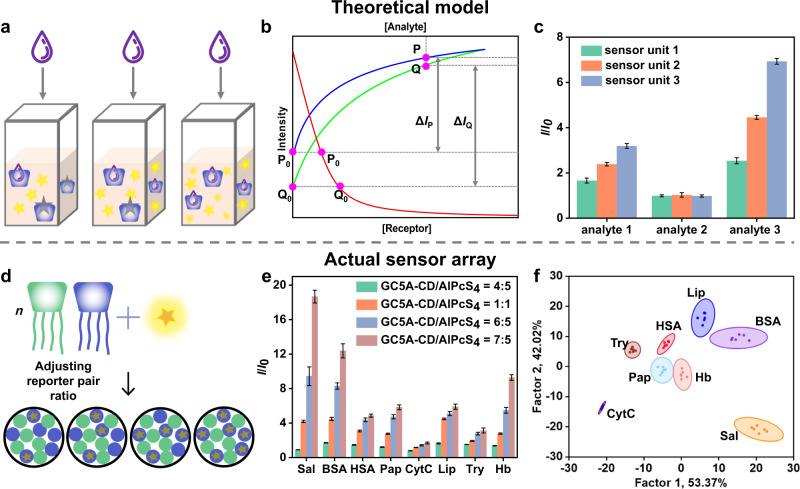
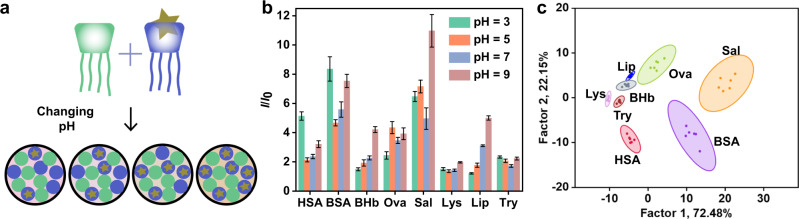
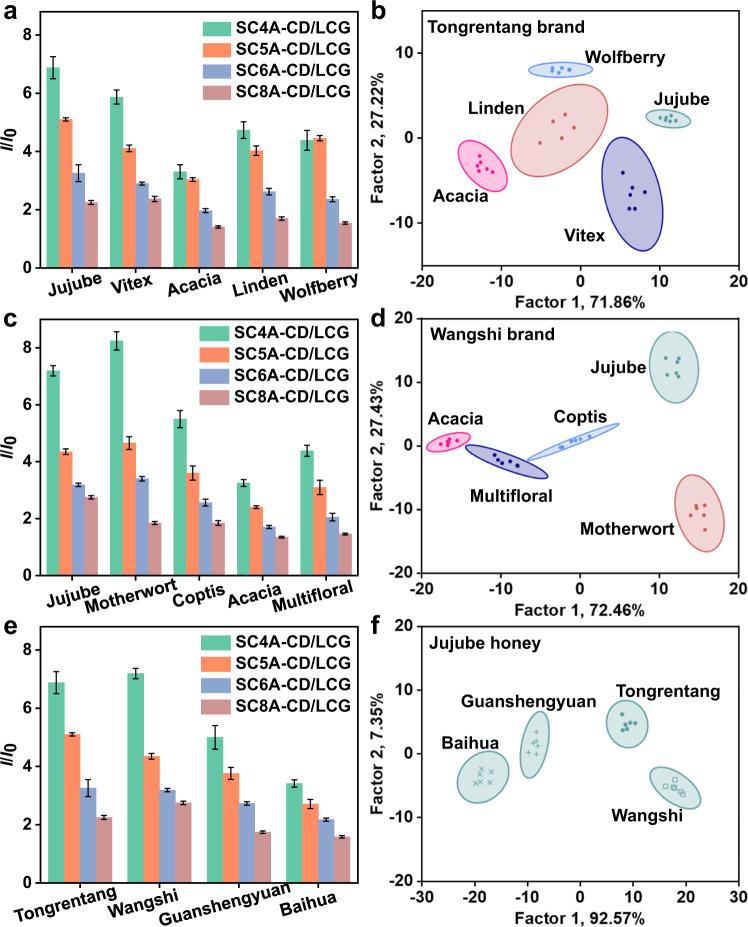
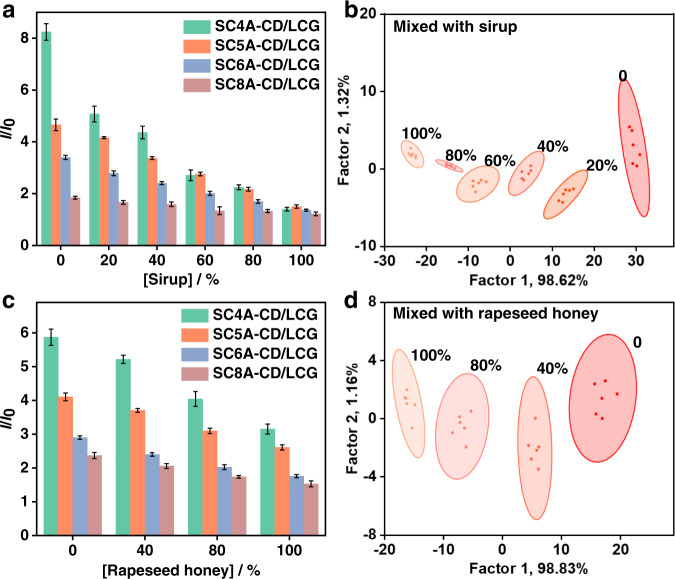
Differential sensing, which discriminates analytes via pattern recognition by sensor arrays, plays an important role in our understanding of many chemical and biological systems. However, it remains challenging to develop new methods to build a sensor unit library without incurring a high workload of synthesis. Herein, we propose a supramolecular approach to construct a sensor unit library by taking full advantage of recognition and assembly. Ten sensor arrays are developed by replacing the building block combinations, adjusting the ratio between system components, and changing the environment. Using proteins as model analytes, we examine the discriminative abilities of these supramolecular sensor arrays. Then the practical applicability for discriminating complex analytes is further demonstrated using honey as an example. This sensor array construction strategy is simple, tunable, and capable of developing many sensor units with as few syntheses as possible.


Conflict of interest statement

The authors declare no competing interests.

Figures

Fig. 1
Fig. 1. Formation of 50 sensor units utilizing two receptors and two dyes.
First, changing the coassembly ratio produces five different coassembled receptors. Then, the two dyes are separately introduced into this system to give 10 sensor units. Finally, by using five receptor/dye ratios in each sensor unit, 50 sensor units are prepared. The supramolecular sensor arrays can discriminate analytes based on the different binding affinities between receptors/analytes and receptors/dyes, as well as the nonlinear relationship between the fluorescence intensity and the analyte concentrations.
Fig. 2
Fig. 2. Chemical structures of CD, CAs, and dyes.
Chemical structures of the employed CA (GCnAs, QCnAs, and SCnAs) and CD hosts, and the reporter dyes (LCG, 2,6-TNS, PTPE, AlPcS4, TPPS, and 1,8-ANS) in this work.
Fig. 3
Fig. 3. Construction and experimental results of sensor array based on different reporter pairs.
a Schematic diagram of SA1. Pattern recognition of proteins using SA1 ([CA] = [CD] = 1.0 μM, [dye] = 1.0 μM). b Fluorescence response patterns of SA1 against various proteins (23.8 μg/mL for each protein). The order of colored symbols from top to bottom in the legend corresponds to the column order of histogram from left to right. c Canonical score plot for the two factors of simplified fluorescence response patterns obtained from LDA with 95% confidence ellipses. All experiments were performed in water (pH = 6.53) and pH only slightly changed after the addition of proteins (Supplementary Table 2). The fluorescence spectra of dyes were recorded and kept almost unchanged in the presence of NaClO4 (up to 27.5 mM, Supplementary Fig. 26) in order to exclude the effect of ionic strength. Error bars in b represent mean ± s.d. (n  =  6 independent experiments).
Fig. 4
Fig. 4. Construction and experimental results of sensor array based on dye replacement.
a Schematic diagram of SA3. Pattern recognition of proteins using SA3 ([GC5A] = [CD] = 1.0 μM, [dye] = 1.0 μM). b Fluorescence response patterns of SA3 against various proteins (23.8 μg/mL for each protein). The order of colored symbols from top to bottom in the legend corresponds to the column order of histogram from left to right. c Canonical score plot for the two factors of simplified fluorescence response patterns obtained from LDA with 95% confidence ellipses. Error bars in b represent mean ± s.d. (n  =  6 independent experiments).
Fig. 5
Fig. 5. Construction and experimental results of sensor array based on adjusting coassembly ratio.
a Schematic diagram of SA5. Pattern recognition of proteins using SA5 ([GC5A]/[CD] = 0.5/1.0 μM, 1.0/1.0 μM, 2.0/1.0 μM, and 3.0/1.0 μM, [AlPcS4] = [GC5A]). b Fluorescence response patterns of SA5 against various proteins (23.8 μg/mL for each protein). The order of colored symbols from top to bottom in the legend corresponds to the column order of histogram from left to right. c Canonical score plot for the two factors of simplified fluorescence response patterns obtained from LDA with 95% confidence ellipses. Error bars in b represent mean ± s.d. (n  =  6 independent experiments).
Fig. 6
Fig. 6. Construction, theoretically model, and experimental results of sensor array based on adjusting reporter pair ratio.
a Schematic diagram of the theoretical model of sensor array formed by adjusting the reporter pair ratios. b Schematic simulated titration curves for direct binding and competitive binding. c Fluorescence response patterns of the simulated sensor array. d Schematic diagram of SA7. Pattern recognition of proteins using SA7 ([GC5A] = [CD] = 0.8 μM, 1.0 μM, 1.2 μM, and 1.4 μM, [AlPcS4] = 1.0 μM). e Fluorescence response patterns of the sensor array against various proteins (23.8 μg/mL for each protein). f Canonical score plot for the two factors of simplified fluorescence response patterns obtained from LDA with 95% confidence ellipses. Error bars in c, e represent mean ± s.d. (n  =  6 random numbers and independent experiments). The order of colored symbols from top to bottom in the legend corresponds to the column order of histogram from left to right in c, e.
Fig. 7
Fig. 7. Construction and experimental results of sensor array based on changing the environmental factor.
a Schematic diagram of SA9. Pattern recognition of proteins using SA9 ([GC5A] = [CD] = 1.0 μM, [AlPcS4] = 1.0 μM). b Fluorescence response patterns of the sensor array against various proteins (23.8 μg/mL for each protein). The order of colored symbols from top to bottom in the legend corresponds to the column order of histogram from left to right. c Canonical score plot for the two factors of simplified fluorescence response patterns obtained from LDA with 95% confidence ellipses. Error bars in b represent mean ± s.d. (n  =  6 independent experiments).
Fig. 8
Fig. 8. Discrimination of honey samples from different flora origins and brands.
a Fluorescence response patterns and b canonical score plot for Tongrentang brand samples. c Fluorescence response patterns and d canonical score plot for Wangshi brand samples. e Fluorescence response patterns and f canonical score plot for jujube honey samples (3.0 mg/mL for each honey sample). Pattern recognition of honey samples using SA11 ([CA] = [CD] = 1.0 μM, [LCG] = 1.0 μM). Canonical score plots for the two factors of simplified fluorescence response patterns obtained from LDA with 95% confidence ellipses. Error bars in a, c, e represent mean ± s.d. (n  =  6 independent experiments). The order of colored symbols from top to bottom in the legend corresponds to the column order of histogram from left to right in a, c, e.
Fig. 9
Fig. 9. Discrimination of honey samples mixed with sirup or cheaper honey.
a Fluorescence response patterns and b canonical score plot against mixtures of honey and sirup. c Fluorescence response patterns and d canonical score plot against mixtures of honey and sirup against mixtures of vitex and rapeseed honey (3.0 mg/mL for each mixture sample). Pattern recognition of honey samples using SA11 ([CA] = [CD] = 1.0 μM, [LCG] = 1.0 μM). Canonical score plots for the two factors of simplified fluorescence response patterns obtained from LDA with 95% confidence ellipses. Error bars in a, c represent mean ± s.d. (n  =  6 independent experiments). The order of colored symbols from top to bottom in the legend corresponds to the column order of histogram from left to right in a, c.

Similar articles

Cited by

References

    1. Albert KJ, et al. Cross-reactive chemical sensor arrays. Chem. Rev. 2000;100:2595–2626. doi: 10.1021/cr980102w. - DOI - PubMed
    1. Freudenberg J, Hinkel F, Jänsch D, Bunz UHF. Chemical tongues and noses based upon conjugated polymers. Top. Curr. Chem. 2017;375:67. doi: 10.1007/s41061-017-0155-2. - DOI - PubMed
    1. Geng Y, Peveler WJ, Rotello VM. Array-based “chemical nose” sensing in diagnostics and drug discovery. Angew. Chem. Int. Ed. 2019;58:5190–5200. doi: 10.1002/anie.201809607. - DOI - PMC - PubMed
    1. Liu M, et al. A star-nose-like tactile-olfactory bionic sensing array for robust object recognition in non-visual environments. Nat. Commun. 2022;13:79. doi: 10.1038/s41467-021-27672-z. - DOI - PMC - PubMed
    1. Peveler WJ, Yazdani M, Rotello VM. Selectivity and specificity: pros and cons in sensing. ACS Sens. 2016;1:1282–1285. doi: 10.1021/acssensors.6b00564. - DOI - PMC - PubMed

Publication types