. 2022 Jul 25;13(1):4268.
doi: 10.1038/s41467-022-31981-2.

Integrin α3β1 promotes vessel formation of glioblastoma-associated endothelial cells through calcium-mediated macropinocytosis and lysosomal exocytosis

Affiliations

Integrin α3β1 promotes vessel formation of glioblastoma-associated endothelial cells through calcium-mediated macropinocytosis and lysosomal exocytosis

Eunnyung Bae et al. Nat Commun. .

Abstract

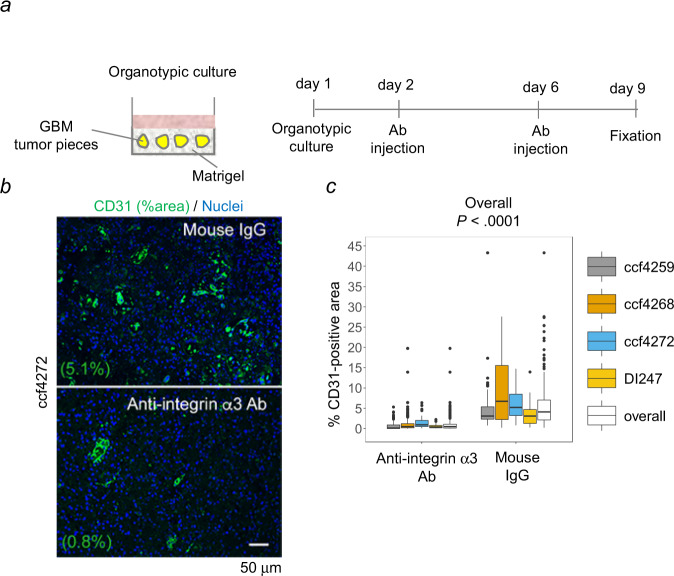
Therapeutic targeting of angiogenesis in glioblastoma has yielded mixed outcomes. Investigation of tumor-associated angiogenesis has focused on the factors that stimulate the sprouting, migration, and hyperproliferation of the endothelial cells. However, little is known regarding the processes underlying the formation of the tumor-associated vessels. To address this issue, we investigated vessel formation in CD31+ cells isolated from human glioblastoma tumors. The results indicate that overexpression of integrin α3β1 plays a central role in the promotion of tube formation in the tumor-associated endothelial cells in glioblastoma. Blocking α3β1 function reduced sprout and tube formation in the tumor-associated endothelial cells and vessel density in organotypic cultures of glioblastoma. The data further suggest a mechanistic model in which integrin α3β1-promoted calcium influx stimulates macropinocytosis and directed maturation of the macropinosomes in a manner that promotes lysosomal exocytosis during nascent lumen formation. Altogether, our data indicate that integrin α3β1 may be a therapeutic target on the glioblastoma vasculature.


Conflict of interest statement

The authors declare no competing interests.

Figures

Fig. 1
Fig. 1. Elevated numbers of tubes and sprouts formed by TECs as compared to NECs and more rapid tube formation in TECs.
a, b NECs (422) and TECs (isolate ccf2687) were cultured for 48 h in collagen gels as described in Methods. Representative images are shown in a, b is the corresponding statistical analysis by two-sided Wilcoxon rank-sum tests. Yellow arrows denote tubes. n = 6 different fields in each group. c, d NECs (623) and TECs (isolate ccf2445) were cultured on Matrigel for 24 h or 48 h. Representative images are shown in c, d is the corresponding statistical analysis by two-sided Wilcoxon rank-sum tests. Yellow arrows denote tubes and red arrows denote sprouts. For tube numbers, n = 12 different fields in each group; and for sprout numbers, n = 6 different fields in each group. Red and black bars in b, d indicate means with 95% confidence intervals. e Live video microscopy of NECs (376) and TECs (isolate ccf2515) over the first 9 h of culture on Matrigel. Representative images are shown. f Immunofluorescent staining of laminin α5 chain (sc-16592; Alexa-Fluor-594; red) in the basement membrane of tubes formed by NECs (376 and 422) and TECs (isolates ccf2445 and ccf2566) on Matrigel for 12 and 24 h. Cell nuclei stained with DAPI (blue). Independent experiments were performed at least two times with similar results. Source data are provided as a source data file.
Fig. 2
Fig. 2. Expression of the integrin α3 subunit is elevated in TECs from human glioblastoma compared to NECs.
a, b Total RNA was extracted from 3 NECs (376, 422, and 623) and 3 TECs (isolates cw880, ccf2352, and ccf2390) when similar densities of tubes had formed on Matrigel, and c, d from monolayers of 6 TECs (cw850, cw880, ccf2277, ccf2352, ccf2388, and ccf2390) and 3 NECs (375, 422, and 623), followed by gene expression microarray (HG-U219). a, c Genes upregulated over 2-fold in TECs compared to NECs were subject to gene set enrichment and pathway analysis using DAVID Bioinformatics Resources 6.8 (https://david.ncifcrf.gov), where p-values were calculated by Fisher’s exact test. b, d Expression profiles of integrins and genes relevant to angiogenesis both on Matrigel and in monolayer are shown as heatmaps; p-values were obtained by two-sided exact-Wilcoxon-rank-sum tests, without adjustment for multiple comparisons. e Cell lysates derived from the same experiment with monolayers of NECs (623, 376, and 422) and TECs (ccf2445, ccf2566, and ccf2515) were subjected to western blot analysis with the indicated antibodies in parallel. f Representative confocal images of integrin α3 staining of tubes formed by NECs (376) or TECs (ccf2566) plated on Matrigel (24 h). Graph represents the integrated densities of integrin α3-immunofluorescence. g Paraffin sections of human GBM and normal brain (NB) samples were double-labeled for integrin α3 and vwf, followed by DAPI staining. Representative images shown. Colocalization of the integrin α3 signal with the vwf signal for GBM-sections was 86%, based on the Manders’ Coefficient (M1 = 0.863; M2 = 0.515). h Human GBM tissue arrays containing NB were double-labeled for vwf and integrin α3, CD151, or integrin α6. Statistical analysis: two-sided Wilcoxon-rank-sum-tests; red lines denote means and black lines denote 95% confidence intervals. i Tumor sections from mouse glioma were double-labeled by immunofluorescence for integrin α3, CD151, or integrin α6 and CD31. Average fluorescence intensities of integrin α3, CD151, or integrin α6 on CD31-positive pixels/field were obtained from tumor or adjacent NB using ImageJ and represented as boxplots. Boxes indicate first and third quartiles, bands indicate medians, and whiskers indicate ±1.5 interquartile range. Statistical analysis: linear mixed model; red bars, means. (h, i) On the x axis, n = number of different fields. eg Independent experiments were performed at least two times with similar results. Source data are provided as a source file.
Fig. 3
Fig. 3. A function blocking antibody directed towards integrin α3β1 significantly reduces tube and sprout formation by TECs.
a, c NECs (623) or TECs (isolate ccf2445) were incubated with function blocking antibodies towards the integrin α3 subunit or integrin α6 subunit, or control IgG (mouse IgG or rat IgG) at 5 µg/ml when plated on growth factor-reduced Matrigel in M199 medium +10% FBS for 43 h. Representative images are shown. b, d The mean numbers of tubes or sprouts in the mouse IgG or rat IgG-treated group are represented as 100%. Dot plots show % mean of the numbers of tubes or sprouts (red lines) and the 95% confidence interval (black lines). Statistical analyses: two-sided Wilcoxon-rank-sum tests. Independent experiments were performed at least two times with similar results. n denotes the number of different fields. b The n for tubes: NECs, n = 12 for mouse IgG and n = 10 for anti-integrin α3; and TECs, n = 12 for mouse IgG and n = 11 for anti-integrin α3. The n for sprouts: TECs, n = 6 for mouse IgG and n = 6 for anti-integrin α3. d The n for tubes: NECs, n = 12 for rat IgG and n = 12 for anti-integrin α6; and TECs, n = 12 for rat IgG and n = 12 for anti-integrin α6. The n for sprouts: TECs, n = 6 for rat IgG and n = 6 for anti-integrin α6. Source data are provided as a source data file.
Fig. 4
Fig. 4. A function blocking antibody directed towards integrin α3β1 reduces blood vessel density in GBM tumors in organotypic culture.
a Schematic diagram of the experimental procedure. Briefly, GBM tumors (ccf4259, ccf4268, ccf4272, and DI247) cut into ~4 mm in diameter were cultured in Matrigel in neurobasal medium supplemented with 1 ng/ml EGF and 1 ng/ml bFGF. On day 2, anti-integrin α3 subunit blocking antibody or control mouse IgG was injected at three places per tumor piece to achieve ~5 µg/ml in tumor volume. The same injection was repeated on day 6. On day 9, tumors were fixed in 10% formalin and paraffin-embedded. Sections were labeled with rabbit anti-CD31 antibody and Alexa-Fluor-488 goat anti-rabbit IgG, followed by DAPI nuclear stain and imaging. b Representative immunofluorescent images from organotypic culture of tumor ccf4272 are shown. c Percent CD31-positive area per field was obtained by image processing using ImageJ. n denotes the number of different fields, for ccf4269, n = 44 for mouse IgG and n = 95 for anti-integrin α3; for ccf4268, n = 39 for mouse IgG and n = 103 for anti-integrin α3; for ccf4272, n = 57 for mouse IgG and n = 82 for anti-integrin α3; for DI-247, n = 59 for mouse IgG and n = 88 for anti-integrin α3. The boxes indicate the first and third quartiles, bands indicate medians, and the whiskers indicate ±1.5 interquartile range. A linear mixed model was used for statistical analysis (p < 0.001). Source data are provided as a source data file.
Fig. 5
Fig. 5. Macropinocytosis promoted by integrin α3β1/CD151 is higher in TECs and inhibition of macropinocytosis reduces tube formation.
a NECs (422 and 623) and TECs (isolates ccf3889, DI-167, and DI-337) were incubated with 25 µg/ml TMR-dex for 30 min, followed by imaging. n denotes the number of different fields: NECs, n = 20 for 422 and n = 20 for 623; and TECs, n = 30 for each isolate. Representative images are shown. Macropinocytosis Index was defined as (total TMR-dex area/total cell area) x 100 per field and Macropinosome Number was defined as the average number of macropinosomes in a cell per field. Statistical analysis: two-sided Wilcoxon-rank-sum tests. Correlation between Macropinocytosis Index and Macropinosome Number was analyzed by linear regression model after adjusting for group effect; shaded area in the correlation graph represents the 95% confidence band for the regression line. b TECs (isolate ccf2390) treated with DMSO (vehicle-control; n = 11) or 100 nM EIPA (n = 11) for 10 min were subsequently incubated with TMR-dex for 30 min, followed by imaging. Statistical analysis: two-sided Wilcoxon-rank-sum test. c Tube formation of TECs (isolates cf2390 and ccf2687) was quantitated by the numbers of tubes formed per field on Matrigel after 6 h in M199 + 10% FBS in the presence of DMSO (vehicle-control; n = 18 for ccf2390, and n = 18 for ccf2687) or 50 nM EIPA (n = 18 for ccf2390, and n = 18 for ccf2687). Statistical analysis: two-sided Wilcoxon-rank-sum test. d, e TECs (isolate ccf2390) were pretreated for 3 h with blocking antibody toward integrin α3 (n = 23) or mouse IgG (n = 23) and TECs (isolate DI-102) were pretreated with blocking antibody toward CD151 (n = 11) or mouse IgG (n = 9), and then TECs were incubated for 30 min with TMR-dex. Statistical analysis: two-sided Wilcoxon-rank-sum test. f Shown are immunoblots of integrin α3 and CD151 from TECs (isolate ccf3889) at 48 h after transfection with siRNA for integrin α3 or CD151. These immunoblots were performed at least two times, and cell lysate samples loaded in separate lanes were from independent replicates. At 48 h after transfection with siRNA, TECs (isolate ccf3889) were incubated with TMR-dex for 15 min. n = number of different fields: integrin α3, n = 16 for siintegrin α3-1 and n = 16 for siintegrin α3-2; CD151, n = 17 for siCD151; and control siRNA, n = 16. Representative images are shown. Statistical analysis: Dunn-method for pairwise-comparisons between each siRNA with ConRi. Boxes indicate the first and third quartiles, bands indicate medians, and whiskers indicate ±1.5 interquartile range. Dotted lines denote means in af. Source data are provided as a source data file.
Fig. 6
Fig. 6. Ca2+-mediated macropinocytosis and lysosomal exocytosis are part of the tube formation process, and are enhanced by integrin α3β1 through Ca2+-influx.
a LAMP1 was labelled after TECs (isolate ccf2390) were incubated with 25 µg/ml TMR-dex for 3 h at 37 °C, followed by fixation and permeabilization. Representative images shown; yellow arrows indicate TMR-dex and LAMP1 co-localization. Colocalization was 99% based on the Manders’ Coefficient (M1 = 0.999; M2 = 0.058). Independent experiments were performed at least two-times with similar results. b Experimental-procedure schematic for c, d. Adherent TECs (isolate ccf3889) were incubated with 100 µg/ml TMR-dex for 15 min at 37 °C, washed, harvested, labeled with 5 µg/ml Alexa-Fluor-647-conjugated-WGA in suspension, washed and plated on Matrigel for 20 h. Representative 3-D (c) and cross-sectional (d) images of tubes. e, f Adherent TECs (isolate ccf2390) were incubated with 100 µg/ml TMR-dex for 15 min at 37 °C, washed, harvested, and plated on Matrigel for 3 h with (n = 12) or without 0.5 mM EGTA (n = 10) (e), or in the presence of mouse IgG (n = 21) or integrin α3 antibody (n = 21) (f), followed by fixation and labeling with the LAMP1 mAb, H4A3. g TECs (isolate ccf3889) either in DMEM + 5% FBS (control media) or in calcium-free media were treated with (n = 20) or without 0.5 mM EGTA (n = 20) for 15 min, and then incubated with 100 µg/ml TMR-dex for 15 min at 37 °C, and fixed. Representative images are shown for panels eg. h TECs (isolate ccf3889) in DMEM + 5% FBS were incubated on Matrigel with (n = 36) or without 0.5 mM EGTA (n = 36) for 18 h. g, h Statistical analysis: two-sided Wilcoxon-rank-sum tests. n = number of different fields. Boxes indicate first and third quartiles, bands indicate medians, and whiskers indicate ±1.5 interquartile range. Dotted lines denote means. i, j Increase of intracellular Ca2+ by extracellular Ca2+ influx was measured by fluorescence intensity of Fluo-8 (Ex/Em = 490/525). To deplete intracellular calcium storage, TECs (isolate DI-102) were treated with 1 µM of Thapsigargin (TH) before addition of extracellular CaCl2 to the medium. Data points indicate means of 3-replicates, and bars denote standard errors. j TECs (isolate DI-102) were preincubated with mouse IgG or blocking anti-integrin α3 antibody, followed by addition of TH and CaCl2. Statistical analysis: linear mixed model. k Proposed TEC tube-formation model. TEC tube-formation mechanism requires macropinocytosis and lysosomal exocytosis. Source data are provided as a source data file.

References

    1. Gladson CL, Prayson RA, Liu WM. The pathobiology of glioma tumors. Annu Rev. Pathol. 2010;5:33. doi: 10.1146/annurev-pathol-121808-102109. - DOI - PMC - PubMed
    1. Batchelor TT, Reardon DA, de Groot JF, Wick W, Weller M. Antiangiogenic therapy for glioblastoma: current status and future prospects. Clin. Cancer Res. 2014;20:5612–5619. doi: 10.1158/1078-0432.CCR-14-0834. - DOI - PMC - PubMed
    1. Wolburg H, Noell S, Fallier-Becker P, Mack AF, Wolburg-Buchholz K. The disturbed blood-brain barrier in human glioblastoma. Mol. Asp. Med. 2012;33:579–589. doi: 10.1016/j.mam.2012.02.003. - DOI - PubMed
    1. Betz C, Lenard A, Belting HG, Affolter M. Cell behaviors and dynamics during angiogenesis. Development. 2016;143:2249–2260. doi: 10.1242/dev.135616. - DOI - PubMed
    1. Davis GE, Stratman AN, Sacharidou A, Koh W. Molecular basis for endothelial lumen formation and tubulogenesis during vasculogenesis and angiogenic sprouting. Int Rev. Cell Mol. Biol. 2011;288:101–165. doi: 10.1016/B978-0-12-386041-5.00003-0. - DOI - PMC - PubMed

Publication types