

Population-based screening for celiac disease reveals that the majority of patients are undiagnosed and improve on a gluten-free diet
- PMID: 35879335
- PMCID: PMC9314380
- DOI: 10.1038/s41598-022-16705-2
Population-based screening for celiac disease reveals that the majority of patients are undiagnosed and improve on a gluten-free diet
Abstract
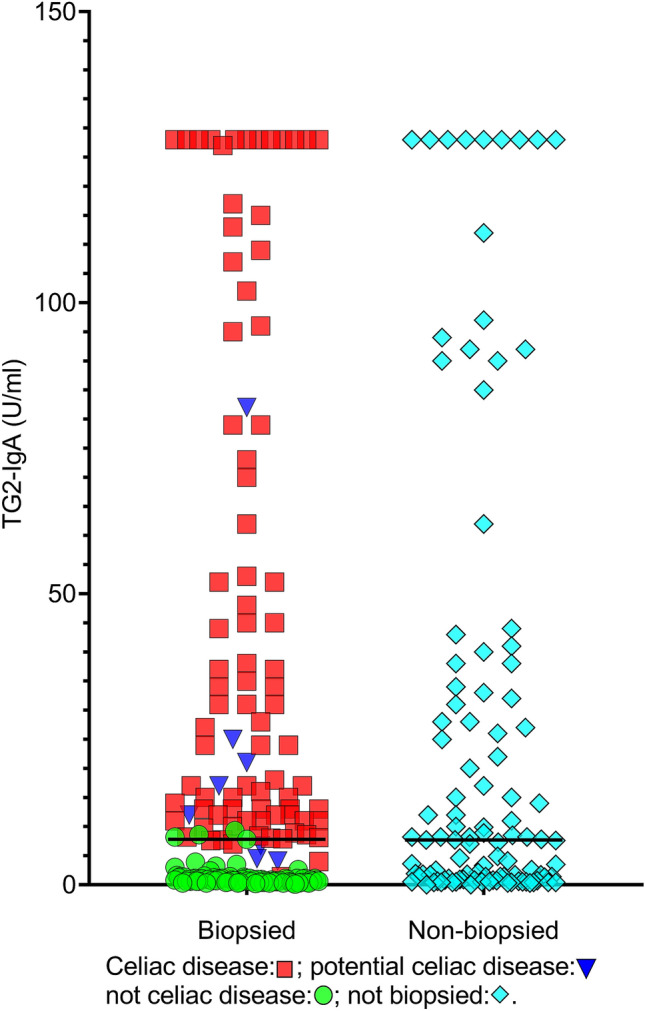
The impact of a gluten-free diet (GFD) on screen-detected celiac disease (CD) is currently ambiguous. We aimed to identify the population-based prevalence of undiagnosed adult CD and examine the impact of a GFD on screen-detected CD. In total, 12,981 adults participated in a population-based health study in Tromsø, Norway. Participants with increased levels of anti-tissue transglutaminase-2 IgA or anti-deamidated gliadin peptide IgG were invited to undergo gastroduodenoscopy with both histological and immunohistochemical examination of small-bowel biopsies. The prevalence of previously diagnosed CD was 0.37%. Additionally, the prevalence of previously undiagnosed CD was 1.10%. Thus, 1.47% of the population had CD, of whom 75% were previously undiagnosed. A GFD resulted in significant improvements in overall gastrointestinal symptoms, diarrhea, and health-related quality of life, with reduced abdominal discomfort (76%) and improved levels of energy (58%). The large majority of patients with adult CD were undiagnosed and benefited from a GFD with reduced gastrointestinal symptoms and improved health-related quality of life. In clinical practice, there should be a low threshold for CD testing even in the absence of abdominal complaints because most adult patients appear to consider their symptoms a part of their normal state and therefore remain untested and undiagnosed.Trial registration: Clinical Trials. Gov Identifier: NCT01695681.
© 2022. The Author(s).
Conflict of interest statement
Trond S. Halstensen has served as speaker, consultant, and head of the scientific board of the Norwegian Celiac Disease association. He has also served as a speaker for Phadia. Jan-Magnus Kvamme has served as a speaker for the Norwegian Celiac Disease association. Jon Florholmen and Sveinung W Sørbye declare no personal interests.
Figures


References
-
- Fluge G, Dybdahl JH, Ek J, Løvik A, Røhme R. Guidelines for diagnosis and follow-up of patients with celiac disease. Tidsskr Nor Lægeforen. 1997;117:672–674. - PubMed
Publication types
MeSH terms
Substances
Associated data
LinkOut - more resources
Full Text Sources
Medical
Miscellaneous
