. 2023 Jan;41(1):60-69.
doi: 10.1038/s41587-022-01397-w. Epub 2022 Jul 25.

Uncovering the mode of action of engineered T cells in patient cancer organoids

Affiliations

Uncovering the mode of action of engineered T cells in patient cancer organoids

Johanna F Dekkers et al. Nat Biotechnol. 2023 Jan.

Abstract

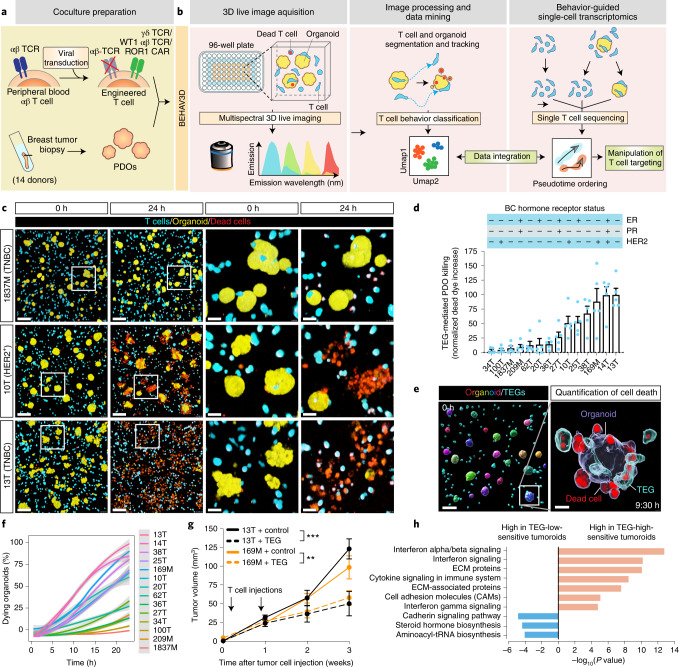
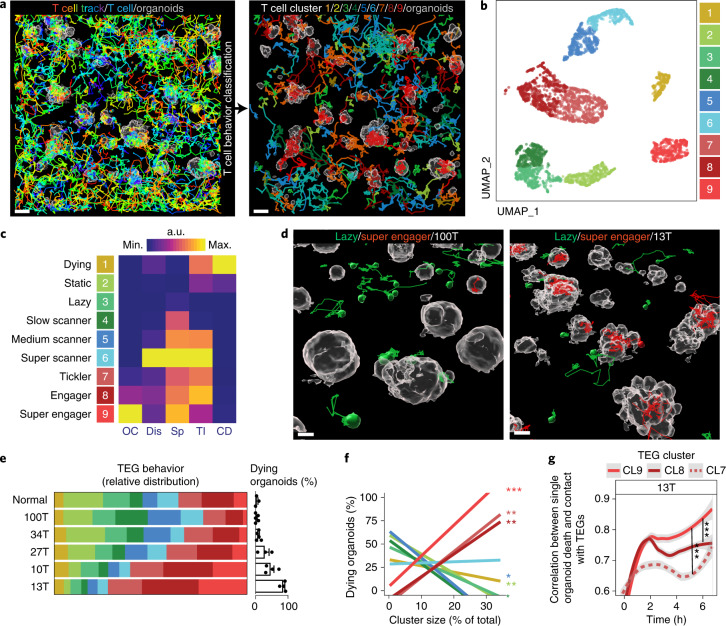
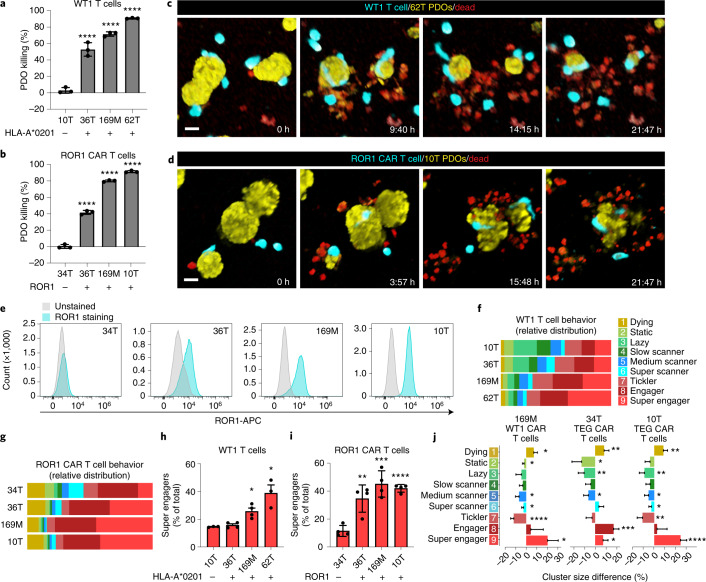
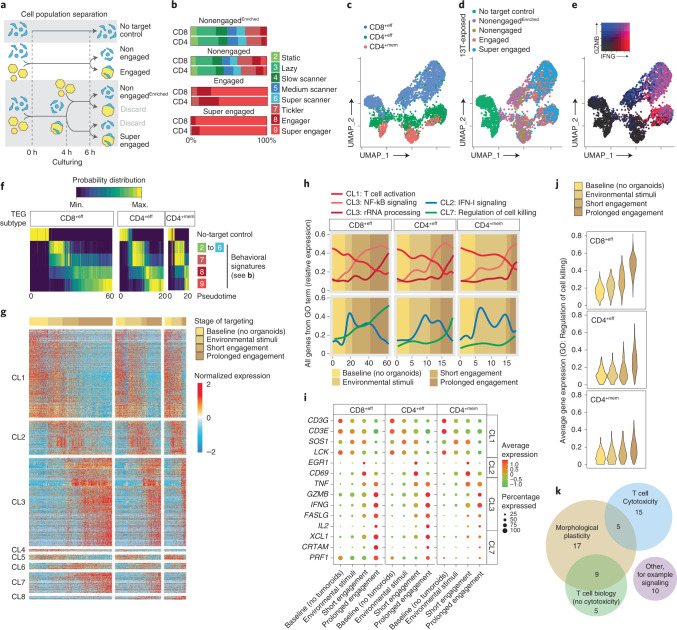
Extending the success of cellular immunotherapies against blood cancers to the realm of solid tumors will require improved in vitro models that reveal therapeutic modes of action at the molecular level. Here we describe a system, called BEHAV3D, developed to study the dynamic interactions of immune cells and patient cancer organoids by means of imaging and transcriptomics. We apply BEHAV3D to live-track >150,000 engineered T cells cultured with patient-derived, solid-tumor organoids, identifying a 'super engager' behavioral cluster comprising T cells with potent serial killing capacity. Among other T cell concepts we also study cancer metabolome-sensing engineered T cells (TEGs) and detect behavior-specific gene signatures that include a group of 27 genes with no previously described T cell function that are expressed by super engager killer TEGs. We further show that type I interferon can prime resistant organoids for TEG-mediated killing. BEHAV3D is a promising tool for the characterization of behavioral-phenotypic heterogeneity of cellular immunotherapies and may support the optimization of personalized solid-tumor-targeting cell therapies.


Conflict of interest statement

H.C., Y.E.B.-E., K.K. and J.F.D. are named as inventors on (pending) patents related to the organoid technology. For the full disclosure of H.C., see https://www.uu.nl/staff/JCClevers/Additional%20functions. Z.S. and J.K. are inventors on different patents for γδ TCR sequences, recognition mechanisms and isolation strategies. J.K. is scientific cofounder and shareholder of Gadeta (www.gadeta.nl). The remaining authors declare no competing interests.

Figures

Fig. 1
Fig. 1. TEG efficacy across organoids of multiple BC subtypes detected by multispectral 3D live imaging and in vivo TEG targeting.
a,b, Schematic representation of TEG generation and coculture with PDOs (a) and of the BEHAV3D platform (b). Cocultures of organoids and TEGs were imaged using 3D microscopy, followed by segmentation and tracking of organoids and T cells and subsequent behavior classification. Pseudotime ordering was used to integrate behavioral data. c, 3D multispectral images of breast PDO cultures (yellow) showing low (1837M), intermediate (10T) and high (13T) killing by TEGs (blue) at the indicated time points of imaging. Scale bars, 100 µm (two left-hand columns) and 30 µm (two right-hand columns). d, Quantification of killing of organoids derived from 14 patients with BC following 24-h coculture with TEGs, by 3D live-cell imaging. Data were corrected for control LM1 T cell responses (n = 4 independent experiments, mean ± s.e.m. TNBC, triple-negative breast cancer; ER, estrogen receptor; PR, progesterone receptor. e, 3D image of organoids and T cells; enlarged section showing the presence of dead cell dye (red) in a single organoid (transparent purple rendering) and TEGs (transparent blue rendering) at the indicated time of coculture. Scale bars, 100 µm (left) and 30 µm (right). f, Quantification of the percentage of dying single organoids (of total) over time for each PDO cocultured with TEGs (n = 4 independent experiments, mean ± s.e.m.). g, Quantification of tumor volume over time generated by subcutaneous transplantation of 13T (black) or 169M organoids (orange). Animals received two injections of either TEGs (dashed line) or control TEG011 cells (control, solid line) at the indicated time points (n = 10 mice for 13T and n = 15 for 169M, mean ± s.e.m.). Two-way ANOVA with repeated measures: 13T/TEG versus 13T/control, P < 0.0001 (***); 169M/TEG versus 169M/control, P = 0.0016 (**). h, Gene Ontology (GO) enrichment analysis of DEGs between the six highest versus six lowest TEG-sensitive organoid cultures from d. c,e, Images representative of n = 4 independent experiments.
Fig. 2
Fig. 2. TEGs exposed to PDOs display high diversity in their behavior with distinct killing potential.
a, Image of automated tracking of each TEG (left, 10-h tracks are rainbow colored for time). Tracks were classified according to TEG behavior and back-projected in the image (right, color coded by cluster). Scale bars, 50 µm. Representative of n = 11 independent experiments. b, UMAP plot showing nine color-coded clusters identified by unbiased multivariate time series dynamic time-warping analysis. Each data point represents one T cell track of 3.3 h. See Supplementary Table 8 for conditions and replicates included. c, Heatmap depicting relative values of T cell features indicated for each cluster, named according to their most distinct characteristics. a.u., Arbitrary units in respect to maximal and minimal values for each feature. OC, organoid contact; Dis, square displacement; Sp, speed; TI, T cell interactions; CD, cell death. d, 3D-rendered images of 100T (low-targeting, left) and 13T (high-targeting, right) organoids (gray) and TEGs, with 3.3-h tracks belonging to lazy (green) and super engager (red) clusters. Scale bars, 20 µm. Representative of n = 5 independent experiments. e, Behavioral cluster distribution of TEGs cocultured with the indicated PDOs and a normal organoid culture (left), in relation to their killing capacity (right, bar graph), represented as the percentage of dying organoids (percentage of total); n ≥ 3 independent experiments, mean ± s.e.m. X2-test, P = 1.132 × 10–8. f, Pearson correlation between behavior cluster (CL) size and percentage of dying organoids represented in d. CL9, P = 0.00006 (***); CL8, P = 0.009 (**); CL7, P = 0.006 (**); CL5, P = 0.014 (*); CL4, P = 0.022 (*); CL2, P = 0.0019 (**) (mean). See Supplementary Table 8 for test statistics and replicates included. g, Change in correlation between 13T organoid death dynamics (measured as increase in dead cell dye) and cumulative contact with TEGs (from CL7–9). Data presented as mean correlation per time point of all single organoids (n = 4 independent experiments). Linear mixed model fitting with each experimental replicate as a random effect: C9 versus C8, P = 5.19 × 10–6 (***); C9 versus C7, P < 2 × 10–16 (***).
Fig. 3
Fig. 3. Behavioral heterogeneity of TCR and CAR T cell therapies targeting BC PDOs.
a,b, Quantification of BC PDO viability using CellTiter-Glo following overnight coculture of PDOs with WT1 T cells (a) or ROR1 CAR T cells (b). a,b, One-way ANOVA followed by Dunnett’s correction: 10T versus 36T, P < 0,0001 (****); 10T versus 169M, P < 0,0001 (****); 10T versus 62T, P < 0,0001 (****) (a); 34T versus 36T, P < 0,0001 (****); 34T versus 169M, P < 0,0001 (****); 34T versus 10T, P < 0.0001 (****) (b). Data corrected for untransduced T cell responses (mean ± s.d.). c,d, 3D multispectral images of BC PDO cultures (yellow) showing killing by WT1 T cells (blue, c) or ROR1 CAR T cells (blue, d) at the indicated time points of imaging. Dead cells depicted in red. Scale bars, 30 µm. e, FACS histogram plots showing ROR1 expression in the indicated breast cancer PDO cultures (blue) compared with unstained control (gray). f,g, Behavioral cluster distribution of WT1 T cells (f) and ROR1 CAR T cells (g) cocultured with the indicated BC PDOs (mean ± s.e.m.). X2-test, P < 0,0001. h,i, Super engager (CL9) cluster size (%) of total for WT1 T cells (h) and ROR1 CAR T cells (i). h, One-way ANOVA with Dunnett’s correction: 10T versus 169M, P = 0,0501; 10T versus 62T, P = 0.0006; 34T versus 36T, P = 0.0018; 34T versus 169M, P < 0.0001; 34T versus 10T, P = 0.0002 (mean ± s.d.). j, Behavioral cluster size difference (%) between TEGs and CAR T cells cocultured with 34T (middle) or 10T (right), or between WT1 T cells and CAR T cells cocultured with 169M PDOs (left) (mean ± s.d.). Welch’s two-sided t-test: 169M: CL1, P = 0.015; CL2, P = 0.041; CL5, P = 0.023; CL6, P = 0.047; CL7, P = 9.94 × 10–4; CL9, P = 0.012. 34 T: CL1, P = 0.004; CL2, P = 0.016; CL3, P = 0.003; CL5, P = 0.012; CL8, P = 0.0004; CL9, P = 0.037. 10T: CL1, P = 0.0014; CL3, P = 0.0045; CL5, P = 0.014; CL6, P = 0.025; CL7, P = 0.001; CL9, P = 1.16 × 10–5. ae, Representative of n = 3 independent experiments; fj, n = 3–6 independent experiments; see Supplementary Table 8 for value of n per condition.
Fig. 4
Fig. 4. Unique targeting features of TEG subpopulations and serial killer potential.
a, Images of CD4+ (blue) and CD8+ (red) TEGs and their full tracks (up to 10 h) cocultured with 13T organoids (gray surface rendering at t = 0). Scale bars, 50 µm (main image), 30 µm (zoomed-in images). b, Relative behavioral cluster distribution of TEGs cocultured with various organoids. c, Behavioral cluster size difference (%) between CD4+ and CD8+ TEGs cocultured with the indicated organoid cultures from b (n = 33 wells pooled from the five organoid cultures shown in b; see Supplementary Table 8 for replicate specifics; mean ± s.e.m.). Linear regression model fitting with each well as a random effect: CL9, P = 7.52 × 10–6 (***); CL8, P = 0.0034 (**); CL7, P = 0.00018 (***); CL6, P = 0.000023 (***); CL5, P = 0.0062 (**); CL4, P = 0.01 (*); CL3, P = 0.001 (**); CL1, P = 3.01 × 10–6 (***). d, A CD4+ TEG killing a 13T tumor cell in a first organoid and a second tumor cell in a neighboring organoid (upper), and a CD8+ TEG killing a complete 13T organoid over 11 h (lower). Scale bars, 30 µm; time, h. e, Processed images from d showing 3D-rendered organoids (gray) at t = 0 and the CD4+ TEG or CD8+ TEG with their full track. Scale bars, 10 µm. f, UMAP embedding showing expression levels of NCAM1. Color gradient represents log2-transformed normalized counts of genes. g, Quantification of the percentage of dying 13T organoids (of total) after 10 h of coculture with either sorted NCAM1CD8+ TEGs or NCAM1+CD8+ TEGs (n = 5 independent experiments, mean ± s.e.m.). Two-tailed unpaired t-test, P = 0.0001036. h, Schematic representation of fluorescent labelling strategy for CD8+ TEGs. i, Behavioral cluster difference (%) between NCAM1CD8+ TEGs and NCAM1+CD8+TEGs cocultured with 13T organoids (n = 6 independent experiments, mean ± s.e.m.). Linear regression model fitting with each experimental replicate as a random effect: CL9, P = 0.0002 (***); CL8, P = 0.07 (·) ; CL2, P = 0.005 (**); CL1, P = 0.02 (*). j, Images of 13T organoids (gray) with NCAM+ super engager CD8+TEGs (top) and NCAM lazy and dying CD8+TEGs (bottom). Scale bars, 10 µm. a,d,j, Representative of n = 5, 3 and 5 independent experiments, respectively).
Fig. 5
Fig. 5. Behavioral-transcriptomic profiling of TEGs following PDO exposure, engagement and killing.
a, Schematic representation of cell population separation for isolation and sequencing of super engaged, engaged, nonengaged, nonengagedEnriched and no-target control TEGs. b, Distribution of the nine behavioral signatures described in Fig. 2b,c of the indicated behavior-enriched TEG populations isolated after 6 h of coculture with 13T PDOs. n = 6 independent experiments. ce, UMAP embedding of pooled scRNA-seq profiles showing distribution of CD8+eff, CD4+eff and CD4+mem TEGs (c), the five behavior-enriched TEG populations described in a (d) and normalized gene expression of IFNG and GZMB (e). Colors represent log2-transformed normalized counts of genes. f, Heatmap representing the probability distribution of different behavioral signatures and no-target control over pseudotime for CD8+eff, CD4+eff and CD4+mem TEGs. Colors represent the scaled probability for each behavioral group. g, Heatmap showing normalized gene expression dynamics of TEGs following exposure to and engagement with 13T PDOs. Columns represent T cells ordered in pseudotime, rows represent gene expression grouped based on similarity, resulting in eight gene clusters. CLs 1–3 represent gene expression patterns shared among TEG subsets; CLs 4–8 show different expression dynamics between TEG subsets. Horizontal color bar (top) represents the corresponding stage of targeting based on data in f. h, Averaged gene expression over pseudotime for all genes from indicated GO terms for the indicated TEG subtypes. Background color shading represents the corresponding stage of targeting; line colors indicate GO terms. i, Gene expression dot plot for a curated subset of genes at different stages of targeting. Rows depict genes, dot color gradient indicates average expression while dot size reflects the proportion of cells expressing a particular gene (%). j, Violin plots for different TEG subtypes showing averaged expression of genes related to GO term ‘Regulation of cell killing’ enriched in CL7 from g. Colors indicate different stages of targeting. k, Venn diagram depicting common and unique functions from 61 conserved genes comprising a (serial) killer gene signature. bd, T cells pooled from two independent experiments).
Fig. 6
Fig. 6. IFN-I signaling in PDOs primes TEG efficacy.
a, Top: UMAP embedding of pooled scRNA-seq profiles from super engaged and nonengagedEnriched TEG populations cocultured with either 13T or 10T PDOs, and from no-target control T cells. TEGs are colored according to experimental condition. Bottom: UMAP plot showing expression levels of IFNG and GZMB. Colors represent log2-transformed normalized counts of genes. b, Venn diagrams depicting common and unique genes upregulated (up) in TEGs following 13T and 10T organoid exposure (top, environmental stimuli) or prolonged engagement (bottom, super engagers). c, Heatmap of gene expression for genes involved in functional annotations of interest in response to IFN-I, cytokine response), grouped according to TEG populations. d, IFNA and IFNB expression in PDOs from the BC panel in Fig. 1d. 1 and 2 indicate different experimental replicates. eg, Quantification of dying single organoids in the presence or absence of recombinant IFN-β for the following conditions: organoids cocultured with TEGs with direct addition of IFN-β, corrected for responses of LM1 control T cells (e); organoids preincubated with IFN-β for 24 h before coculture with TEGs, corrected for responses of LM1 control T cells (f); and organoids preincubated with IFN-β for 24 h and cultured in the absence of TEGs (g). Lines connect experimental replicates. f, Statistical analysis was performed by paired t-test: 34T IFN-β versus 34T control, P < 0.0006 (***); 27T IFN-β versus 27T control, P < 0.0216 (*); 10T IFN-β versus 10T control, P < 0.0402 (*). See Supplementary Table 8 for summary of replicates in eg.
Extended Data Fig. 1
Extended Data Fig. 1. Multi-spectral 3D imaging quantification of organoid killing.
(a) Emission spectra of the indicated fluorescent real-time cell dyes separately imaged by multispectral imaging with the lambda mode using the indicated lasers. (b) Overview of fluorescent real-time cell dyes for labelling the indicated cell types. (c) Schematic representation of the co-culture setup. (d) Quantification of death of individual PDOs in the presence of control TEGs expressing a mutated Vψ9/V82 TCR (LM1s). (e) Quantification of the percentage of dying single organoids (% of total) over time for each PDO co-cultured with LM1 control TEGs (right panel) or in the absence of T cells (left panel) (n = 4 independent experiments; mean). (f) Quantification of death of individual PDOs in the presence of TEGs. (g) Comparison of average size of PDOs (t = 0 of TEG co- culture) that were either dying or alive at 10 h of co- culture with TEGs for the indicted PDO lines. Data corrected for control LM1 T cell responses. n = 4 (20 T and 10 T) or 5 (25 T, 27 T, 62 T) independent experiments. Two-tailed unpaired t test: NS = p > 0.05. (h) Quantification of killing of 11 10 T PDO clonal lines as well as the parental culture using a CellTiter-Glo® viability assay, upon overnight co-culture of organoids with TEGs in the presence of pamidronate, (n = 3 (10T-1 and 10T-2) or 4 (all other clones) independent experiments; mean ± s.e.m.). (i-l) Quantification of PDO targeting using a CellTiter-Glo® viability assay (i) or INFψ ELISA assay (k), upon 24 h co-culture of organoids with TEGs in the presence of pamidronate, and Pearson correlation plots between the outcomes of live cell imaging compared to CellTiter-Glo® measured viability (j). (F = 75.05, DFn=1, DFd=12, 95% CI [0.5184, 0.8668], p < 0.0001) and INFψ ELISA (l) (F = 14.49, DFn=1, DFd=12, 95% CI [0.257,0.9452], p = 0.0025). Data corrected for control LM1 T cell responses. (n = 4 independent experiments; mean ± s.e.m.). (d,f: Single organoids that crossed the mean dead cell dye intensity threshold of 7 (dashed lines) are considered dying (red lines)).
Extended Data Fig. 2
Extended Data Fig. 2. GO terms associating with PDO sensitivity to TEGs.
(a-c) Heatmap showing normalized gene expression (Row Z-score) for the indicated PDOs harvested at two different time points in culture (experimental replicates ‘_1’ and ‘_2’). GO terms ‘extracellular matrix (ECM) and ECM- associated proteins’ (a), ‘cytokines signaling in immune system’ (b) and ‘interferon signaling’ (c) are presented, which were identified in the gene ontology enrichment analysis of differentially expressed genes between the six highest versus six lowest TEG-sensitive organoid cultures from Fig. 1h.
Extended Data Fig. 3
Extended Data Fig. 3. Properties of the 9 TEG behavioral clusters, random forest classification and head and neck cancer and diffuse midline glioma PDO targeting.
(a,b) Representative multispectral overview images (a; scale bars, 50 µm) and enlarged sections for clusters of interest (b; scale bars, 20 µm) of 13 T organoids co- cultured with TEGs classified into 9 different behavioral clusters. n = 11 independent experiments. (c) Schematic representation of the Random Forest classification pipeline and the resulting heatmap showing relative intensity values of T cell features indicated for each cluster resulting from the classification of the experiment in Fig. 2c. (OC, organoid contact; Dis, square displacement; Sp, speed; TI, T-cell interaction; CD, cell death) (d,e) Error rate of the training data per cluster and overall for all trees (d) and correlation plot between ground truth cluster classification and predicted cluster classification (e). Color represents ground truth cluster. (f,g) Quantification of head and neck cancer (H&N) PDO (f) or diffuse midline glioma (DMG) PDO (g) targeting using a CellTiter-Glo® viability assay upon overnight co- culture with TEGs in the presence of pamidronate. Data corrected for control LM1 T cell responses. (n = 3 independent wells, representative graph of n = 3 independent experiments; mean ± s.d.). (h) Images of H&N cancer & DMG PDO cultures (yellow) showing killing by TEGs (blue) at the indicated time points of imaging. Dead cells in red. Scale bars, 50 µm. (i) Behavioral cluster distribution of TEGs co-cultured with the indicated PDOs. χ2 test; p = 1.132e-08. (j) Representative multispectral images of H&N2 PDOs (rendered in grey) co-cultured with TEGs classified as static (C2; green) or super engager (C9; red), Scale bars, 15 µm. (k) Change in correlation between 10 T organoid death dynamics (measured as increase in dead cell dye) and cumulative contact with TEGs (from behavior clusters 7-9). Data is represented as mean correlation per timepoint of all single organoids (n = 4 independent experiments). Linear mixed model fitting with each experimental replicate as a random effect: C9 vs C8, p < 2e-16; C9 vs C7, p < 2e-16. (h-j: representative data of n = 3 independent experiments).
Extended Data Fig. 4
Extended Data Fig. 4. Unique targeting features of CD4+ and CD8+ TEGs and behavioral signatures in relation to NCAM1 expression.
(a) Representative FACS plots showing CD4, CD8, αβ TCR and Vψ9/V82 TCR expression for cultured CD4+ and CD8+ LM1s or TEGs. (b) Representative image of long-term tracking of TEGs in co-culture with 13 T organoids (grey surface rendering at t = 0) showing full tracks (up to 20 hrs; rainbow-colored). Scale bar, 50 µm. (c) Time series color plot showing long-term tracks of TEGs (co-cultured with 13 T) and how they change their behavioral signature overtime for each time interval. (0- 3.3 hrs; 3.3-6.6 hrs; 6.6-10 hrs; 10-13.3 hrs). Colors indicate cluster identity for each TEG (see j). Tracks were classified into 6 different groups (named according to their most distinct behavior) and the proportion of CD4+TEG and CD8+TEG is indicated per group. TEGs were pooled from 3 independent experiments. (d) CD4+ TEG moving away from a 13 T organoid without killing. Scale bars, 20 µm. (e) Images showing 13 T organoids and CD8+ TEGs with defined anchor points. Scale bars, 10 µm. (f) Quantification of fold increase in cell length. Individual cells pooled from 6 independent experiments. Boxplot depicts the median, first and third quartiles, whiskers extend 1.5 times from the interquartile range. (g) UMAP plot shows distinct TEGs subsets unexposed to PDOs, pooled from three independent experiments. (h) Gene-expression dot plot of a curated set of differentially expressed genes in each cell subpopulation. Rows depict cell subpopulations as in g, while columns depict genes. (i) Quantification of breast cancer PDO targeting using a CellTiter-Glo® viability assay upon overnight co-culture with sorted NCAM1CD8+TEGs or NCAM1+CD8+TEGs. Data corrected for organoid only responses. Unpaired T test: 34 T p = 0,0263; 27 T p = 0,0198; 10 T p = 0,0289. (n = 3 individual wells, representative data of 3 independent experiments; mean ± s.d.). (j) Relative behavioral cluster distribution of NCAM1CD8+ TEGs or NCAM1+CD8+ TEGs co-cultured with 13 T PDOs. (k) FACS histogram plots showing NCAM1 expression in TEGs that were cultured in the absence (grey) or presence of IL-15 (black) for 10 days. (Representative data of 3 (b,d,e,k) or 4 (a) independent experiments).
Extended Data Fig. 5
Extended Data Fig. 5. Analysis of TEG behavior and killing properties.
(a) Quantification of the first action and second action of CD4+ and CD8+ TEGs after they engaged with an organoid. (n = 3 independent experiments). Hypergeometric test was used to analyze cell type enrichment in each category. ‘Kills multiple cells’ p < 0.0001; ‘Kills one cell’ p = 0.000015; ‘No killing’ p= 0.0018. (b) Quantification of the number of cells killed in a sequence by CD8+TEGs in time. (n = 3 independent experiments). (c) Quantification of the time it takes to kill one 13 T tumor cell for CD4+ TEGs and CD8+ TEGs (n = 3 independent experiments).
Extended Data Fig. 6
Extended Data Fig. 6. Behavior-guided transcriptomics of TEGs co-cultured with 13T organoids.
(a) Dynamic change of the percentage of TEGs exhibiting super engager behavior (C9) over time in co-culture. Color denotes TEGs co-cultured with 13 T or 10 T organoids and line type CD4+ (dashed) or CD8+ (solid) TEGs. The 6 hrs time point was selected for single cell TEG sequencing (dashed grey line). (b) Separate UMAP embeddings showing inferred pseudo-time trajectory of CD8+eff, CD4+eff and CD4+mem TEGs. Color scale represents the inferred pseudotime. (c) Functional enrichment analysis for biological processes and pathways from gene clusters (CL) that are downregulated (CL1), upregulated (CL3) or transiently expressed (CL2) over the pseudotime trajectory of TEGs targeting 13 T organoids. CL1-3 are represented in Fig. 5g. (d) Gene- expression dot plot of the 61 conserved genes composing the (serial) killer gene signature separated by function. Rows depict genes, while columns depict stage of targeting. Dot color gradient indicates average expression, while size reflects the proportion of cells expressing a particular gene.
Extended Data Fig. 7
Extended Data Fig. 7. Overlap between cytotoxic signature of tumor-infiltrating T cells and super engager TEG gene expression.
(a,b) UMAP embedding color-coded for different populations of tumor-infiltrating lymphocytes (TILs) isolated from human breast cancer tumor samples from the Savas et al. (a; 310 genes) or Azizi et al. (b; 543 genes) study. (c,d) UMAP embedding of TILs showing relative expression of a cytotoxic gene signature identified in the Savas et al. (c) or Azizi et al. (d) dataset. (e) UMAP embedding of TEGs enriched for different behaviors (see Fig. 5c-e) showing normalized gene expression projection of the Savas et al. or Azizi et al. cytotoxic signature. Colors represent the log2 transformed normalized counts of genes. (f) Violin plots for different TEG subtypes showing expression of the cytotoxic gene signature identified in Savas et al. (left panel) or Azizi et al. (right panel). Colors indicate different stages of targeting.
Extended Data Fig. 8
Extended Data Fig. 8. Behavior-guided transcriptomics of TEGs co-cultured with 13T and 10T organoids.
(a) Heatmap showing normalized gene expression of behavior-enriched TEG populations co-cultured with 10 T or 13 T organoids, or cultured without PDOs (No target control). Columns represent cells ordered by TEG populations and rows represent the expression of genes. Shown are 534 genes induced upon prolonged organoid engagement (super engagers) in both 10 T and 13 T co- cultures from Fig. 6b. (b) Functional enrichment analysis (conserved biological processes and pathways) of genes induced in both 10T- and 13T-co-cultured super engager TEGs (shown in A). (c) Functional enrichment analysis of genes differentially expressed between 10T- and 13T-co- cultured super engager TEGs. Top differentially regulated biological processes and pathways are shown. (d) IFN-ß concentration measured for the different organoid cultures in Fig. 6e-g.

Comment in

References

    1. van der Leun, A. M., Thommen, D. S. & Schumacher, T. N. CD8(+) T cell states in human cancer: insights from single-cell analysis. Nat. Rev. Cancer20, 218–232 (2020). - PMC - PubMed
    1. June, C. H. & Sadelain, M. Chimeric antigen receptor therapy. N. Engl. J. Med.379, 64–73 (2018). - PMC - PubMed
    1. Chen, D. S. & Mellman, I. Elements of cancer immunity and the cancer-immune set point. Nature541, 321–330 (2017). - PubMed
    1. Wallstabe, L. et al. ROR1-CAR T cells are effective against lung and breast cancer in advanced microphysiologic 3D tumor models. JCI Insight4, e126345 (2019). - PMC - PubMed
    1. Chapuis, A. G. et al. T cell receptor gene therapy targeting WT1 prevents acute myeloid leukemia relapse post-transplant. Nat. Med.25, 1064–1072 (2019). - PMC - PubMed

Publication types