. 2022 Dec;40(12):1834-1844.
doi: 10.1038/s41587-022-01386-z. Epub 2022 Jul 25.

Ras-mutant cancers are sensitive to small molecule inhibition of V-type ATPases in mice

Affiliations

Ras-mutant cancers are sensitive to small molecule inhibition of V-type ATPases in mice

Bhairavi Tolani et al. Nat Biotechnol. 2022 Dec.

Abstract

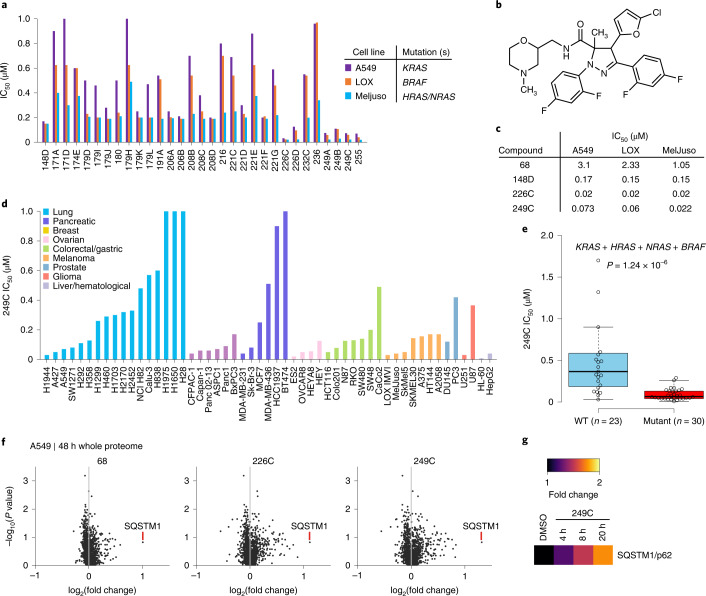
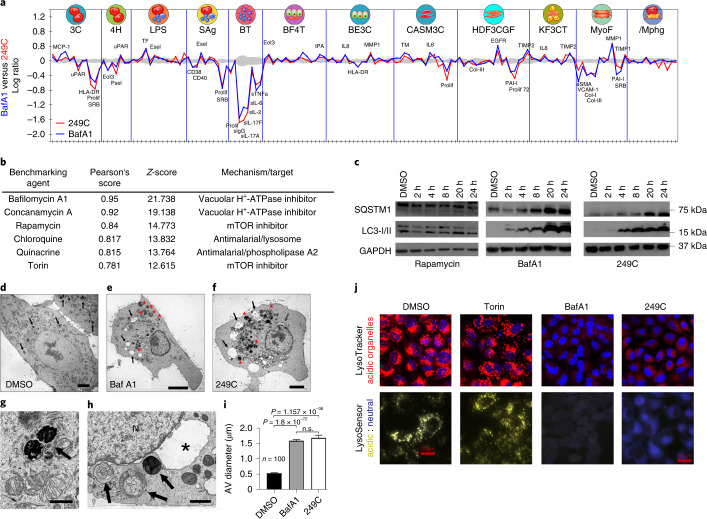
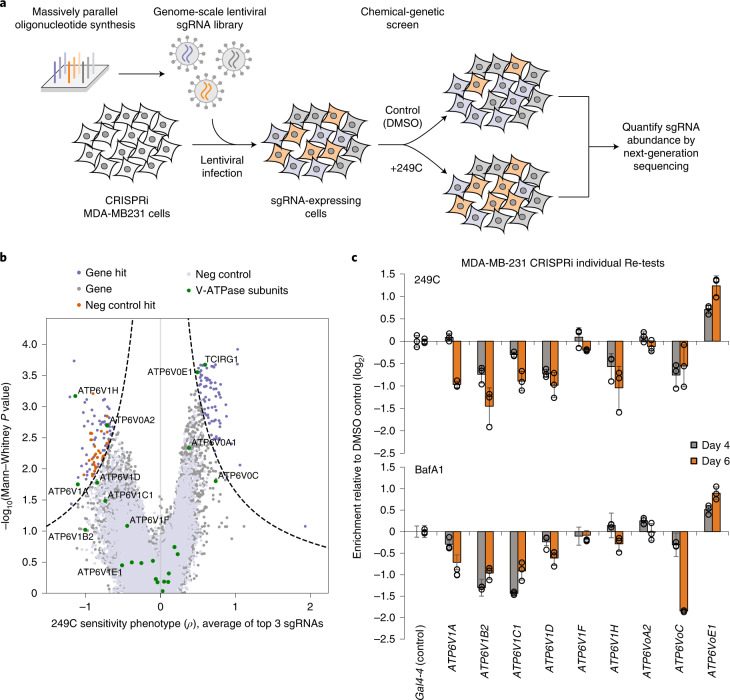
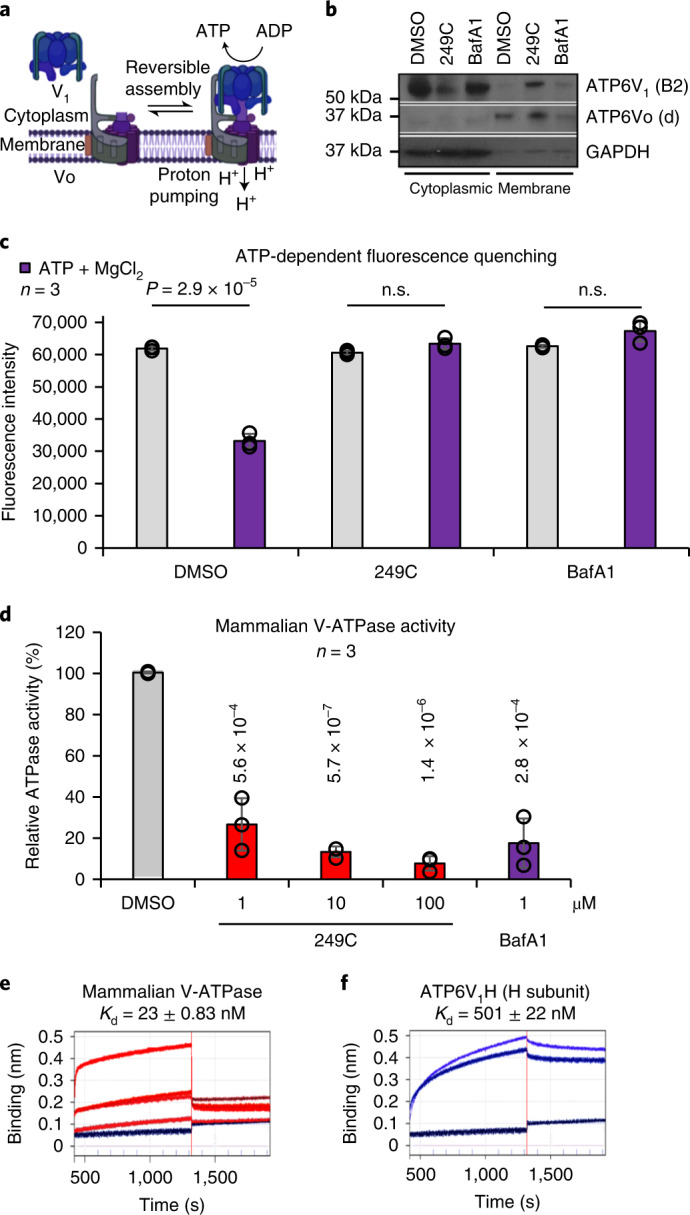
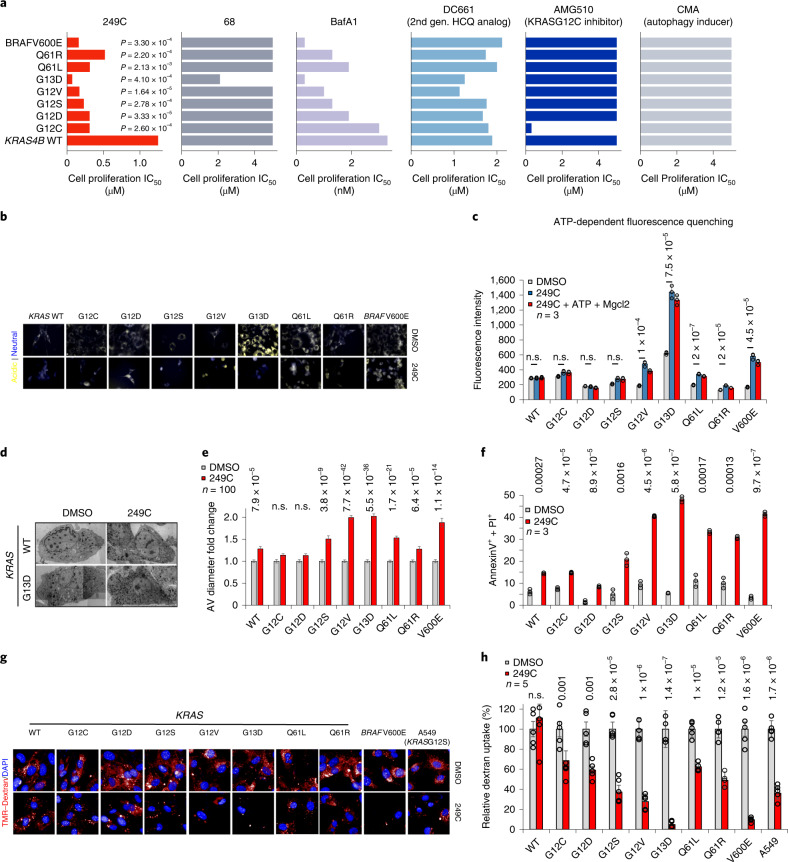
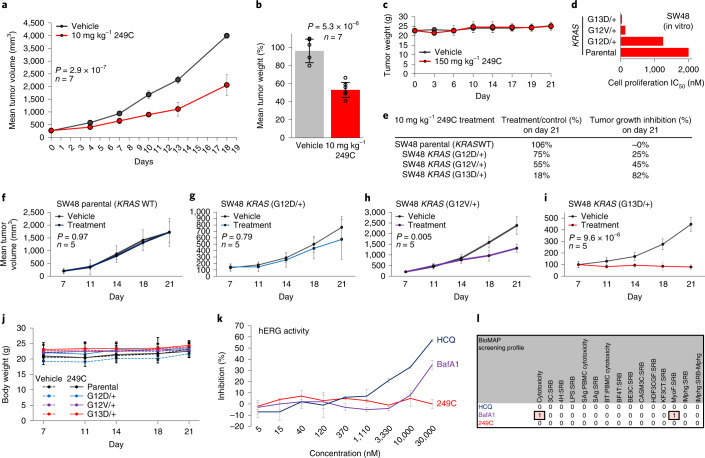
Mutations in Ras family proteins are implicated in 33% of human cancers, but direct pharmacological inhibition of Ras mutants remains challenging. As an alternative to direct inhibition, we screened for sensitivities in Ras-mutant cells and discovered 249C as a Ras-mutant selective cytotoxic agent with nanomolar potency against a spectrum of Ras-mutant cancers. 249C binds to vacuolar (V)-ATPase with nanomolar affinity and inhibits its activity, preventing lysosomal acidification and inhibiting autophagy and macropinocytosis pathways that several Ras-driven cancers rely on for survival. Unexpectedly, potency of 249C varies with the identity of the Ras driver mutation, with the highest potency for KRASG13D and G12V both in vitro and in vivo, highlighting a mutant-specific dependence on macropinocytosis and lysosomal pH. Indeed, 249C potently inhibits tumor growth without adverse side effects in mouse xenografts of KRAS-driven lung and colon cancers. A comparison of isogenic SW48 xenografts with different KRAS mutations confirmed that KRASG13D/+ (followed by G12V/+) mutations are especially sensitive to 249C treatment. These data establish proof-of-concept for targeting V-ATPase in cancers driven by specific KRAS mutations such as KRASG13D and G12V.


Conflict of interest statement

B.T. is an inventor on the patent filed by UCSF covering these molecules. UCSF has licensed this patent to a start-up biotechnology company. The startup calls 249C ‘RSC-1255’ instead and is running a Phase Ia/1b dose escalation and dose expansion clinical trial for the following indications: Ras mutations; lung cancer; colon cancer; pancreatic cancer; and glioblastoma. It is being run as a multi-center trial across five different sites in the U.S. Recruitment is ongoing (NCT04678648). J.S.W. and M.J. have submitted patent applications related to CRISPR screening. J.S.W. declares outside interest in 5 AM Venture, Amgen, Chroma Medicine, DEM Biosciences, KSQ Therapeutics, Maze Therapeutics, Tenaya Therapeutics, Tessera Therapeutics and Velia Therapeutics. M.J. consults for Maze Therapeutics and Gate Biosciences. All other authors declare no competing interests.

Figures

Fig. 1
Fig. 1. Optimization of potency and drug properties of small molecule inhibitors of Ras- and Raf-mutant cells using viability screens.
a, Cell viability screen of ~300 small molecules in A549 (KRASG12S), LOX IMVI (BRAFV600E), and MelJuso (HRASG13D and NRASQ61L). Cells were treated with vehicle DMSO or increasing concentrations of small molecules in triplicate for 72 h and ATP content/viability was measured using CellTiter-Glo Luminescent Cell Viability Assay. The results shown for all cell viability figures are representative of at least two independent experiments. The top 30 compounds (P < 0.05 in comparison to vehicle-treated controls, two-sided t-test) with the lowest IC50s are presented. n = 3. b, Structure of dihydro-pyrazole-5-carboxamide small molecule hit 249C that shows inhibition of viability in both Ras- and Raf-mutant cells. c, Evolution of the structure–activity relationship and IC50 of the first (68) and last (249C; lead owing to drug-like properties) compounds in the screen. d, 249C sensitivity for a panel of 53 cancer cell lines (including lung, pancreatic, breast, ovarian, hematological/liver, prostate, colorectal cancers, glioma, and melanoma). e, IC50 values stratified by the mutation status of KRAS, HRAS, NRAS, and BRAF (two-sided Wilcoxon rank sum test; P = 1.24 × 10−6; Supplementary Fig. 1). The center line represents the median, the upper and lower bounds of the box indicate the interquartile range (IQR, the range between the 25th and 75th percentiles), and whiskers extend to the highest and lowest values within 1.5 times the IQR. f, Quantitative whole proteome analysis of the effects of small molecule treatment by mass spectrometry. A549 cells were treated with DMSO or 68 (30 µM), 226C (1 µM) or 249C (1 µM) for 48 h before analysis of proteomes with TMT labeling followed by quantification relative to the DMSO control. Autophagy receptor, SQSTM1, was identified as highly upregulated and common for our family of compounds by proteomic mass spectrometric screening in small molecule-treated A549 mutant KRAS cells. More data can be found in Supplementary Fig. 2 and Supplementary Tables 1–3. g, Quantitative whole proteome analysis of 249C-treated (1 µM) A549 cells over time relative to DMSO control.
Fig. 2
Fig. 2. Lead small molecule 249C phenocopies V-ATPase inhibitor BafA1.
a, Overlay of 148 biomarker responses in a panel of 12 primary-cell-based systems for 249C and Bafilomycin A1 (BafA1). BafA1 had the highest similarity out of 4,000 molecules. b, Pearson’s correlation and Z-scores for observed phenotypes of 249C in comparison to known database drugs (Supplementary Table 4). c, Treatment with 249C or the autophagy inhibitor BafA1, but not with the autophagy inducer rapamycin, resulted in upregulation of autophagy markers SQSTM1/p62 and LC3-I/II over time (full-length blot available in Source data Fig. 2). df, Representative electron micrographs of A549 cells treated with (d) the DMSO vehicle, (e) BafA1, or (f) 249C. Arrows in d indicate very densely staining phagosomes/lysosomes; arrows in e and f indicate large, clear vacuoles within the cells that are absent in d; red asterisks in e and f large multivesicular autophagic vesicles (AVs). g, Shows two of these structures at higher magnification from a DMSO-treated cell (arrow). h, Multivesicular AVs in a cell treated with 249C (arrows). The nucleus (N) in this cell exhibits a greatly distended portion of the nuclear envelope (asterisk) that resembles the large vacuoles seen in the cytoplasm of BafA1- and 249C-treated cells. i, Quantification of mean ± s.e.m. of the size of the multivesicular AVs from counts of cell treated with DMSO, BafA1 (P = 1.836 × 10−72) and 249C (P = 1.157 × 10−36). Two-sided t-test, n = 124. n.s., not significant. j, Treatment with the autophagy inhibitor BafA1 and 249C decreased staining of acidic organelles (red; LysoTracker) and resulted in an increase in lysosomal pH (yellow, acidic; blue, neutral; LysoSensor) relative to the DMSO control and the autophagy inducer Torin1 in A549 cells (KRASG12S). Representative images from n > 3. Scale bars: df, 5 µm; g,h, 1 µm. Source data
Fig. 3
Fig. 3. Genome-scale chemical–genetic CRISPRi screen implicates V-ATPase as the molecular target of 249C.
a, Schematic illustration of the genome-wide CRISPRi chemical–genetic screen. b, Volcano plot of 249C sensitivity phenotype from genome-scale CRISPRi screen in MDA-MB-231 cells. Phenotypes from sgRNAs targeting the same gene were collapsed into a single sensitivity phenotype for each gene using the average of the top three scoring sgRNAs and assigned a P value using a two-sided Mann–Whitney U test of all sgRNAs targeting the same gene as compared to the non-targeting controls. Negative control genes were randomly generated from the set of non-targeting sgRNAs. Dashed line represents discriminant score ≥7, calculated as phenotype Z-score × −log10(P value), with the Z-score defined from the standard deviation of the negative control genes. V-ATPase genes are shown in green. c, Internally controlled individual re-tests for 249C and BafA1 sensitivity assays performed with sgRNAs targeting (ATP6V1 –A, B2, C1, D, F, H and ATP6Vo – A2, C, E1) or a non-targeting control sgRNA (Gal4-4) in MDA-MB-231 CRISPRi cells. Cells transduced with the sgRNA expression constructs (marked with BFP) were left untreated or treated with 249C/BafA1 4 days after transduction. Enrichment of sgRNA-expressing cells was measured after treatment on the days indicated by flow cytometry as the enrichment of BFP (n = 3). Data presented are mean ± s.d. for replicate infections and treatments (n = 3) (Supplementary Fig. 4 and Supplementary Tables 5 and 6).
Fig. 4
Fig. 4. Validation of functional biochemical and biophysical effects of 249C on V-ATPase activity.
a, Model of the reversible assembly of V-ATPase. Cytosolic V1 subunits are depicted in blue and membrane Vo subunits in purple. Upon V-ATPase assembly, ATP is hydrolyzed to ADP accompanied by proton (H+) pumping and luminal acidification (decrease in pH). Created with BioRender (https://biorender.com). b, HEK293T cells were treated with 249C or BafA1 and cell homogenates were prepared, separated into membrane and cytosolic fractions and analyzed by Western blotting using antibodies against subunit B2 as a measure of the V1 domain and subunit Vod as a loading control for the membrane fraction, and GAPDH as a loading control for the cytosolic fraction (Methods). The amount of subunit B2 present in the membrane fraction indicates the amount of assembled V-ATPase. A representative Western blot is presented (full-length blot available in Source data Fig. 4). c, After 1 h of 249C or BafA1 treatment, HEK293T cells were allowed to take up FITC-Dextran by endocytosis, and the dye was chased to the lysosomal compartment (Methods). Cells were mechanically lysed, and a fraction containing FITC-Dextran-loaded lysosomes was isolated by sedimentation centrifugation. Fluorescence was measured over time to assess pH-dependent quenching following addition of 1 mM magnesium-ATP (predetermined). ATP-dependent fluorescence quenching was not observed for 249C- or BafA1-treated samples. Representative of five individual experiments with n = 3 for each is presented (mean ± s.d.). d, Mammalian V-ATPase activity measured in the absence and presence of 1 μM 249C and 1 μM BafA1. Data shown are mean ± s.d., n = 3. e,f, BLI of the entire mammalian V-ATPase complex (e; association protein concentrations: 30, 60, 120, 240 nM) and the individual human H subunit (ATP6V1H) (f; association protein concentrations, 16,800 and 21,000 nM) against biotinylated 249C loaded onto streptavidin sensor tips. A reference sensor was subtracted from the signal to blank the system. The ForteBio Octet software on the BLI system was used to calculate Kd . The V-ATPase complex: Kd = 23 ± 0.83 nM; H subunit: Kd = 501 ± 22 nM. Representative raw traces are presented from two independent experiments. See Supplementary Fig. 5f for experimental schematic. Source data
Fig. 5
Fig. 5. 249C differentially inhibits fibroblasts bearing mutations in KRAS and BRAF via inhibition of lysosomal pH, V-ATPase activity, and macropinocytosis.
a, MEFs bearing only single point mutations in human KRAS/BRAF treated with 249C. IC50 values: KRAS WT (1.25 µM); G13D (0.07 µM); G12V (0.15 µM); G12S (0.23 µM); G12D (0.3 µM); Q61L (0.31 µM); G12C (0.44 µM); Q61R (0.55 µM); and for BRAFV600E (0.11 µM). P values calculated relative to WT cells treated with 249C. Molecule 68 shown for comparison. Cell proliferation assays of stable cell lines treated with V-ATPase inhibitors 249C and BafA1, HCQ analog (DC661), KRASG12C inhibitor (AMG510) and autophagy inducer (CMA). Each bar represents the mean of n = 3 biological replicates; two-sided t-test with no adjustments for multiple comparisons. Note, nM used for BafA1. IC50s > 5 µM were not determined and axes are truncated for clarity. b, Basal levels of pH (yellow, acidic; blue, neutral; LysoSensor) in MEFs. Representative images from n > 3 (Supplementary Fig. 8). c, After 2 h of 249C treatment (or DMSO), FITC-Dextran-loaded lysosomes were isolated from MEFs as in Fig. 3f (see also Supplementary Fig. 8 for DMSO + ATP + MgCl2 values). Representative of two individual experiments with n = 3 (mean ± s.d.); two-sided t-test. d, Representative electron microscopy images for MEF KRAS WT and G13D showing multivesicular AVs after 250 nM 249C treatment for 20 h. Scale bars, 5 µm. Electron microscopy images were stitched together from multiple smaller frames with differences in contrast. e, Mean fold change (±s.e.m.) of AV diameter (µM) in MEFs counted on electron microscopy images before and after treatment. n = 100 cells per condition; two-sided t-test. f, Treatment with 100 nM 249C followed by quantification of double-positive Annexin-V+/PI+ cells by flow cytometry at 48 h relative to DMSO controls. Representative of three independent experiments; two-tailed Student’s t-test. g, Fluorescence micrographs showing TMR–dextran uptake after 249C treatment. h, Quantification of TMR–dextran uptake. For each cell line, DMSO is set at 100%. The number of objects per nucleus was quantified using high-content imaging software (n = 3) data are mean ± s.d.; two-tailed Student’s t-test.
Fig. 6
Fig. 6. 249C treatment inhibits in vivo growth of mutant KRAS in mouse xenograft models and shows pharmacodynamic safety.
a, Five-week-old athymic mice were inoculated with 5 × 106 non-small cell lung cancer (NSCLC) A549 (KRASG12S) cells in the lower flank region to establish tumors and randomly assigned to treatment regimens of DMSO vehicle control or 249C (10 mg kg−1, twice a day, intraperitoneally (i.p.)). Changes in tumor volume of mice treated with the vehicle control or 249C (n = 7; P = 2.9 × 10−7) over the course of the study are shown. Two-sided t-test. b, At the end point, tumor mass was determined on harvested tumors by weighing (n = 7; P = 5.3 × 10−6). Two-sided t-test. c, The safest highest dose of 249C measured is 150 mg kg−1 as no significant difference in body weight was observed after 21 days in vivo (n = 7). d,e, in vitro (d) and (e) in vivo activity of 249C in SW48 isogenic xenografts: antitumor activity of 249C on tumor volume in SW48, SW48 KRASG12D/+, SW48 KRASG12V/+, and SW48 KRASG13D/+ xenografts presented as treatment/control (%) and tumor growth inhibition (%) at day 21. Tumor growth of SW48 colon tumor xenografts over time for vehicle control and 249C-treated animals bearing isogenic SW48 (parental, KRASG12D/+, KRASG12V/+, KRASG13D/+) cells in athymic mice. fi, Changes in tumor volume for (f) SW48 (P = 0.97), (g) SW48 KRASG12D/+ (P = 0.79), (h) SW48 KRASG12V/+ (P = 0.005), and (i) SW48 KRASG13D/+ (P = 9.6 × 10−6) after 14 days of treatment (10 mg kg−1 249C or vehicle control, i.p., n = 5 for all arms). Two-sided t-test. j, Body weight of the mice bearing SW48 cells over 21 days. k, Percent inhibition in fluorescence polarization assays of human ether-à-go-go-related gene (hERG) by Hydroxychloroquine (HCQ) (~60% at 30 µM), Bafilomycin A1 (BafA1) (35% at 30 µM) and 249C (0% at 30 µM) (mean ± s.d.; n = 3) (Supplementary Fig. 9). l, In vitro BioMap Safety and Toxicology screening profile of HCQ, BafA1, and 249C at 1,000 nM across over 100-panel biomarker readouts. Data are mean ± s.d.

Similar articles

Cited by

References

    1. Simanshu DK, Nissley DV, McCormick F. RAS proteins and their regulators in human disease. Cell. 2017;170:17–33. doi: 10.1016/j.cell.2017.06.009. - DOI - PMC - PubMed
    1. Cox AD, Fesik SW, Kimmelman AC, Luo J, Der CJ. Drugging the undruggable Ras: mission possible? Nat. Rev. Drug Discov. 2014;11:828–851. doi: 10.1038/nrd4389. - DOI - PMC - PubMed
    1. Waters AM, Der CJ. KRAS: the critical driver and therapeutic target for pancreatic cancer. Cold Spring Harb. Perspect. Med. 2018;8:a031435. doi: 10.1101/cshperspect.a031435. - DOI - PMC - PubMed
    1. Hobbs AG, Der CJ, Rossman KL. RAS isoforms and mutations in cancer at a glance. J. Cell Sci. 2016;129:1287–1292. - PMC - PubMed
    1. Choi AM, Ryter SW, Levine B. Autophagy in human health and disease. N. Engl. J. Med. 2013;368:651–662. doi: 10.1056/NEJMra1205406. - DOI - PubMed

Publication types

MeSH terms

Substances