. 2022 Jul 25;13(1):4297.
doi: 10.1038/s41467-022-32023-7.

Therapeutic targeting of ATR in alveolar rhabdomyosarcoma

Affiliations

Therapeutic targeting of ATR in alveolar rhabdomyosarcoma

Heathcliff Dorado García et al. Nat Commun. .

Abstract

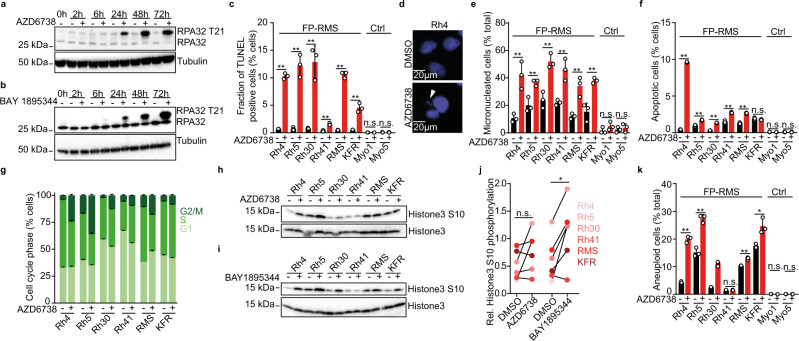
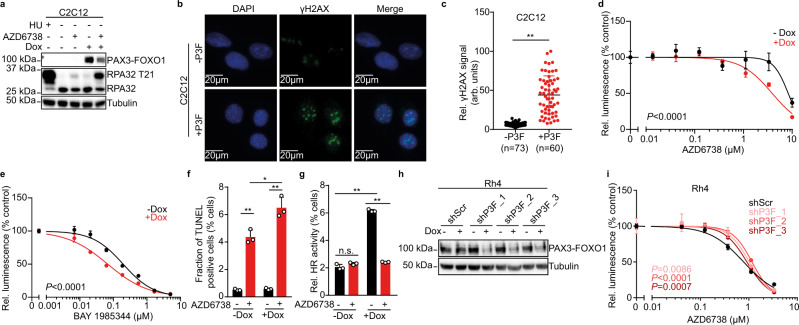
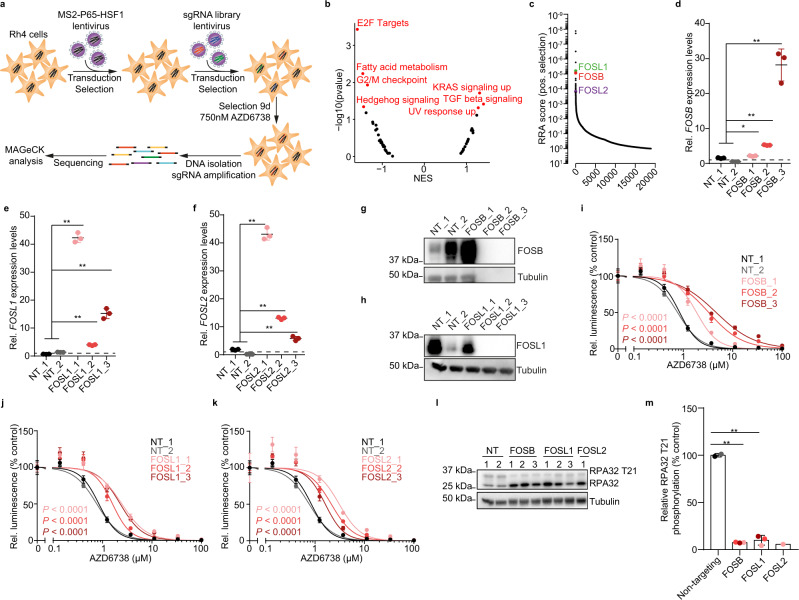
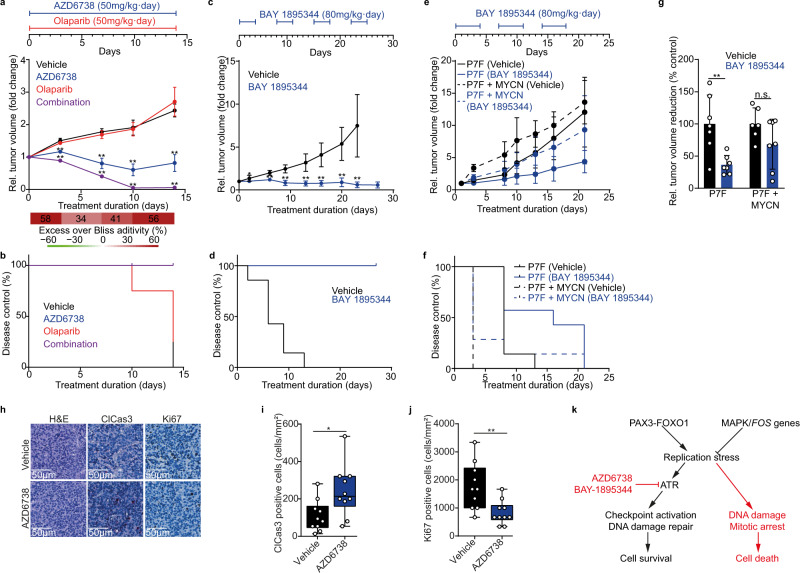
Despite advances in multi-modal treatment approaches, clinical outcomes of patients suffering from PAX3-FOXO1 fusion oncogene-expressing alveolar rhabdomyosarcoma (ARMS) remain dismal. Here we show that PAX3-FOXO1-expressing ARMS cells are sensitive to pharmacological ataxia telangiectasia and Rad3 related protein (ATR) inhibition. Expression of PAX3-FOXO1 in muscle progenitor cells is not only sufficient to increase sensitivity to ATR inhibition, but PAX3-FOXO1-expressing rhabdomyosarcoma cells also exhibit increased sensitivity to structurally diverse inhibitors of ATR. Mechanistically, ATR inhibition leads to replication stress exacerbation, decreased BRCA1 phosphorylation and reduced homologous recombination-mediated DNA repair pathway activity. Consequently, ATR inhibitor treatment increases sensitivity of ARMS cells to PARP1 inhibition in vitro, and combined treatment with ATR and PARP1 inhibitors induces complete regression of primary patient-derived ARMS xenografts in vivo. Lastly, a genome-wide CRISPR activation screen (CRISPRa) in combination with transcriptional analyses of ATR inhibitor resistant ARMS cells identifies the RAS-MAPK pathway and its targets, the FOS gene family, as inducers of resistance to ATR inhibition. Our findings provide a rationale for upcoming biomarker-driven clinical trials of ATR inhibitors in patients suffering from ARMS.


Conflict of interest statement

A.M.W. is employed by Bayer AG. A.G.H. has received research funding from Bayer AG. The remaining authors declare no competing interests.

Figures

Fig. 1
Fig. 1. Fusion-positive ARMS cells are sensitive to pharmacological ATR inhibition.
a Schematic of the DNA damage response pathway and small molecule inhibitor targeting proteins involved. DSB = Double Strand Break, SSB = Single Strand Break. b Heatmap showing sensitivity of ARMS (FP-RMS), Ewing sarcoma (EWS), ERMS (FN-RMS), and primary myoblast control cells (Ctrl) to the different DNA damage response inhibitors (blue indicates high sensitivity and red low sensitivity as defined by the rank of IC50 values). c Dose-response curves of cell viability for FP-RMS cell lines treated with the ATR inhibitor AZD6738 compared to primary myoblasts (n = 3). d IC50 values for FP-RMS, EWS, FN-RMS and Ctrl cells treated with AZD6738 (P = 4.10 × 10−3; 6.00 × 10−4; 6.30 × 10−3 for EWS, FP-RMS and FN-RMS vs Ctrl, respectively; from left to right, n = 8, 6, 5, and 5 biologically independent cells). e Dose-response curves of cell viability for FP-RMS cell lines treated with the ATR inhibitor BAY 1895344 compared to primary myoblasts (n = 3). f IC50 values for FP-RMS, EWS, FN-RMS and Ctrl cells treated with BAY 1895344 (P = 2.31 × 10−4; 4.59 × 10−5; 0.116 for EWS, FP-RMS and FN-RMS vs Ctrl, respectively; from left to right, n = 8, 6, 5, and 5 biologically independent cells). All statistical analyses correspond to two-sided student’s t-test; data presented as mean value ± error bars representing standard deviation.
Fig. 2
Fig. 2. ATR inhibition induces replication stress-associated DNA damage, genomic instability, apoptosis and cell cycle disruption.
Western immunoblot of RPA32 phosphorylation at T21 in Rh4 cells treated with ATR inhibitor AZD6738 (750 nM) (a) and BAY 1895344 (20 nM) (b). c Quantification of TUNEL signal in cells treated with AZD6738 for 72 h. (n = 3; from left to right, P = 5.97 × 10−6; 6.51 × 10−4; 0.002; 0.001; 6.88 × 10−6; 9.04 × 10−4; 0.734; 0.980). d Representative photomicrographs of micronucleation in cells. White arrow represents micronuclei. e Fraction of micronucleated cells after treatment with AZD6738 for 72 h. (n = 3, with 50 nuclei counted per replicate; P = 0.007; 0.007; 0.004; 0.007; 0.007; 0.004; 0.206; 0.768). f Fraction of apoptotic cells after treatment with AZD6738 for 72 h. (n = 3; from left to right, P = 4.54 × 10−9; 7.12 × 10−4; 6.12 × 10−6; 2.46 × 10−4; 6.52 × 10−5; 0.313; 0.424; 0.713). g Cell cycle phase distribution of cells after treatment with AZD6738 for 72 h. (n = 3). Western immunoblot of histone 3 phosphorylation at S10 in six FP-RMS cells treated with AZD6738 (h) and BAY 1895344 (i) for 2 h. j Quantification of changes in histone 3 S10 phosphorylation (P = 0.344; 0.016; statistical analysis is sign test). k Fraction of aneuploid cells after treatment with AZD6738 for 72 h. (n = 3; from left to right, P = 2.55 × 10−5; 5.45 × 10−4; 6.56 × 10−5; 0.402; 5.13 × 10−4; 0.012; 0.882; 0.565). All statistical analyses correspond to two-sided student’s t-test except for (j) data presented as mean value ± error bars representing standard deviation.
Fig. 3
Fig. 3. Pharmacological ATR inhibition has on-target activity and leads to reduced BRCA1 activation and repressed homologous recombination.
a Volcano plot showing relative changes in phospho-peptide abundance in PAX3-FOXO1-expressing Rh30 cells after 2 h of incubation with AZD6738 (750 nM) measured using LC-MS/MS proteomics (red, known ATR targets; dotted line indicating a false discovery rate (FDR) of 0.001). b Volcano plot showing relative enrichment of molecular pathways in which differential phospho-peptide abundance was observed in cells treated with AZD6738 (750 nM) compared to DMSO-treated cells (dotted line indicating a false discovery rate of 0.05). c Cellular processes significantly enriched in differentially abundant phospho-peptides. Western immunoblotting of BRCA1 S1524 and total BRCA1 in six FP-RMS cells after 2 hours of treatment with AZD6738 (750 nM) (d) or BAY 1895344 (20 nM) (e). f Quantification of changes in BRCA1 S1524 phosphorylation (P = 0.016; 0.016 for d and e, respectively; statistical analysis is sign test). g Relative HR activity in Rh4 and Rh30 cells after incubation with AZD6738 (750 nM), measured as GFP reconstitution based on repair of an SceI-mediated DNA lesion via homologous recombination. (n = 3 biologically independent experiments; P = 0.003; 2.61 × 10−6 for Rh4 and Rh30, respectively). h Excess over Bliss analysis of combined treatment with olaparib and AZD6738 in Rh4 cells (n = 3). i Bliss synergy scores for six FP-RMS cell lines treated with AZD6738 and olaparib. All statistical analyses correspond to two-sided student’s t-test except for 3f; data presented as mean value ± error bars representing standard deviation.
Fig. 4
Fig. 4. PAX3-FOXO1 is sufficient to increase sensitivity to ATR inhibition in myoblast cells.
a Western immunoblot of PAX3-FOXO1 and RPA32 phosphorylation at T21 in C2C12 after doxycycline-induced expression of PAX3-FOXO1 (1000 ng/ml for 48 h) and treatment with AZD6738 (750 nM). Hydroxyurea (HU, 1 mM) was used as a control for replication stress. b Representative images of H2AX phosphorylation in C2C12 cells after ectopic expression of PAX3-FOXO1. c Quantification of H2AX phosphorylation in C2C12 cells after ectopic expression of PAX3-FOXO1 (P = 9.57 × 10−26). Dose-response curves of cell viability for C2C12 cells after ectopic expression of PAX3-FOXO1 and incubation with AZD6738 (d) or BAY 1895344 (e) (n = 3). f Quantification of TUNEL signal in C2C12 cells after induction of PAX3-FOXO1 with doxycycline and treatment with AZD6738 (n = 3; from top to bottom, P = 0.016; 1.84 × 10−4; 1.99 × 10−4). g Relative HR activity in C2C12 cells after induction of PAX3-FOXO1 with doxycycline (1000 ng/ml) and incubation with AZD6738 as measured using a GFP reconstitution assay based on repair of an SceI-mediated DNA lesion via homologous recombination (n = 3 biologically independent experiments; from top to bottom, P = 5.19 × 10−6; 3.67 × 10−7; 0.114). h Western immunoblot of PAX3-FOXO1 in Rh4 cells after doxycycline-induced (1000 ng/mL) expression of shRNAs targeting PAX3-FOXO1 compared to scrambled shRNA control for 48 h. i Dose-response curves for Rh4 after doxycycline-induced (1000 ng/mL) expression of shRNAs targeting PAX3-FOXO1 compared to scrambled shRNA control and treated with AZD6738 (n = 3). All statistical analyses correspond to two-sided student’s t-test; data presented as mean value ± error bars representing standard deviation.
Fig. 5
Fig. 5. A genome wide CRISPR-based activation screen identifies molecular modifiers of sensitivity to ATR inhibition in PAX3-FOXO1-expressing ARMS cells.
a Schematic representation of the genome wide CRISPRa screen experimental design. b Enrichment score for the GSEA hallmark pathways based on sgRNA enrichment. c Waterfall plot showing the positive robust rank aggregation (RRA) score of sgRNAs in Rh4 cells incubated in the presence of AZD6738 for 9 days compared to DMSO treated cells as analyzed using MAGeCK. FOSB (d, P = 0.014; 5.45 × 10−6; 1.17 × 10−6), FOSL1 (e, P = 9.09 × 10−11; 5.16 × 10−6; 2.19 × 10−7) and FOSL2 (f P = 9.87 × 10−10; 1.49 × 10−7; 1.15 × 10−4) mRNA expression measured using RT-qPCR in Rh30 cells expressing dCas9, lentiMPH and sgRNAs targeting FOSB, FOSL1 or FOSL2 (n = 3). Western immunoblot of FOSB (g) and FOSL1 (h) in Rh30 cells stably expressing dCas9, lentiMPH and sgRNAs targeting FOSB and FOSL1, respectively. Relative cell viability of Rh30 cells stably expressing dCas9, lentiMPH and sgRNAs targeting FOSB (i), FOSL1 (j) and FOSL2 (k) in the presence of varying concentrations of AZD6738. l Western immunoblot of RPA32 phosphorylation at T21 in Rh4 cells expressing sgRNAs targeting FOS family members FOSB, FOSL1 or FOSL2. m Quantification of RPA32 phosphorylation at T21compared to the corresponding non-targeting control, (P = 2.66 × 10−6; 1.78 × 10−4, respectively). All statistical analyses correspond to two-sided student’s t-test; data presented as mean value ± error bars representing standard deviation.
Fig. 6
Fig. 6. ATR inhibitor-resistant cells express FOSB and activated MAPK pathway.
a Schematic representation of the generation of ATR inhibitor-resistant cells by long-term exposure to increasing doses of the ATR inhibitors AZD6738 and BAY 1895344. Dose-response curves of cell viability for resistant cells after incubation with AZD6738 (b) or BAY 1895344 (c) compared to treatment-naïve cells (n = 3 biologically independent experiments). d Heatmap of the 500 most variable genes based on RNA sequencing. Enrichment score for the GSEA hallmark pathways in ATR inhibitor-resistant cells based on RNA sequencing data, showing negatively (e) and positively enriched pathways (f). Western immunoblotting of RAS-MAPK pathway members in cells resistant to AZD6738 (g) or BAY 1895344 (h) compared to treatment-naïve cells. i Quantification of changes in c-Raf and ERK1/2 phosphorylation as measured in (g-h). All statistical analyses correspond to two-sided student’s t-test; data presented as mean value ± error bars representing standard deviation.
Fig. 7
Fig. 7. ATR inhibition sensitizes ARMS PDXs to PARP1 inhibition in vivo.
a Tumor volume change of an ARMS PDX treated with AZD6738, olaparib or both compared to control (n = 4 mice per group; bottom, excess over Bliss additivity, ** P < 0.01). b Kaplan–Meier curve showing tumor doubling time after treatment. c Tumor volume change of the ARMS PDX treated with BAY 1895344 as compared to control (n = 7 mice per group; top, timeline of the drug schedule, ** P < 0.01). d Kaplan–Meier curve showing tumor doubling time after treatment. e Tumor volume change of an ARMS PDX harboring a PAX7-FOXO1 and a relapse with an additional MYCN amplification, treated with BAY 1895344 as compared to control (n = 7 mice per group; top, timeline of the drug schedule). f Kaplan–Meier curve showing tumor doubling time after treatment. g Tumor volume reduction at the endpoint of the treatment with BAY 1895344 or vehicle in a PAX7-FOXO1 ARMS PDX and a PAX7-FOXO1 MYCN amplified ARMS PDX (n = 6 mice for vehicle and n = 7 mice for BAY 1895344 treatment; P = 0.004; 0.117, respectively.) h Representative immunohistochemistry staining for cleaved Caspase3 and Ki67. Quantification of cleaved Caspase3 (i) and Ki67 (j) (n = 10 sections of 275µmx275µm; P = 0.005). k Schematic of our proposed model. PAX3-FOXO1 induces replication stress, which activates the ATR signaling pathway, promoting checkpoint activation and DNA repair. With ATR inhibitors, replication stress cannot be repaired, leading to DNA damage accumulation, mitotic arrest, and cell death. A proposed counteractive measure is the activation of the RAS-MAPK pathway, in particular FOS genes, to reduce replication stress. All statistical analyses correspond to two-sided student’s t-test; data presented as mean value ± error bars representing standard deviation. Box plots (i and j) show center line as median, box limits as upper and lower quartiles, whiskers as minimum to maximum values.

References

    1. Ognjanovic S, Linabery AM, Charbonneau B, Ross JA. Trends in childhood rhabdomyosarcoma incidence and survival in the United States, 1975–2005. Cancer. 2009;115:4218–4226. doi: 10.1002/cncr.24465. - DOI - PMC - PubMed
    1. Douglass EC, et al. A specific chromosomal abnormality in rhabdomyosarcoma. Cytogenet Cell Genet. 1987;45:148–155. doi: 10.1159/000132446. - DOI - PubMed
    1. Douglass EC, et al. Variant translocations of chromosome 13 in alveolar rhabdomyosarcoma. Genes Chromosomes Cancer. 1991;3:480–482. doi: 10.1002/gcc.2870030611. - DOI - PubMed
    1. Keller C, et al. Alveolar rhabdomyosarcomas in conditional Pax3:Fkhr mice: Cooperativity of Ink4a/ARF and Trp53 loss of function. Genes Dev. 2004;18:2614–2626. doi: 10.1101/gad.1244004. - DOI - PMC - PubMed
    1. Perkins SM, Shinohara ET, DeWees T, Frangoul H. Outcome for children with metastatic solid tumors over the last four decades. PLoS One. 2014;9:e100396. doi: 10.1371/journal.pone.0100396. - DOI - PMC - PubMed

Publication types

MeSH terms

Substances