

Polarimetric biomarkers of peri-tumoral stroma can correlate with 5-year survival in patients with left-sided colorectal cancer
- PMID: 35879367
- PMCID: PMC9314438
- DOI: 10.1038/s41598-022-16178-3
Polarimetric biomarkers of peri-tumoral stroma can correlate with 5-year survival in patients with left-sided colorectal cancer
Abstract
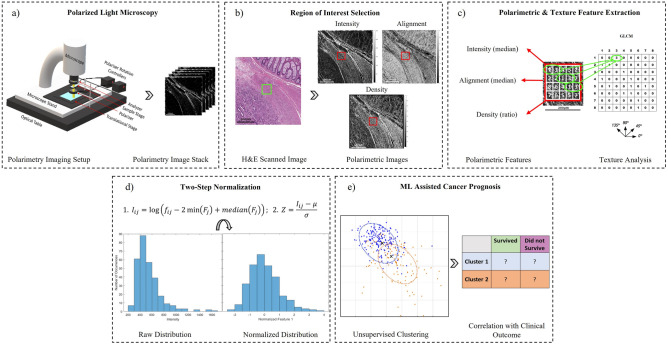
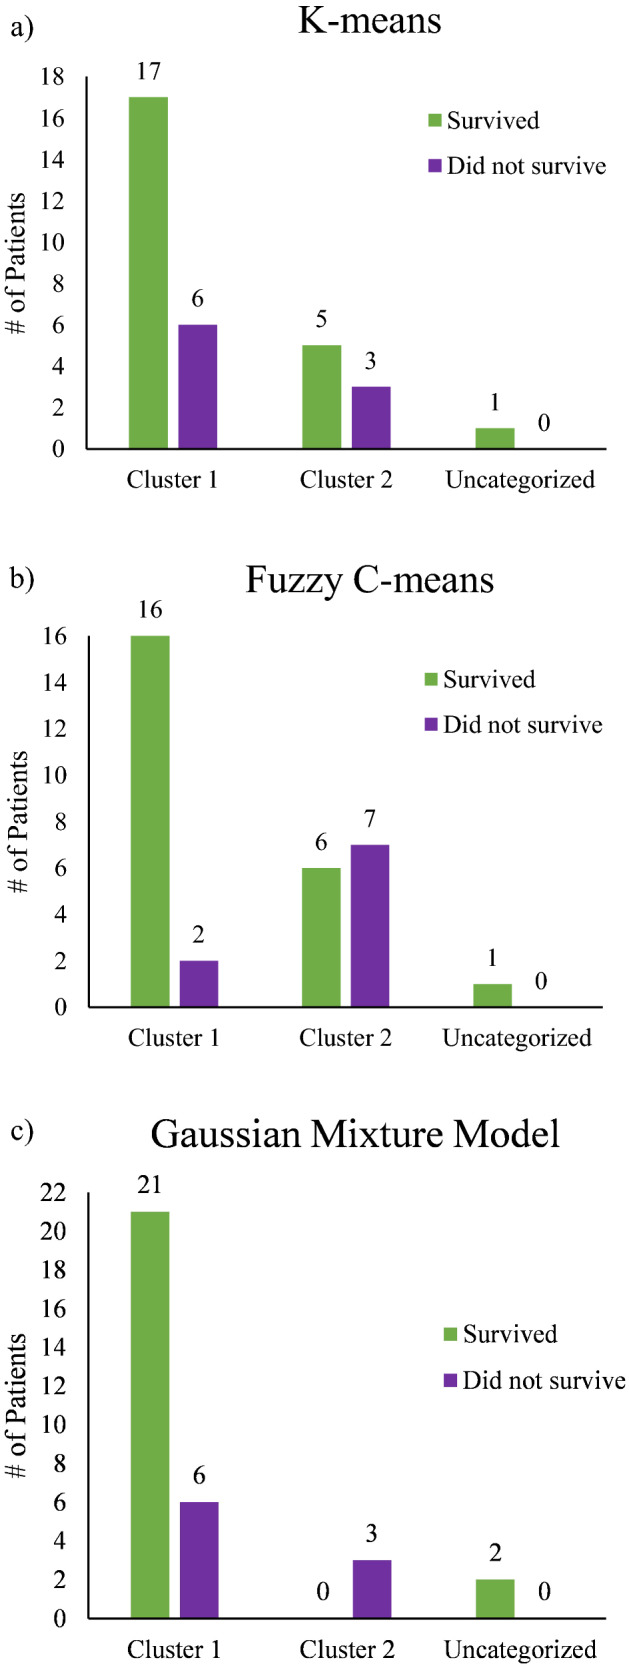
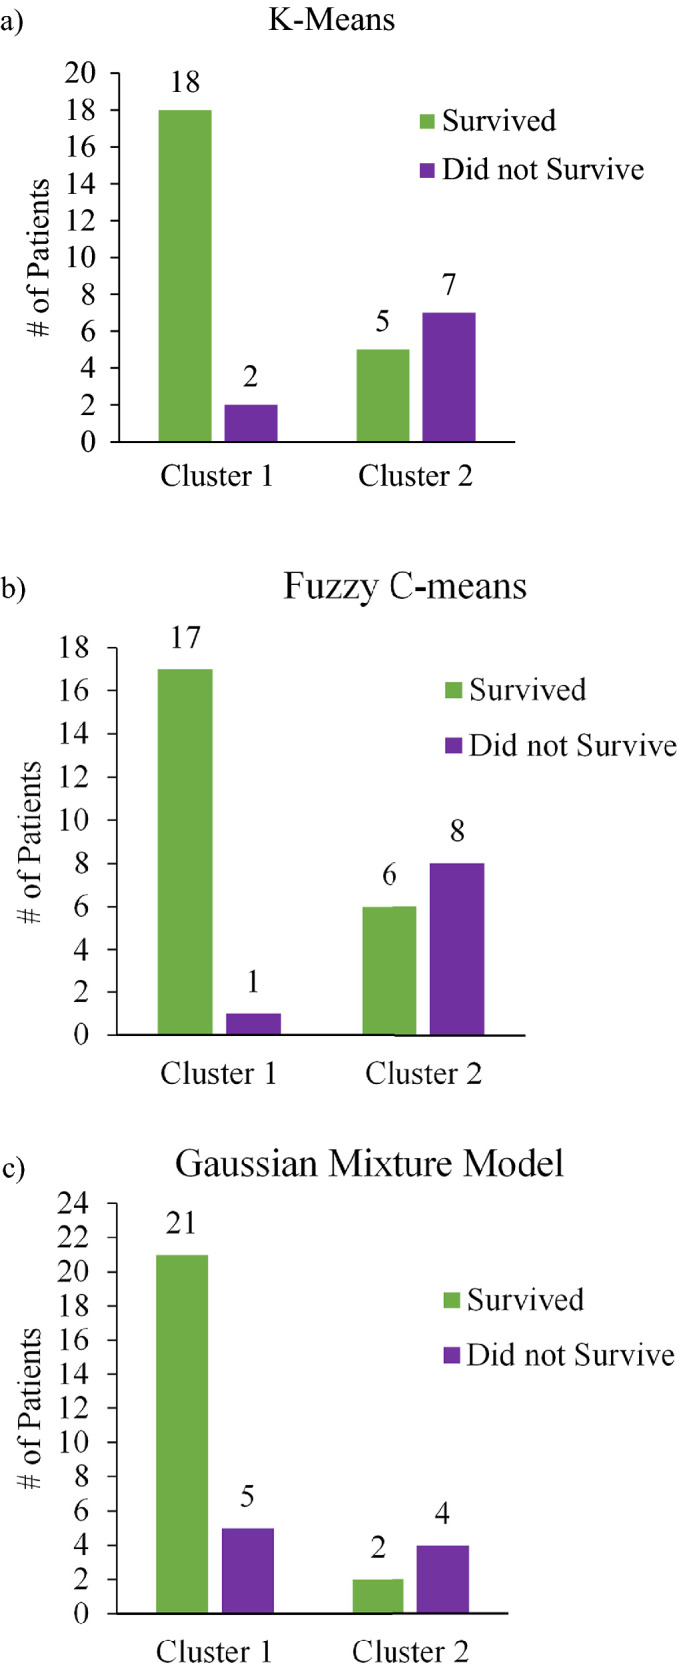
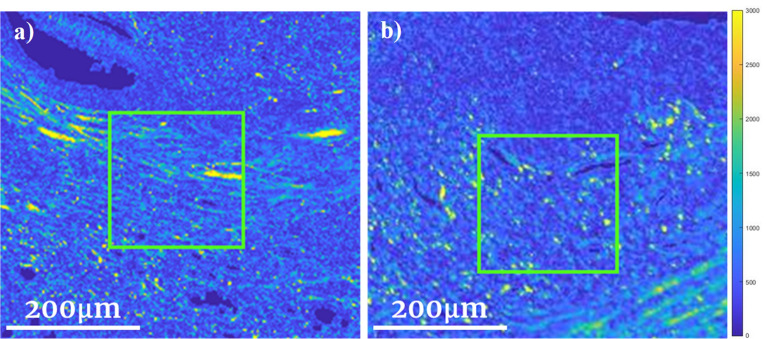
Using a novel variant of polarized light microscopy for high-contrast imaging and quantification of unstained histology slides, the current study assesses the prognostic potential of peri-tumoral collagenous stroma architecture in 32 human stage III colorectal cancer (CRC) patient samples. We analyze three distinct polarimetrically-derived images and their associated texture features, explore different unsupervised clustering algorithm models to group the data, and compare the resultant groupings with patient survival. The results demonstrate an appreciable total accuracy of ~ 78% with significant separation (p < 0.05) across all approaches for the binary classification of 5-year patient survival outcomes. Surviving patients preferentially belonged to Cluster 1 irrespective of model approach, suggesting similar stromal microstructural characteristics in this sub-population. The results suggest that polarimetrically-derived stromal biomarkers may possess prognostic value that could improve clinical management/treatment stratification in CRC patients.
© 2022. The Author(s).
Conflict of interest statement
The authors declare no competing interests.
Figures


Similar articles
-
Machine learning based local recurrence prediction in colorectal cancer using polarized light imaging.J Biomed Opt. 2024 May;29(5):052915. doi: 10.1117/1.JBO.29.5.052915. Epub 2023 Nov 23. J Biomed Opt. 2024. PMID: 38077502 Free PMC article.
-
Mueller matrix polarization parameters correlate with local recurrence in patients with stage III colorectal cancer.Sci Rep. 2023 Aug 17;13(1):13424. doi: 10.1038/s41598-023-40480-3. Sci Rep. 2023. PMID: 37591987 Free PMC article.
-
Sidedness Matters: Surrogate Biomarkers Prognosticate Colorectal Cancer upon Anatomic Location.Oncologist. 2019 Aug;24(8):e696-e701. doi: 10.1634/theoncologist.2018-0351. Epub 2019 Feb 12. Oncologist. 2019. PMID: 30755502 Free PMC article.
-
A Holistic Appraisal of Stromal Differentiation in Colorectal Cancer: Biology, Histopathology, Computation, and Genomics.Pathol Res Pract. 2021 Apr;220:153378. doi: 10.1016/j.prp.2021.153378. Epub 2021 Feb 13. Pathol Res Pract. 2021. PMID: 33690050 Review.
-
[Prognostic biomarkers for metastatic colorectal cancer].Pathologe. 2016 Nov;37(Suppl 2):180-185. doi: 10.1007/s00292-016-0204-6. Pathologe. 2016. PMID: 27638531 Review. German.
Cited by
-
Machine learning based local recurrence prediction in colorectal cancer using polarized light imaging.J Biomed Opt. 2024 May;29(5):052915. doi: 10.1117/1.JBO.29.5.052915. Epub 2023 Nov 23. J Biomed Opt. 2024. PMID: 38077502 Free PMC article.
-
Investigation of potential prognostic biomarkers for colorectal cancer.Arch Med Sci. 2023 Jul 1;21(2):425-436. doi: 10.5114/aoms/167397. eCollection 2025. Arch Med Sci. 2023. PMID: 40395892 Free PMC article.
-
Mueller matrix polarization parameters correlate with local recurrence in patients with stage III colorectal cancer.Sci Rep. 2023 Aug 17;13(1):13424. doi: 10.1038/s41598-023-40480-3. Sci Rep. 2023. PMID: 37591987 Free PMC article.
References
-
- van Wyk HC, Roseweir A, Alexander P, Park JH, Horgan PG, McMillan DC, Edwards J. The relationship between tumor budding, tumor microenvironment, and survival in patients with primary operable colorectal cancer. Ann. Surg. Oncol. 2019;26(13):4397–4404. doi: 10.1245/s10434-019-07931-6. - DOI - PMC - PubMed
Publication types
MeSH terms
Substances
Grants and funding
LinkOut - more resources
Full Text Sources
Medical
