. 2022 Jul 25;12(1):11937.
doi: 10.1038/s41598-022-15861-9.

Altered genome-wide hippocampal gene expression profiles following early life lead exposure and their potential for reversal by environmental enrichment

Affiliations

Altered genome-wide hippocampal gene expression profiles following early life lead exposure and their potential for reversal by environmental enrichment

G Singh et al. Sci Rep. .

Abstract

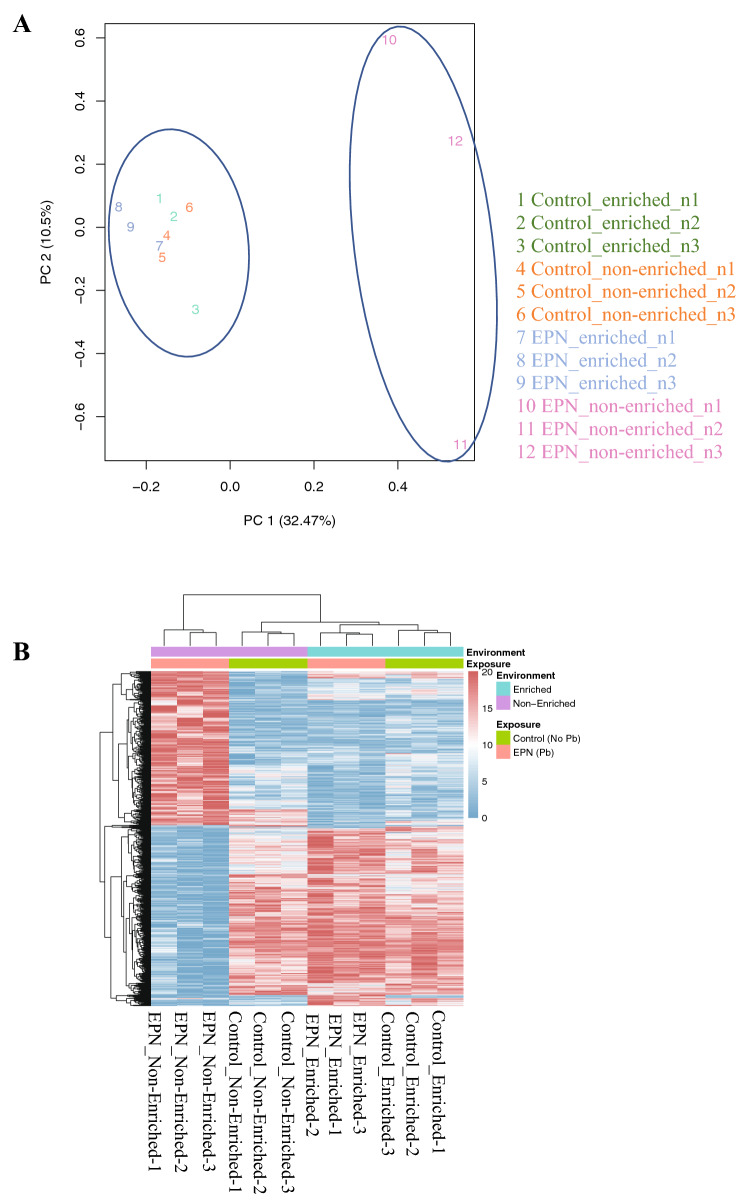
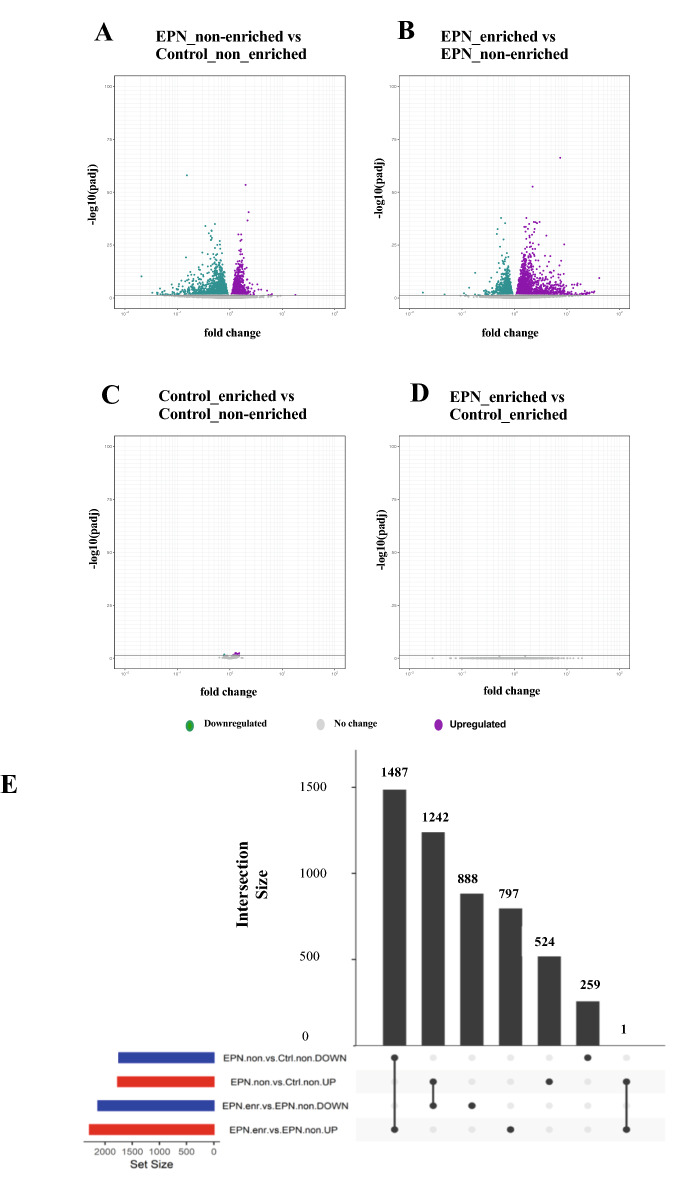
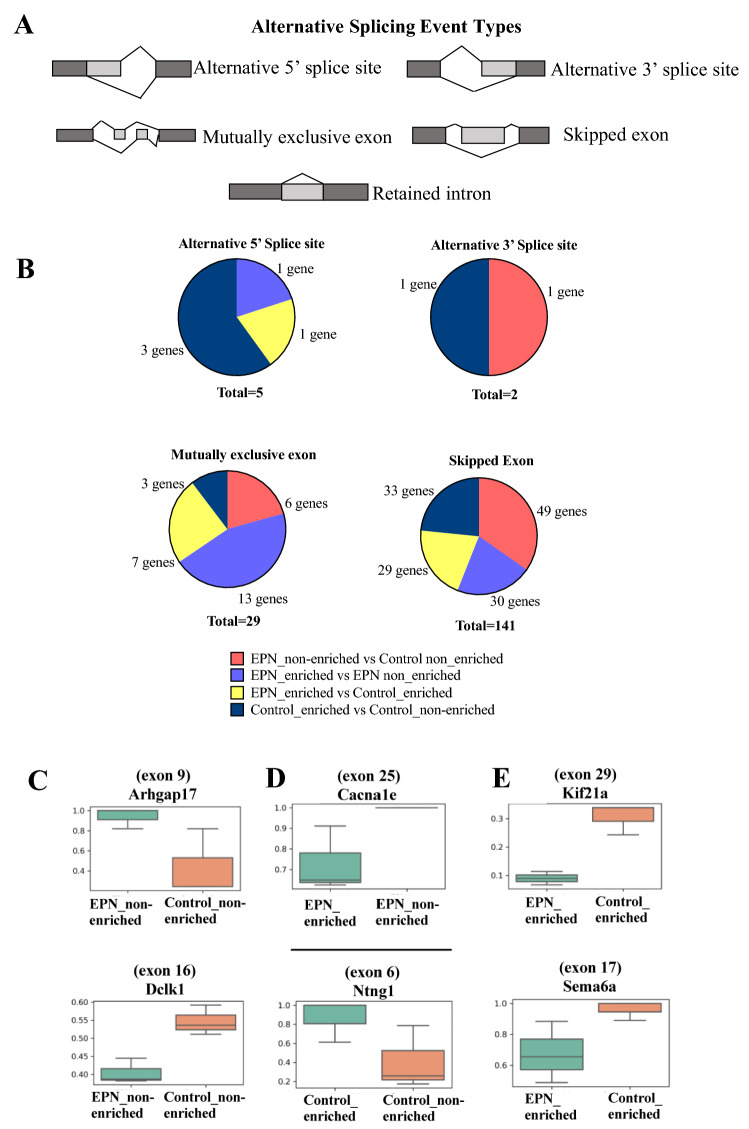
Early life lead (Pb) exposure is detrimental to neurobehavioral development. The quality of the environment can modify negative influences from Pb exposure, impacting the developmental trajectory following Pb exposure. Little is known about the molecular underpinnings in the brain of the interaction between Pb and the quality of the environment. We examined relationships between early life Pb exposure and living in an enriched versus a non-enriched postnatal environment on genome-wide transcription profiles in hippocampus CA1. RNA-seq identified differences in the transcriptome of enriched vs. non-enriched Pb-exposed animals. Most of the gene expression changes associated with Pb exposure were reversed by enrichment. This was also true for changes in upstream regulators, splicing events and long noncoding RNAs. Non-enriched rats also had memory impairments; enriched rats had no deficits. The results demonstrate that an enriched environment has a profound impact on behavior and the Pb-modified CA1 transcriptome. These findings show the potential for interactions between Pb exposure and the environment to result in significant transcriptional changes in the brain and, to the extent that this may occur in Pb-exposed children, could influence neuropsychological/educational outcomes, underscoring the importance for early intervention and environmental enrichment for Pb-exposed children.


Conflict of interest statement

The authors declare no competing interests.

Figures

Figure 1
Figure 1
(A) Experimental study design. Long Evans rats received early postnatal (EPN) Pb exposure (150 ppm) via dams receiving Pb-containing diet beginning at postnatal day (PND) 1 through weaning (PND 21). On PND 21, female pups were randomly assigned to either the enriched or non-enriched environment. Controls (no Pb, 0 ppm) were similarly randomized to an enriched or non-enriched environment at weaning. The four experimental groups were: Control (0 ppm)_non-enriched, Control (0 ppm)_enriched, EPN Pb (150 ppm)_non-enriched, and EPN Pb (150 ppm)_enriched. At PND 55, some animals were randomly taken for trace fear conditioning while others were randomly selected for tissue collection. Behaviorally tested animals were assessed for post-conditioning memory retention at 1, 2 and 10 days after conditioning. Behaviorally naïve animals were euthanized to collect CA1 of the HIPP for RNA-sequencing. (B) Environmental enrichment mitigated negative effects of EPN Pb exposure on associative memory in the trace fear conditioning test. Lead-exposed animals living in the non-enriched environment had memory deficits detected at 1, 2 and 10 days after training. In contrast, Pb-exposed animals living in the enriched environment had no significant memory deficits. Data shown are group mean ± S.E.M; N = 6 per group; *p < 0.05.
Figure 2
Figure 2
Principle component analysis (PCA) and hierarchical clustering of HIPP CA1 RNA-seq data. (A) PCA analysis across all samples and treatment conditions, based on overall gene expression profiles, shows EPN_non-enriched animals clustered in a distinct group compared to the other groups (Control_non-enriched, Control_enriched and EPN_enriched). (B) Heatmaps generated from unsupervised clustering of genes with the highest variation across the dataset show effects of Pb exposure and enrichment on gene expression patterns (FDR < 0.05, one-way ANOVA across all the treatment groups, see Supplementary Material 5). Transcriptomic changes in the EPN_non-enriched groups were distinct from those in the Control_(enriched or non-enriched) and EPN_enriched groups, while the heatmaps from EPN_enriched and Control_(enriched or non-enriched) animals were quite similar. N = 3 per group.
Figure 3
Figure 3
Analysis of differentially expressed genes (DEGs) showed that the Pb-altered transcriptome was further modified by environmental enrichment. (AD) Volcano plots show log2 fold changes and associated p-values for DEGs in the various group comparisons: (A) EPN_non-enriched vs Control_non-enriched; (B) EPN_enriched vs EPN_non-enriched; (C) Control_enriched vs Control_non-enriched; (D) EPN_enriched vs Control_enriched. Green colored circles indicate genes that were significantly differentially downregulated; magenta-colored circles indicate genes that were significantly differentially upregulated (FDR < 0.05); grey colored circles indicate genes with expression unchanged. (E) Set comparison analysis of DEGs (FDR < 0.05) showed that environmental enrichment largely reversed Pb-induced transcriptome alterations. DEG sets are shown at the bottom with red and blue bars indicating the relative gene set size, where blue highlights downregulation and red highlights upregulation. Connectors joining two DEG set rows indicate overlap between those sets, where the bar heights on the graph represent set intersection sizes (noted by the numbers above each bar). Living in enriched environment resulted in upregulation of 1487 genes that were downregulated due to Pb exposure and downregulation of 1242 genes that were upregulated by Pb exposure.
Figure 4
Figure 4
Gene ontology (GO) analysis of DEGs. Biological, Cellular, and Molecular processes that were significantly enriched due to Pb exposure associated with (A) upregulated or (B) downregulated genes (EPN_non-enriched vs Control_non-enriched). Panels (C) and (D) similarly show Biological, Cellular, and Molecular processes that were significantly enriched in response to environmental enrichment in Pb exposed animals (EPN_enriched vs EPN_non-enriched) and associated with upregulated or downregulated genes, respectively.
Figure 5
Figure 5
Alternative splicing (AS) events affected by Pb exposure and environmental enrichment. (A) Illustration of the five AS event types examined. (B) Types of AS events and number of involved genes detected in exposure-wise comparisons. The most significantly enriched AS event was skipped exon events. (CE) Examples of differential exon skipping events in genes with neuronal functions in different exposure-wise comparisons. Boxplots showing the shifts in percent spliced in (PSI) values. Exon 9 in Arhgap17 transcripts was significantly more included in the CA1 of Pb exposed, non-enriched animals compared to control, non-enriched animals. (C) Lead exposure resulted in a decrease in inclusion of exon 16 in Dckl1 transcript as compared to non-enriched controls. (D) Exon 25 of Calcium Voltage-Gated Channel Subunit Alpha1E (Cacna1e) was significantly less included among the transcripts in EPN_enriched compared to EPN_non-enriched animals. In comparison to Control_non-enriched females, Exon 6 in Netrin G1 (Ntng1) transcripts were more included in Control_enriched females. (E) Exon 29 in Kinesin Family Member 21A (Kif21a), and exon 17 in Semaphorin 6A (Sema6a) transcripts were significantly less included among the transcripts in the CA1 of EPN_enriched animals vs Control_enriched animals for these two genes involved in brain development (FDR < 0.05 and delta PSI ≥ 0.05).

Similar articles

Cited by

References

    1. Canfield RL, et al. Intellectual impairment in children with blood lead concentrations below 10 microg per deciliter. N. Engl. J. Med. 2003;348:1517–1526. doi: 10.1056/NEJMoa022848. - DOI - PMC - PubMed
    1. Canfield RL, Kreher DA, Cornwell C, Henderson CR., Jr Low-level lead exposure, executive functioning, and learning in early childhood. Child Neuropsychol. 2003;9:35–53. doi: 10.1076/chin.9.1.35.14496. - DOI - PubMed
    1. Lanphear BP, Dietrich K, Auinger P, Cox C. Cognitive deficits associated with blood lead concentrations <10 microg/dL in US children and adolescents. Public Health Rep. 2000;115:521–529. doi: 10.1093/phr/115.6.521. - DOI - PMC - PubMed
    1. Lanphear BP, et al. Low-level environmental lead exposure and children's intellectual function: An international pooled analysis. Environ Health Perspect. 2005;113:894–899. doi: 10.1289/ehp.7688. - DOI - PMC - PubMed
    1. Chiodo LM, et al. Blood lead levels and specific attention effects in young children. Neurotoxicol. Teratol. 2007;29:538–546. doi: 10.1016/j.ntt.2007.04.001. - DOI - PubMed

Publication types