. 2022 Aug;54(8):1078-1089.
doi: 10.1038/s41588-022-01131-x. Epub 2022 Jul 25.

Genome-wide bidirectional CRISPR screens identify mucins as host factors modulating SARS-CoV-2 infection

Affiliations

Genome-wide bidirectional CRISPR screens identify mucins as host factors modulating SARS-CoV-2 infection

Scott B Biering et al. Nat Genet. 2022 Aug.

Abstract

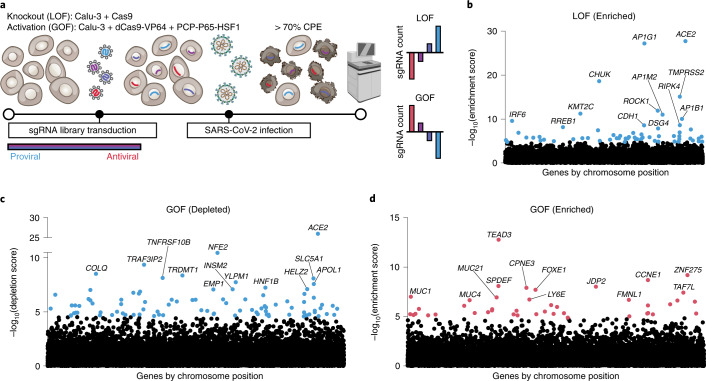
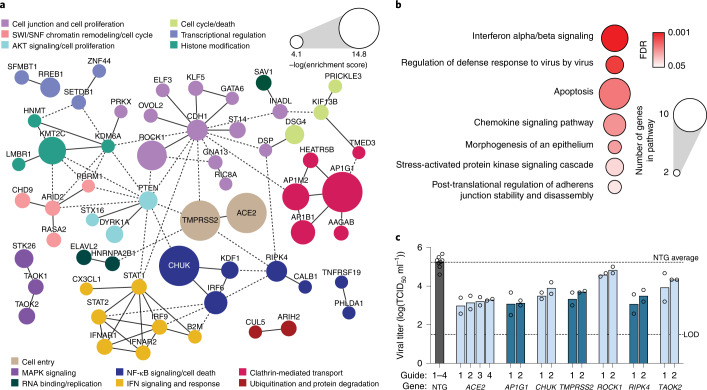
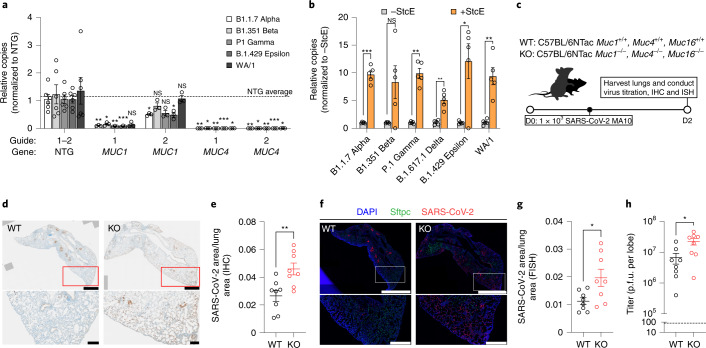
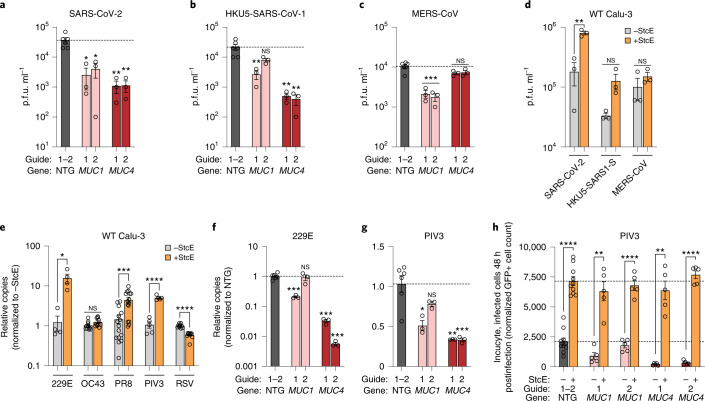
Severe acute respiratory syndrome coronavirus 2 (SARS-CoV-2) causes a range of symptoms in infected individuals, from mild respiratory illness to acute respiratory distress syndrome. A systematic understanding of host factors influencing viral infection is critical to elucidate SARS-CoV-2-host interactions and the progression of Coronavirus disease 2019 (COVID-19). Here, we conducted genome-wide CRISPR knockout and activation screens in human lung epithelial cells with endogenous expression of the SARS-CoV-2 entry factors ACE2 and TMPRSS2. We uncovered proviral and antiviral factors across highly interconnected host pathways, including clathrin transport, inflammatory signaling, cell-cycle regulation, and transcriptional and epigenetic regulation. We further identified mucins, a family of high molecular weight glycoproteins, as a prominent viral restriction network that inhibits SARS-CoV-2 infection in vitro and in murine models. These mucins also inhibit infection of diverse respiratory viruses. This functional landscape of SARS-CoV-2 host factors provides a physiologically relevant starting point for new host-directed therapeutics and highlights airway mucins as a host defense mechanism.


Conflict of interest statement

P.D.H. is a co-founder of Spotlight Therapeutics and Moment Biosciences and serves on the board of directors and scientific advisory boards, and is a scientific advisory board member to Vial Health and Serotiny. P.D.H. and S.K. are inventors on patents relating to CRISPR technologies. C.R.B. is a co-founder and Scientific Advisory Board member of Lycia Therapeutics, Palleon Pharmaceuticals, Enable Bioscience, Redwood Biosciences (a subsidiary of Catalent), OliLux Bio, Grace Science LLC and InterVenn Biosciences. Yale University (C.B.W) has a patent pending related to this work entitled ‘Compounds and Compositions for Treating, Ameliorating, and/or Preventing SARS-CoV-2 Infection and/or Complications Thereof’. The remaining authors declare no competing interests.

Figures

Fig. 1
Fig. 1. Bidirectional CRISPR screens identify host factors critical for SARS-CoV-2-mediated CPE.
a, Schematic of genome-wide CRISPR KO and activation screens for SARS-CoV-2 host factors, conducted in parallel. Calu-3 cells stably expressing Cas9 for the LOF screen or dCas9 and transcriptional activators for the GOF screen were transduced with pooled guide RNA libraries. Following infection with SARS-CoV-2, cells were harvested after at least 70% CPE was evident. Next-generation sequencing was performed to identify host factors and assign proviral and antiviral roles based on guide RNA enrichment or depletion compared with uninfected controls. b, Manhattan plot displaying the top 13 enriched genes identified in the LOF screen. c, Manhattan plot displaying the top 13 depleted genes in the GOF screen. d, Manhattan plot displaying the top 13 enriched genes in the GOF screen. All genes are ranked based on MAGeCK robust rank aggregation (RRA) score. Red dots indicate putative antiviral genes with FDR < 0.05, blue dots indicate putative proviral genes with FDR < 0.05.
Fig. 2
Fig. 2. Host dependency factors and pathways of SARS-CoV-2 in lung cells revealed by genome-wide LOF screening.
a, Protein–protein interaction network for top 100 enriched hits identified in the CRISPR LOF screen based on STRING analysis. Solid lines between genes indicate direct interaction, dashed lines indicate indirect connections. Nodes are color-coded by functional groups and scaled according to screen enrichment RRA score. AKT, AK strain transforming; IFN, interferon; MAPK, mitogen-activated protein kinase; SWI/SNF; SWItch/Sucrose Non-Fermentable. b, Pathway analysis of top 100 enriched hits indicates significantly overrepresented pathways with putative proviral roles. Circle size indicates the number of genes within each pathway, color indicates FDR of pathway enrichment. c, Individual TCID50 validation for KO of the top five enriched hits from our LOF screen plus additional hits of interest. Calu-3 cells were infected with SARS-CoV-2 at an MOI of 0.05 for 48 h, each gene was targeted with at least two separate guides. Dotted lines indicate the limit of detection (LOD) of the assay as well as the NTG average for four separate guides. Significance was not calculated because n = 2 biological replicates.
Fig. 3
Fig. 3. Comparative analysis of LOF screens reveals cell type-specific host factor landscapes of SARS-CoV-2.
a, Correlation plots of top 500 hits ranked by RRA score from this study and previously reported SARS-CoV-2 KO screens performed in different cell lines. Plots are color-coded by cell line. Black: Calu-3 (human epithelial lung adenocarcinoma cell line), blue: Huh7.5 and Huh7.5.1ACE2/TMPRSS2 (human hepatocyte-derived cell lines), red: A549ACE2 (ACE2-overexpressing human lung adenocarcinoma cell line), yellow: Vero E6 (African Green Monkey kidney epithelial cell line). The top three overlapping genes with the lowest sum of rank position are displayed. b, Heat map indicating screen rank of key SARS-CoV-2 entry factors (left) and all other top 500 ranked hits present in at least three screens (right). Matrix (right) denotes cell line properties. c, Top 100 hits across LOF screens ranked by their expression levels in lung epithelial cells from COVID-19 patient BALF scRNA-seq data from Liao et al.. d, Top 100 hits across LOF screens ranked by area under the curve (AUC) value for ACE2+TMPRSS2+ ciliated human lung epithelial cells based on scRNA-seq meta-analysis, data from Muus et al.. e, Top 100 hits across LOF screens ranked based on differential expression in lung epithelial cells from COVID-19 patients compared to healthy individuals, data from Liao et al.. DEG, differentially expressed genes.
Fig. 4
Fig. 4. Host restriction factors and pathways of SARS-CoV-2 in lung cells revealed by GOF screening.
a, Protein–protein interaction network for top 100 enriched hits identified in the CRISPR GOF screen based on STRING analysis. Solid lines between genes indicate direct interaction, dashed lines indicate indirect connections. Nodes are color-coded by functional groups and scaled according to screen enrichment RRA score. GPCR, G-protein-coupled receptor; PRR, pattern recognition receptor. b, Pathway analysis of top 100 enriched hits indicates significantly overrepresented pathways with putative antiviral roles. Circle size indicates the number of genes within each pathway, color indicates FDR of pathway enrichment. c, Individual validation of the effect of transcriptional upregulation of the top five enriched putative antiviral hits from the GOF screen, measuring SARS-CoV-2 viral titer by TCID50. Error bars denote mean ± s.e.m., n = 3 biological replicates. The dotted lines indicate the LOD of the assay as well as the NTG average. Significance was determined with individual two-sided t-tests between each GOF line and NTG. NS, not significant; *P < 0.05, **P < 0.01, ***P < 0.001, ****P < 0.0001.
Fig. 5
Fig. 5. Membrane-tethered mucins are SARS-CoV-2 host restriction factors and upregulated in response to infection.
a, Individual validation of mucin GOF Calu-3 cells infected with SARS-CoV-2 at an MOI of 0.05 for 48 h, measured by TCID50 assay. Two separate sgRNAs were tested per gene. Dotted lines indicate the LOD of the assay (lower) as well as the NTG average (upper). Significance is measured by individual two-sided t-tests between each GOF line and NTG, n = 3 biological replicates. b, Quantification of relative levels of viral N gene copies by RT–qPCR for MUC1 and MUC4 GOF lines. Significance was measured by individual two-sided t-tests between each GOF line and NTG, n = 3 biological replicates. c, Flow cytometry of NTG-transduced Calu-3 cells treated with 5 µg ml−1 mucin-selective protease (StcE); +StcE n = 21,569 cells and −StcE n = 27,310 cells. Total mucin levels were detected with an enzyme-inactive form of StcE conjugated to Alexa Fluor 647. d, Multistep growth curves of StcE-digested and untreated Calu-3 cells infected with SARS-CoV-2, as measured by TCID50 assay. Two-sided t-test performed between +StcE and −StcE at each time point, n = 3 biological replicates. e, RT–qPCR measuring relative levels of viral N gene copies, 24 h postinfection in primary NHBE with and without pretreatment with StcE. Two-sided t-test performed between cells ± pretreatment with StcE, n = 10 biological replicates. f, Heat map representing differential mucin expression levels in cell models, animal models and human lung tissue following infection with SARS-CoV-2. Boxes indicate significant differential expression at FDR < 0.05. Color scale indicates log2(fold change) of transcript expression levels after SARS-CoV-2 infection compared with uninfected controls. g, UMAP plots of scRNA-seq data for antiviral host factor expression in lung epithelial cells isolated from BALF of COVID-19 patients and healthy individuals from Liao et al.. Cells are colored based on relative expression levels for each gene. All genes shown exhibit differential expression with FDR < 0.001. h, Expression of MUC1 and MUC4 in human epithelial progenitor cells from BALF of severe COVID-19 patients, comparing gene expression in cells with detected viral RNA (vRNA+, n = 282) versus cells without detected viral RNA (vRNA−, n = 9,063) in the sample. Cells infected by SARS-CoV-2 were identified using Viral-Track (https://github.com/PierreBSC/Viral-Track) and analyzed by Mann–Whitney U test across all panels. Upper and lower hinges correspond to the 75th and 25th percentiles, the center line corresponds to the median and whiskers extend to the most extreme point no further from the closest hinge than 1.5× the interquartile range. Error bars denote mean ± s.e.m. NS, not significant; *P < 0.05, **P < 0.01, ***P < 0.001, ****P < 0.0001.
Fig. 6
Fig. 6. Membrane-tethered mucins restrict infection of SARS-CoV-2 variants in vitro and mouse-adapted SARS-CoV-2 in vivo.
a, RT–qPCR measuring relative levels of viral N gene copies in mucin-overexpressing Calu-3 cells infected with the indicated SARS-CoV-2 variants at an MOI of 0.05 for 24 h. The dotted line indicates the NTG average for two separate guides each with n = 3 biological replicates. A two-tailed t-test was performed for each viral variant relative to its own NTG control. b, SARS-CoV-2 infection of WT Calu-3 cells with or without pretreatment with StcE across variants. Two-sided t-test performed for +StcE versus −StcE for each viral variant, n = 5 biological replicates. ch, Muc1//Muc4//Muc16/ triple KO and control mice were infected with 103 p.f.u. of mouse-adapted SARS-CoV-2 intranasally and viral loads were analyzed in the lungs 2 d postinfection. c, Schematic depicting experimental conditions for in vivo infection, and subsequent analysis of SARS-CoV-2 infection in either WT or mucin KO mice. d, IHC staining for SARS-CoV-2 nucleocapsid followed by DAB development and hematoxylin II staining on paraffin-embedded lung sections. Shown are representative lungs from n = 8 mice. Scale bars, 1 mm (upper) and 100 µm (lower). e, Quantification of d. A two-tailed t-test was performed between mucin WT and KO groups, n = 8 mice. f. RNA-ISH probing for SARS-CoV-2 RNA on paraffin-embedded lung sections. Shown are representative lungs from n = 8 mice. Scale bars, 2 mm (upper) and 500 µm (lower). DAPI, 4,6-diamidino-2-phenylindole. g, Quantitation of f. A two-tailed t-test was performed between mucin WT and KO groups, n = 8 mice. h, Quantitation of infectious viral particles per lung lobe by plaque assay from n = 8 mice. A two-tailed t-test was performed between mucin WT and KO groups. Error bars denote mean ± s.e.m. NS, not significant; *P < 0.05, **P < 0.01, ***P < 0.001, ****P < 0.0001.
Fig. 7
Fig. 7. Membrane-tethered mucins restrict SARS-CoV-2 Spike-mediated entry.
a, Schematic of the pseudotype entry assay using a VSV-CoV-2-S encoding GFP. Following infection, cells are imaged regularly over 24 h to track viral infection by quantifying GFP+ cell counts. hpi, hours postinfection. b, Time course of VSV-CoV-2-S infection of NTG, MUC1, MUC4, MUC21 and CD44-overexpressing GOF cell lines. The significance of the difference relative to NTG at 24 h postinfection was determined by two-sided t-test, n = 3 biological replicates. c., Time course of VSV-CoV-2-S infection of NTG and MUC4 GOF cells pretreated with StcE mucinase before VSV-CoV-2-S infection. Significance of the difference between StcE-treated cells versus untreated cells for each cell line at the point of saturation at 8 h postinfection was determined by two-sided t-test, n = 3 biological replicates. d, Time course of VSV-RABV-G infection in NTG and MUC4 GOF cells pretreated with StcE before pseudotype virus infection. VSV-RABV-G, VSV particles pseudotyped with rabies virus glycoprotein. Significance comparing StcE-treated versus untreated cells at 5 h postinfection was determined by two-sided t-test, n = 3 biological replicates. e, Pseudotype entry assay measuring GFP+ cells at 8 h postinfection comparing infection rates between NTG or mucin-overexpressing cells with and without StcE pretreatment. The full dataset is displayed in Extended Data Fig. 9. n = 5 biological replicates; two-tailed t-tests were performed comparing indicated pairs. The dotted line indicates the NTG average for two separate guides, with and without StcE treatment. f, Schematic depicting a SARS-CoV-2 binding assay. g, RT–qPCR of relative levels of viral N gene copies following a virus binding assay conducted on Calu-3 cells at an MOI of 2.5 with or without StcE treatment. Significance comparing StcE-treated cells versus untreated cells was determined by two-sided t-test, n = 6 biological replicates. Error bars denote mean ± s.e.m. NS, not significant; *P < 0.05, **P < 0.01, ***P < 0.001, ****P < 0.0001.
Fig. 8
Fig. 8. Membrane-tethered mucins restrict infection of multiple respiratory viruses.
ac, Calu-3 mucin GOF cells were infected with (a) SARS-CoV-2, (b) HKU5-SARS-CoV-S or (c) MERS-CoV at an MOI of 0.1. At 24 h postinfection, viral titers were quantified by plaque assay. The dotted line is the NTG average, n = 3 biological replicates. Significance was calculated by a two-sided t-test between each GOF cell line versus NTG. d, As ac, except on WT Calu-3 cells pretreated with StcE. n = 3 biological replicates, two-sided t-tests were performed for the indicated pairs. e, Calu-3 cells were treated with StcE or left untreated and then infected with the indicated virus for 24 h. Relative levels of viral gene copies were quantified by RT–qPCR. Displayed are n = 4 (HCoV-229E), n = 10 (HCoV-OC43), n = 15 (Influenza A virus, PR8), n = 5 (PIV3) and n = 10 (RSV) biological replicates. Two-sided t-tests were performed for the indicated pairs. f,g. Mucin-overexpressing Calu-3 cells were infected with HCoV-229E or PIV3, and relative levels of viral gene copies were quantified 24 h postinfection by RT–qPCR. n = 3 biological replicates, the dotted line is the NTG average. Significance was calculated by a two-sided t-test between each GOF cell line versus NTG. h, PIV3 infection of the indicated GOF Calu-3 cells, with and without StcE treatment, at 48 h postinfection quantifying GFP+ cells. Displayed is a single time point from the experiment shown in Extended Data Fig. 10a. Displayed are n = 5 biological replicates, two-sided t-tests were performed for the indicated pairs. Dotted lines indicate the NTG average for two separate guides, with (upper) and without (lower) StcE treatment. Error bars denote mean ± s.e.m. NS, not significant; *P < 0.05, **P < 0.01, ***P < 0.001, ****P < 0.0001.
Extended Data Fig. 1
Extended Data Fig. 1. Characterization of SARS-CoV-2 virus stocks.
a. Cytopathic effect inhibition assay measuring the capacity of 40 µM of the indicated compound to inhibit SARS-CoV-2-mediated cell death. Calu-3 cells were infected with SARS-CoV-2 at an MOI of 0.05, and cell death was measured 96 hours post-infection. Significance was not calculated, as n = 2 biological replicates. b. Levels of compound-induced cytotoxicity in the absence of SARS-CoV-2. c. Viral infection of parental Vero-E6 cells or Vero-E6 cells overexpressing furin. Cells were infected with SARS-CoV-2 at an MOI of 0.05, and infectious viral particles were quantified by TCID50 24 hours post infection (hpi). Significance was determined by two-sided t-test, n = 3 biological replicates. d. Human pulmonary microvascular endothelial cells (HPMEC) overexpressing human ACE2 (HPMEC/ACE2) were infected with SARS-CoV-2 at an MOI of 0.05, and bright field microscopy images were captured at 10X magnification. Scale bar indicates 500 micrometers. Arrows indicate multinucleated syncytia. These images are representative of n = 3 biological replicates. For all panels: error bars denote mean ± s.e.m., significance is indicated as: n.s.=not significant, *= P < 0.05, **= P < 0.01, ***=P < 0.001, ****= P < 0.0001.
Extended Data Fig. 2
Extended Data Fig. 2. Quality control metrics for bidirectional SARS-CoV-2 host factor screens.
a. Log fold-change (LFC) of top screen hits enriched in the LOF screen. Guides are shown separately, with screen replicates indicated by individual data points (log fold-change is calculated relative to day 0 pre-infection of the same cell population). n = 3 biological screen replicates. b. Log fold-change of top screen hits depleted in the gain-of-function screen. n = 4 biological screen replicates. c. Log fold-change of top screen hits enriched in the GOF screen. n = 4 biological screen replicates.
Extended Data Fig. 3
Extended Data Fig. 3. SARS-CoV-2 proviral signatures revealed by depleted genes in the GOF screen.
a. Protein-protein interaction network for top 100 depleted hits from the CRISPR GOF screen based on STRING analysis. Solid lines between genes indicate direct interaction, dashed lines indicate indirect connections. Nodes are color-coded by functional groups and scaled according to screen enrichment RRA score. b. Pathway analysis of top 100 depleted hits in the GOF screen indicates enriched pathways with putative antiviral roles. Circle size indicates the number of genes within each pathway, color indicates FDR of pathway enrichment. c-d. Individual guide TCID50 validation of the effect of transcriptional upregulation of the top five putative proviral hits on SARS-CoV-2 viral titer in Calu-3 cells infected at an MOI of 0.05 for 48 hours. Each gene was targeted with two sgRNAs. Dotted line indicates the limit of detection (LOD) of the assay and average titer of NTG lines tested. Significance was determined by a two-sided t-test comparing each GOF cell line to the NTG control cells, n = 3 biological replicates. e-f. Same as (c-d) but with additional proviral hits of interest. Significance was determined by a two-sided t-test comparing each GOF cell line to the NTG control cells, n = 3. Dotted line indicates the LOD of the assay and average titer of NTG lines. g. Western blot analysis of Calu-3 ACE2 GOF cells. One western blot was conducted in this experiment, then re-probed for β-actin as a loading control. For all panels: error bars denote mean ± s.e.m., significance is indicated as: n.s.=not significant, *= P < 0.05, **= P < 0.01, ***=P < 0.001, ****= P < 0.0001. Source data
Extended Data Fig. 4
Extended Data Fig. 4. Confirmation of gene editing efficiency for LOF cells and loss of AP1 adaptor complex components decreases Spike glycoprotein-pseudotyped viral entry.
a. Next generation sequencing was performed to analyze indel percentage in the indicated LOF cell Calu-3 lines. Graph depicts the indel percentage for each guide compared to NTG editing efficiency at the same locus. b. Western blot analysis for a representative KO target ROCK1 indicates successful depletion of the target gene for two guides. One western blot was conducted in this experiment, then re-probed for β-actin as a loading control c. Time-course of VSV-CoV-2-S infection of NTG, AP1G1, AP1B1 and AP1M2 KO cell lines. NTG, non-targeting guide. VSV-CoV-2-S, SARS-CoV-2 Spike-pseudotyped vesicular stomatitis virus encoding GFP. n = 3 biological replicates. d. Number of GFP + cells at 6 hpi, from the time-course shown in (c). Statistical significance was measured by individual two-sided t-tests comparing GOF lines to NTG lines, n = 3 biological replicates. e. Time-course of VSV-RABV-G entry in NTG, AP1G1, AP1B1 and AP1M2 KO cell lines. VSV-RABV-G, VSV particles pseudotyped with rabies virus glycoprotein. n = 3 biological replicates. f. Number of GFP + cells at 6 hpi, from the time-course shown in e. Statistical significance is measured by individual two-sided t-tests comparing GOF lines to NTG, n = 3 biological replicates. For all panels: error bars denote mean ± s.e.m., significance is indicated as: n.s.=not significant, *= P < 0.05, **= P < 0.01, ***=P < 0.001, ****= P < 0.0001. Source data
Extended Data Fig. 5
Extended Data Fig. 5. Validation of additional SARS-CoV-2 restriction factors enriched in the GOF screen.
a. RT-qPCR analysis of target-gene expression for indicated GOF cell lines graphed as expression fold change over NTG for each gene. Statistical significance is measured by individual two-sided t-tests comparing GOF lines to NTG, n = 3 biological replicates. Dotted line indicates NTG expression level (normalized to 1). b-d. Viral titer in GOF cell lines infected with SARS-CoV-2 at an MOI of 0.05 for 48 hours and measured by TCID50 assay. Dotted line indicates the limit of detection (LOD) of the assay, as well as the NTG average. Statistical significance is measured by individual two-sided t-tests comparing GOF lines to NTG, n = 3 biological replicates. For all panels: error bars denote mean ± s.e.m., significance is indicated as: n.s.=not significant, *= P < 0.05, **= P < 0.01, ***=P < 0.001, ****= P < 0.0001.
Extended Data Fig. 6
Extended Data Fig. 6. Calu-3 GOF cells express mucins that are sensitive to StcE digestion.
a. RT-qPCR analysis of target-gene expression for indicated GOF cell lines graphed as expression fold change over NTG for each gene. Statistical significance is measured by individual two-sided t-tests comparing GOF lines to NTG, n = 4 biological replicates. Dotted line indicates NTG expression level (normalized to 1). b. Western blot analysis of MUC1-, and MUC4-overexpressing Calu-3 cells. Bottom panels were imaged in a different channel for β-actin content as a loading control. One western blot was conducted in this experiment. c. Western blot analysis of CD44-overexpressing Calu-3 cells confirms protein upregulation. Treatment with StcE protease eliminates larger CD44 isoforms; two western blots were conducted with similar results. Bottom panels were imaged in a different channel for β-actin content as a loading control. One western blot was conducted in this experiment. d. Gating strategy for flow cytometry analysis, showing NTG Calu-3 cells treated with StcE protease. e. Flow cytometry histogram of CD44-GOF Calu-3 cells treated with StcE protease, stained with anti-CD44 antibody conjugated to PE. One experiment was conducted, CD44 guide 1 +StcE n = 12548, -StcE n = 21310, CD44 guide 2 +StcE n = 11296, -StcE n = 14280. f. Flow cytometry histogram of MUC1 GOF cells treated with StcE protease and stained with anti-MUC1 antibody demonstrates removal of MUC1 on the cell surface by StcE treatment. One experiment was conducted, MUC1 guide 2 isotype control n = 62687, and MUC1 guide 2 +StcE n = 33825, and -StcE n = 35500. For all panels: error bars denote mean ± s.e.m., significance is indicated as: n.s.=not significant, *= P < 0.05, **= P < 0.01, ***=P < 0.001, ****= P < 0.0001. Source data
Extended Data Fig. 7
Extended Data Fig. 7. Gene expression analysis of infected versus bystander single cells.
a. scRNA-seq profiles of epithelial cells from Liao et al.. Cells are colored by assigned epithelial cell type. b. Expression of selected marker genes for each cell type. c. Identification of infected cells using Viral-Track. Any cell with at least one detected high-confidence viral transcript is classified as positive. d. Number of viral RNA positive cells (vRNA+) by cell type. e. As a positive control for our methodology, expression of LY6E, a previously identified antiviral factor and GOF-enriched hit in our screen, is shown in epithelial progenitor cells comparing levels in vRNA+ cells (n = 282) and vRNA- cells (n = 9063). Indicated comparison was made by Mann-Whitney U test. f-g. Comparison of gene expression in viral RNA positive (vRNA+) and viral RNA negative (vRNA-) cells. (f) Viral UMI cutoffs of >65% of all cells were used to identify vRNA+ cells (vRNA + , n = 94 cells and vRNA-, n = 9251 cells). (g) Same as (f) except a viral UMI cutoff of >80% was used. (vRNA + , n = 48 cells, and vRNA- n = 9297 cells). Indicated comparisons were made by Mann-Whitney U test. For all panels: *= p < 0.05, **= p < 0.01, ***= p < 0.001, ****= p < 0.0001. Box plots: Upper and lower hinges correspond to the 75th and 25th percentiles, center line corresponds to the median, and whiskers extend to the most extreme point no further from the closest hinge than 1.5 * the interquartile range.
Extended Data Fig. 8
Extended Data Fig. 8. Membrane-tethered mucins restrict SARS-CoV-2 entry and MUC4 GOF Calu-3 cells possess a denser glycocalyx.
a. Time course tracking infection levels of VSV-CoV-2-S encoding GFP. Infection of NTG, and MUC1 or MUC4 overexpression cell lines with and without StcE treatment, n = 5 biological replicates. The above Incucyte trace is the full dataset for the summary displayed in Fig. 7E. b-c. A glycocalyx density assay measuring the mesh size of the Calu-3 glycocalyx on (b) NTG or (c) MUC4 GOF lines. The assay uses a live-cell two-color fluorescent imaging approach using two types of probes of known sizes: green fluorescent test probes of various sizes as well as Texas-Red dextran with a known size of 2 nm. Scale bars indicate 5 µm. d. Quantification of probe exclusion by the Calu-3 glycocalyx. For each sized probe n = 5 biological replicates (with the exception of the NTG 500 nm probe, with n = 3). For all panels: error bars denote mean ± s.e.m., significance is indicated as: n.s.=not significant, *= P < 0.05, **= P < 0.01, ***=P < 0.001, ****= P < 0.0001.
Extended Data Fig. 9
Extended Data Fig. 9. Gel-forming mucins promote SARS-CoV-2 entry.
a. RT-qPCR analysis of target-gene expression for indicated GOF cell lines graphed as expression fold change over NTG for each gene. Statistical significance is measured by individual two-sided t-tests comparing GOF lines to NTG, n = 4 biological replicates. Dotted line indicates NTG expression level (normalized to 1). b. Western blot analysis of MUC5AC GOF Calu-3 cells. Bottom panel was imaged in a different channel or lanes were cropped out between the ladder and target lanes (upper left). One western blot was conducted in this experiment. c. Plaque assay on the indicated Calu-3 GOF cells infected with SARS-CoV-2 for 24 hours at an MOI of 0.1. Significance was determined by two-sided t-tests comparing individual GOF cell lines to NTG, n = 3 biological replicates. d. Pseudotype-entry assay measuring GFP + cells at 12 hpi with VSV-CoV-2-S (SARS-CoV-2 Spike-pseudotyped Vesicular stomatitis virus encoding GFP). Significance was determined by two-sided t-tests comparing individual GOF cell lines to NTG, n = 3 biological replicates. Dotted line indicates the NTG average. e. Incucyte trace tracking GFP+ (VSV-CoV-2-S infected) cells from the same experiment shown in (d). f. RT-qPCR analysis of SARS-CoV-2 N gene copies 24 hpi of four different SARS-CoV-2 variants in the indicated mucin GOF Calu-3 cells, graphed as normalized to NTG average (indicated by a dotted line). Significance was determined by individual two-sided t-tests comparing the GOF mucin line to NTG, n = 3 biological replicates. For all panels: error bars denote mean ± s.e.m., significance is indicated as: n.s.=not significant, *= P < 0.05, **= P < 0.01, ***=P < 0.001, ****= P < 0.0001. Source data
Extended Data Fig. 10
Extended Data Fig. 10. Membrane-tethered and gel-forming mucins modulate infection of multiple respiratory viruses.
a. Incucyte trace tracking GFP+ (PIV3 infected) cells over 72 hours in Calu-3 mucin GOF cell lines, either pretreated with StcE or not, n = 5 biological replicates. Full dataset for the 48-hour time point from Fig. 8h. b-c. Plaque assay measuring viral loads of the indicated Calu-3 GOF cells infected with HKU5-SARS-Cov-1, or MERS-CoV, respectively, at 24 hpi at an MOI of 0.1. Dotted line indicates the NTG average for guides tested. Significance was calculated by individual two-sided t-tests comparing each cell line to NTG, n = 3 biological replicates. d-e. qRT-PCR measuring viral gene copies 24 hpi in mucin-overexpressing cell lines for 229E (MOI 0.05), or PIV3 (MOI 0.0002), respectively. Dotted line indicates the NTG average. Significance was calculated by individual two-sided t-tests comparing each cell line to NTG, n = 3 biological replicates. f. GFP+ (infected) cells from indicated GOF Calu-3 cell lines infected with PIV3 at MOI 0.0002 at 40 hpi. Significance was calculated by individual two-sided t-tests comparing each cell line to NTG, n = 3 biological replicates. Dotted line indicates the NTG average.g. Incucyte trace tracking GFP + infected cells from (f). For all panels: error bars denote mean ± s.e.m., significance is indicated as: n.s.=not significant, *= P < 0.05, **= P < 0.01, ***=P < 0.001, ****= P < 0.0001.

References

    1. da Costa, V. G., Moreli, M. L. & Saivish, M. V. The emergence of SARS, MERS and novel SARS-2 coronaviruses in the 21st century. Arch. Virol.165, 1517–1526 (2020). - PMC - PubMed
    1. Cui, J., Li, F. & Shi, Z.-L. Origin and evolution of pathogenic coronaviruses. Nat. Rev. Microbiol.17, 181–192 (2018). - PMC - PubMed
    1. Hartenian, E. et al. The molecular virology of coronaviruses. J. Biol. Chem.295, 12910–12934 (2020). - PMC - PubMed
    1. Blanco-Melo, D. et al. Imbalanced host response to SARS-CoV-2 drives development of COVID-19. Cell181, 1036–1045.e9 (2020). - PMC - PubMed
    1. Yang, X. et al. Clinical course and outcomes of critically ill patients with SARS-CoV-2 pneumonia in Wuhan, China: a single-centered, retrospective, observational study. Lancet Respir. Med.8, 475–481 (2020). - PMC - PubMed

Publication types