Meta-Analysis
. 2022 Aug;54(8):1090-1102.
doi: 10.1038/s41588-022-01110-2. Epub 2022 Jul 25.

Bidirectional genome-wide CRISPR screens reveal host factors regulating SARS-CoV-2, MERS-CoV and seasonal HCoVs

Affiliations
Meta-Analysis

Bidirectional genome-wide CRISPR screens reveal host factors regulating SARS-CoV-2, MERS-CoV and seasonal HCoVs

Antoine Rebendenne et al. Nat Genet. 2022 Aug.

Abstract

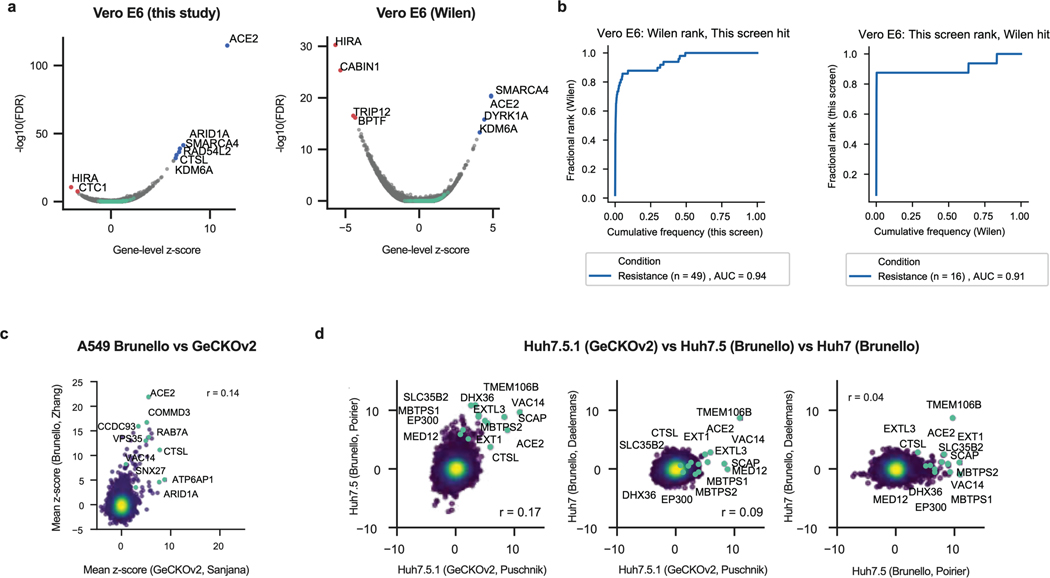
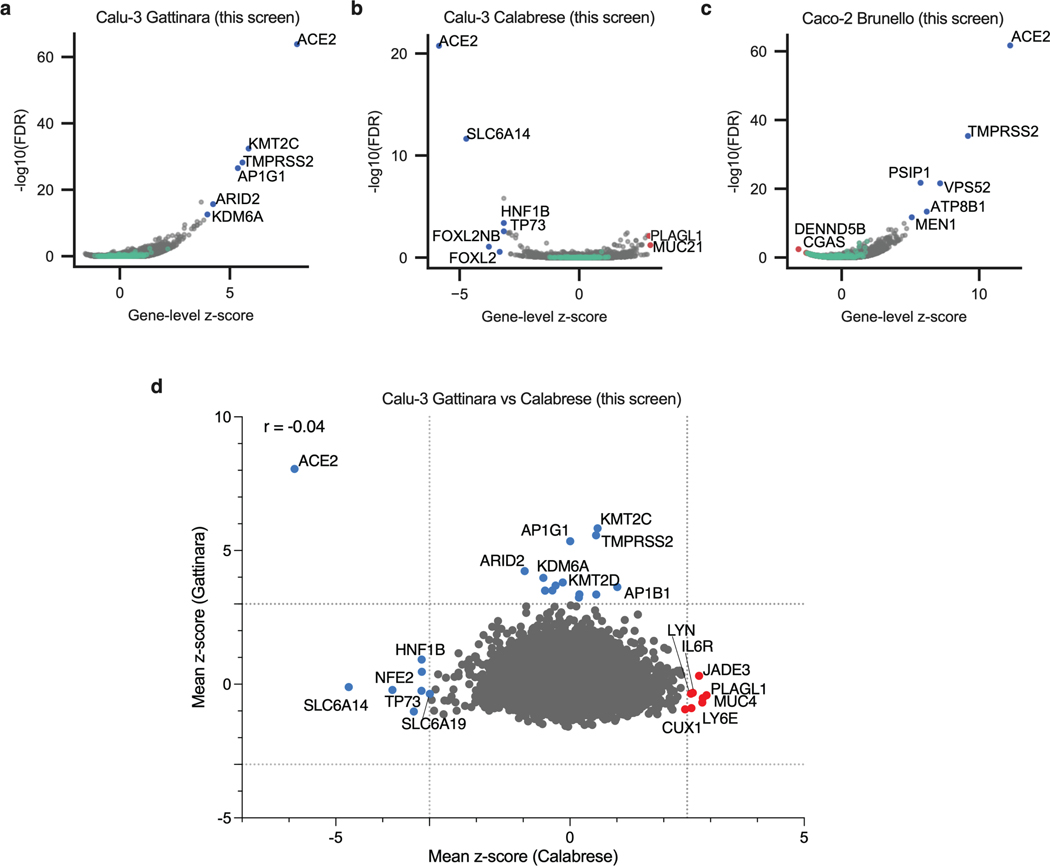
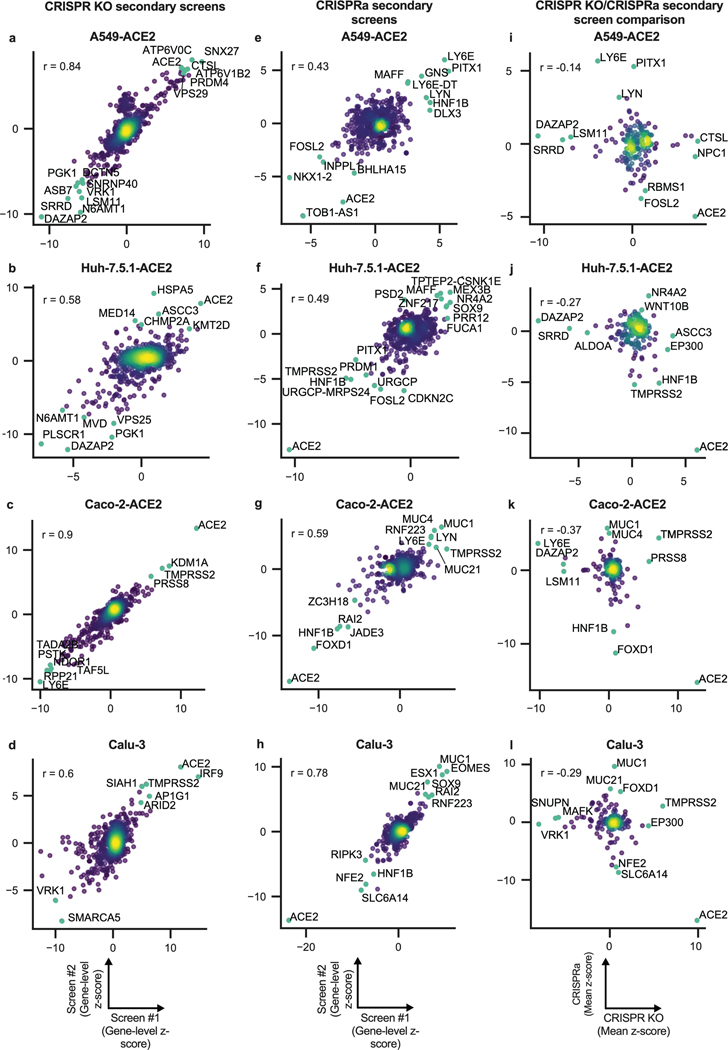
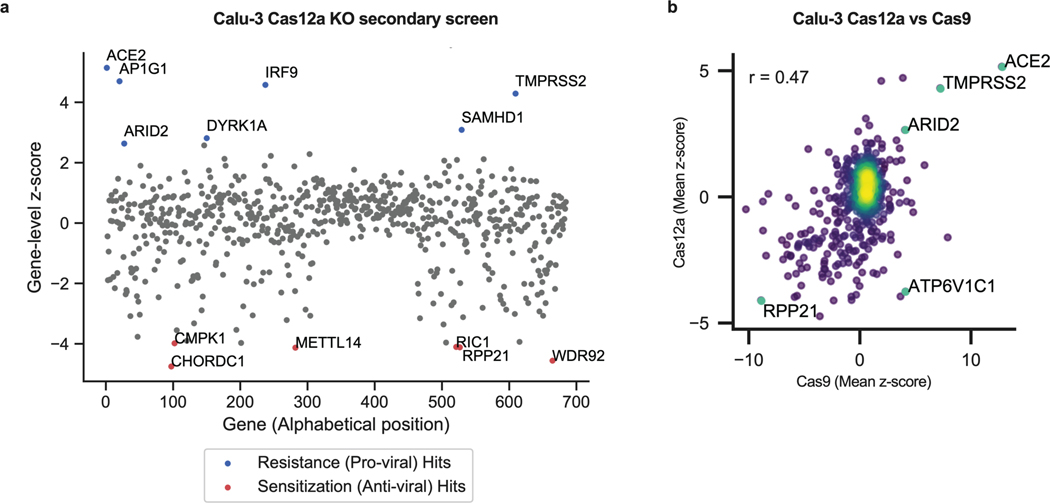
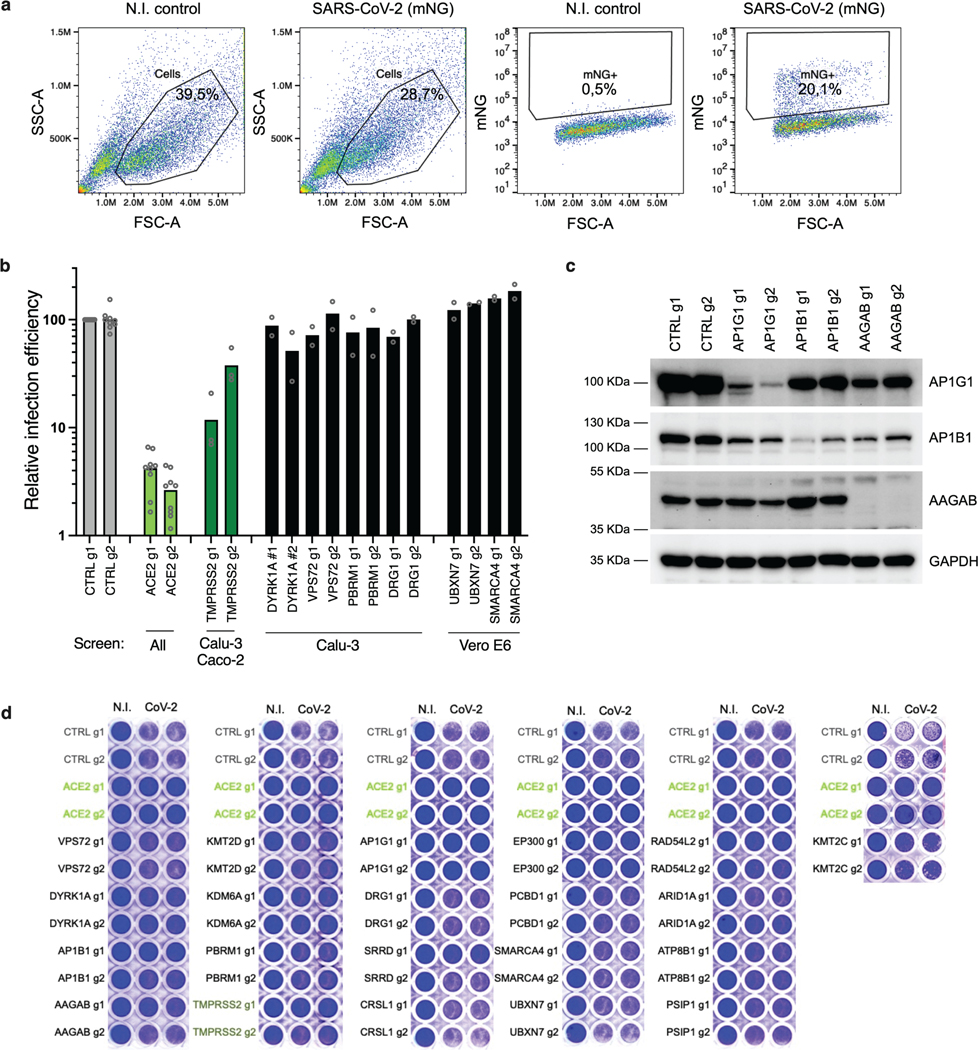
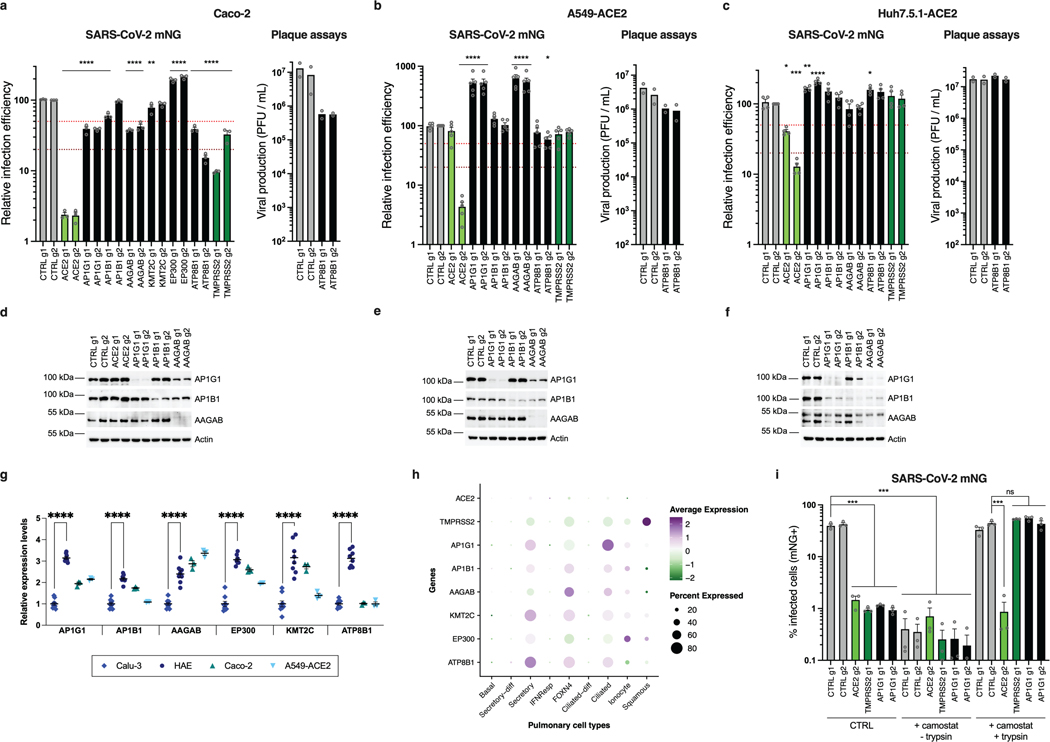
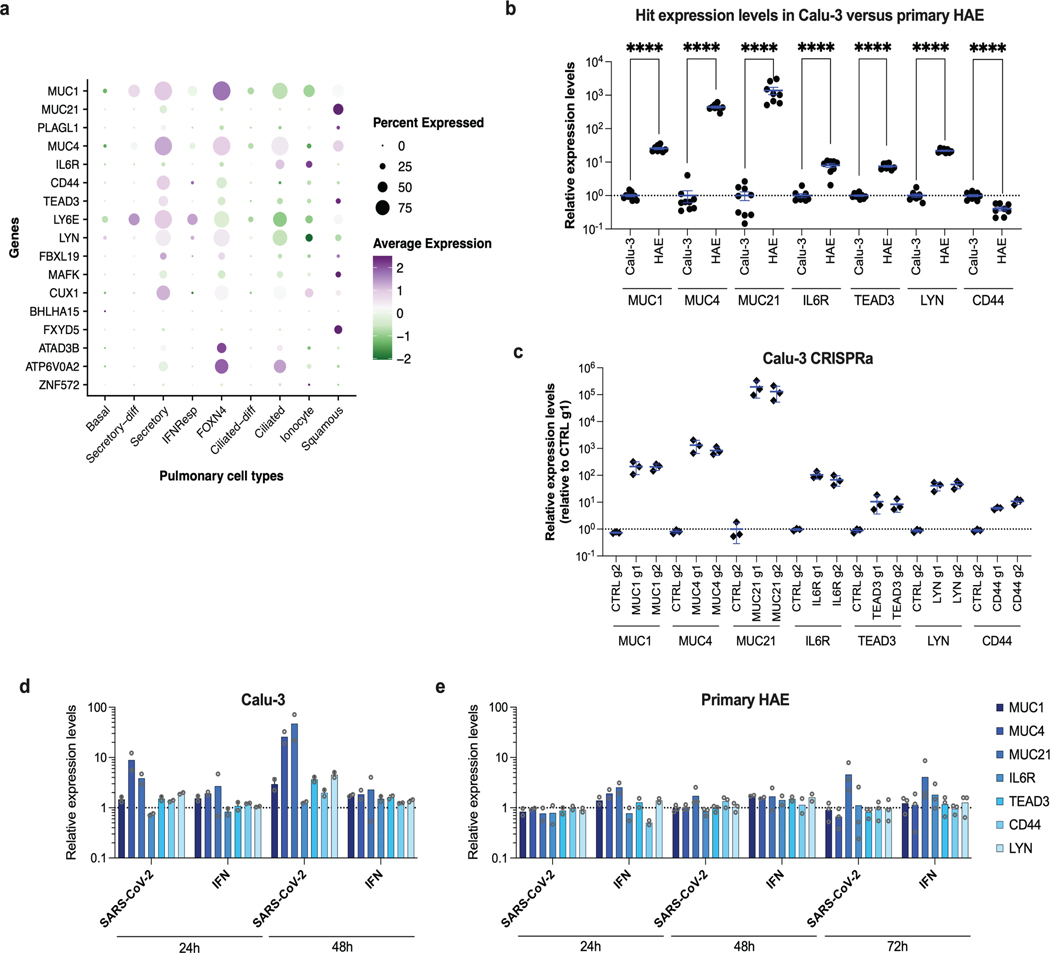
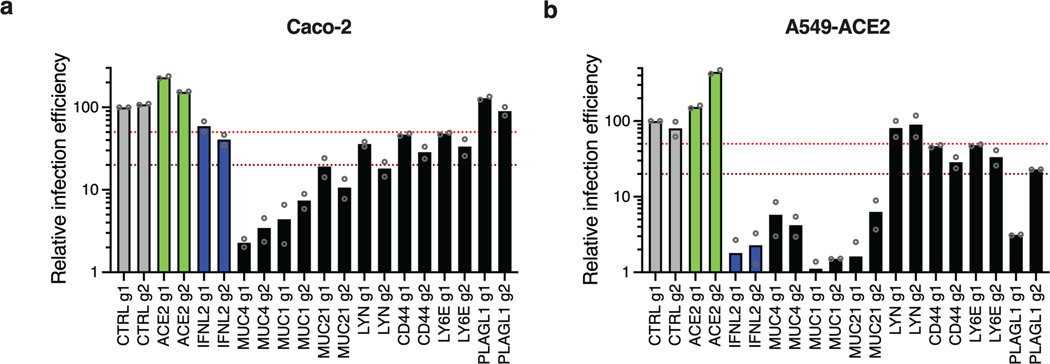
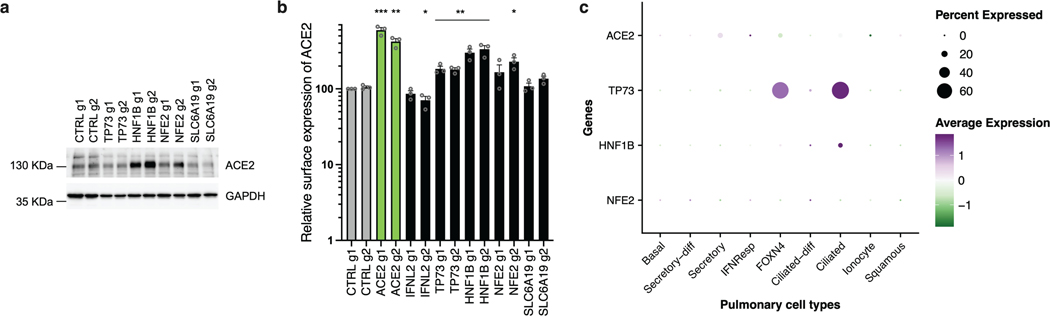
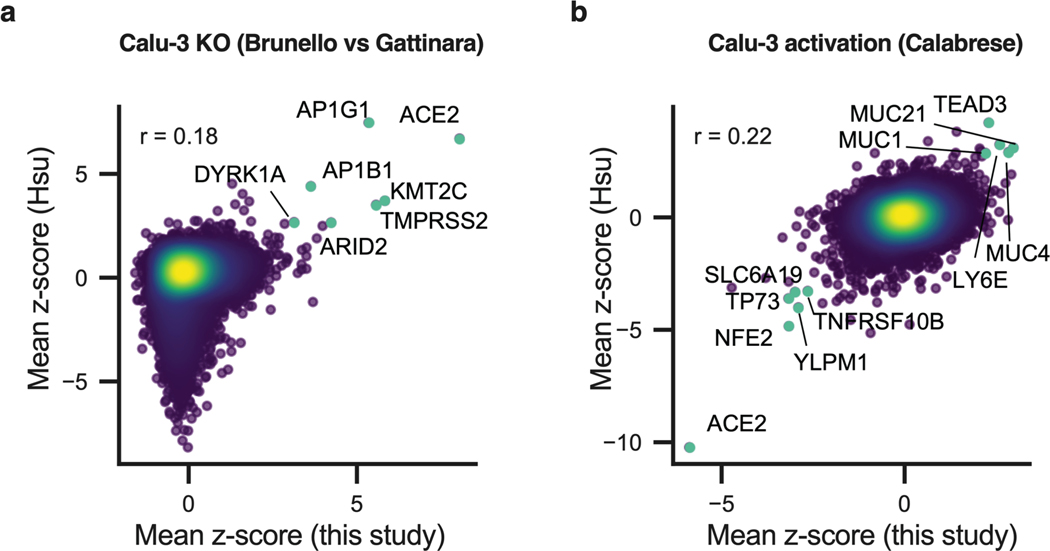
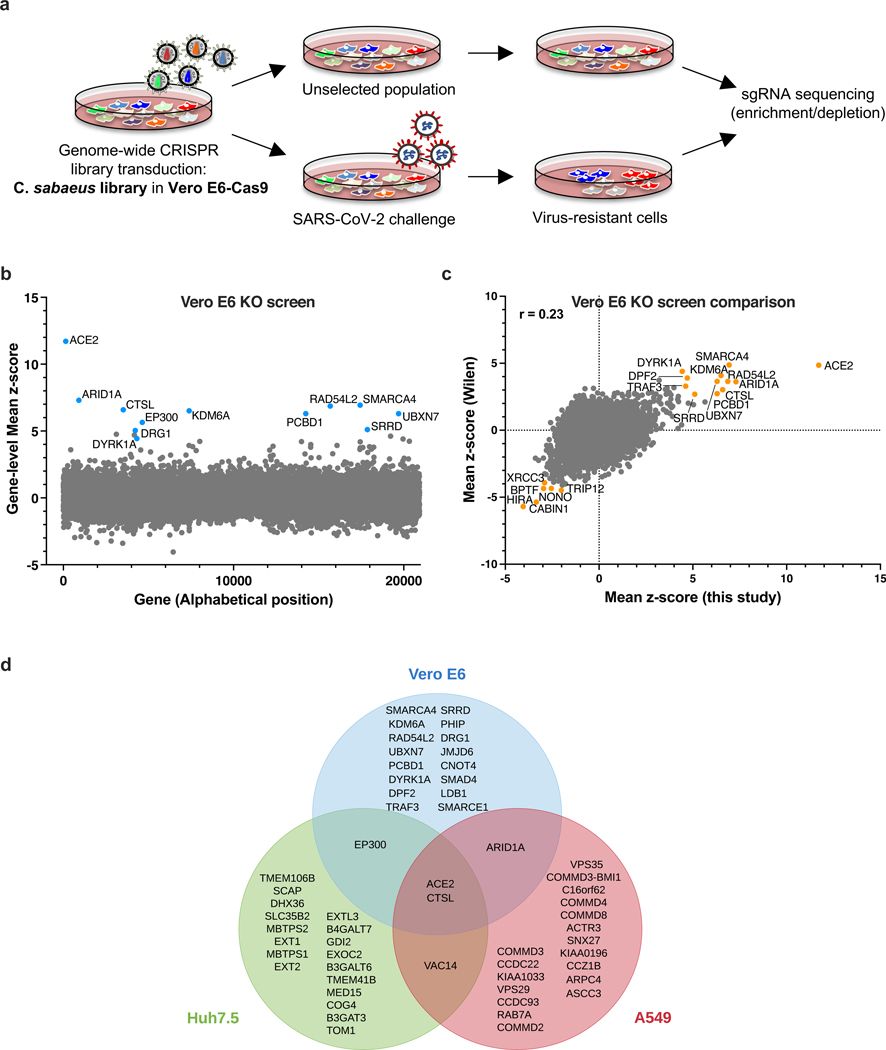
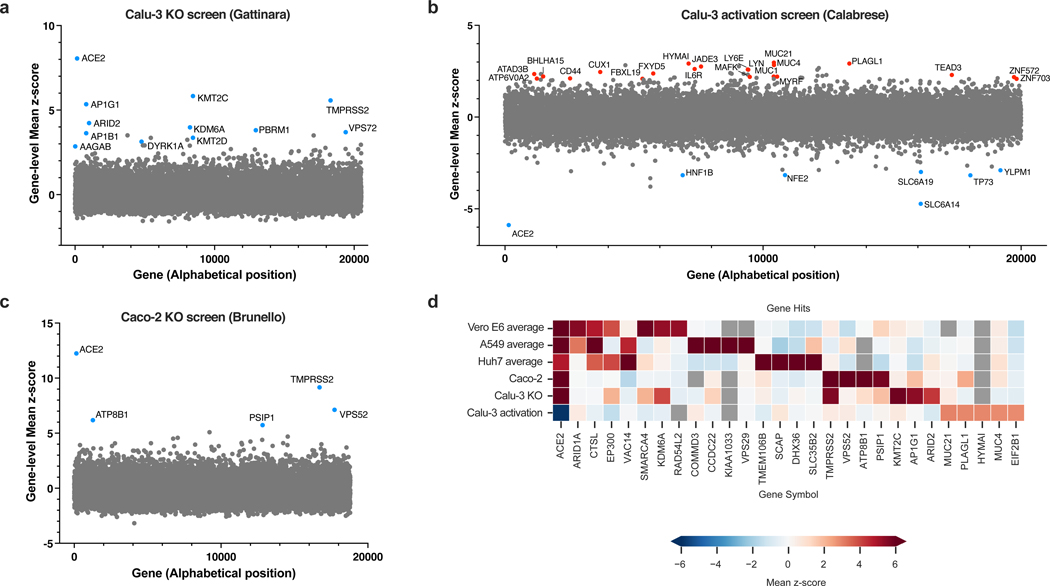
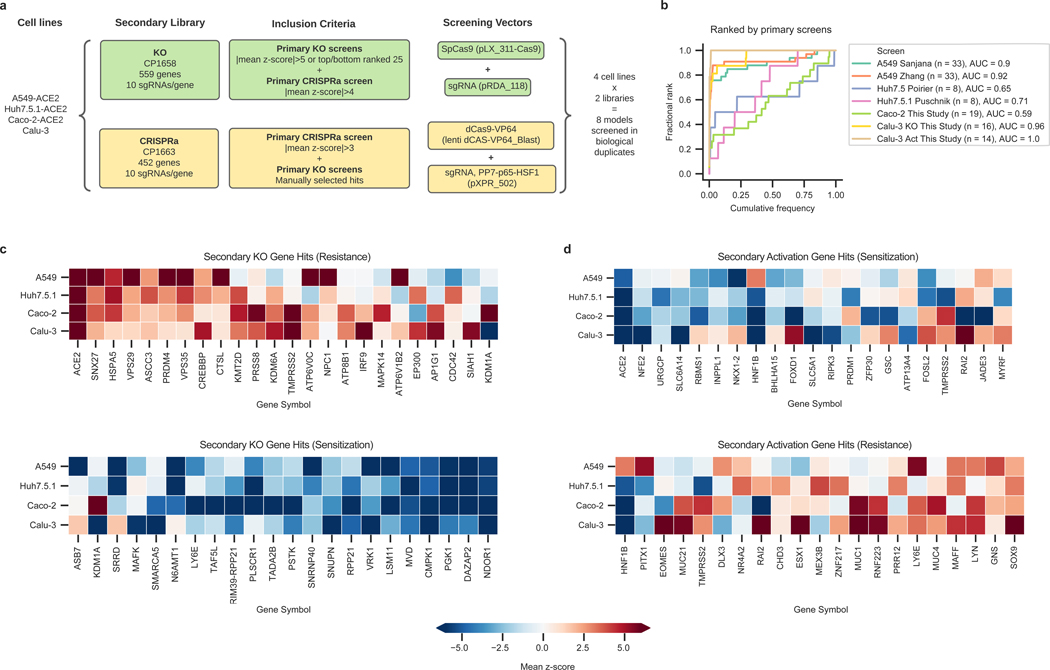
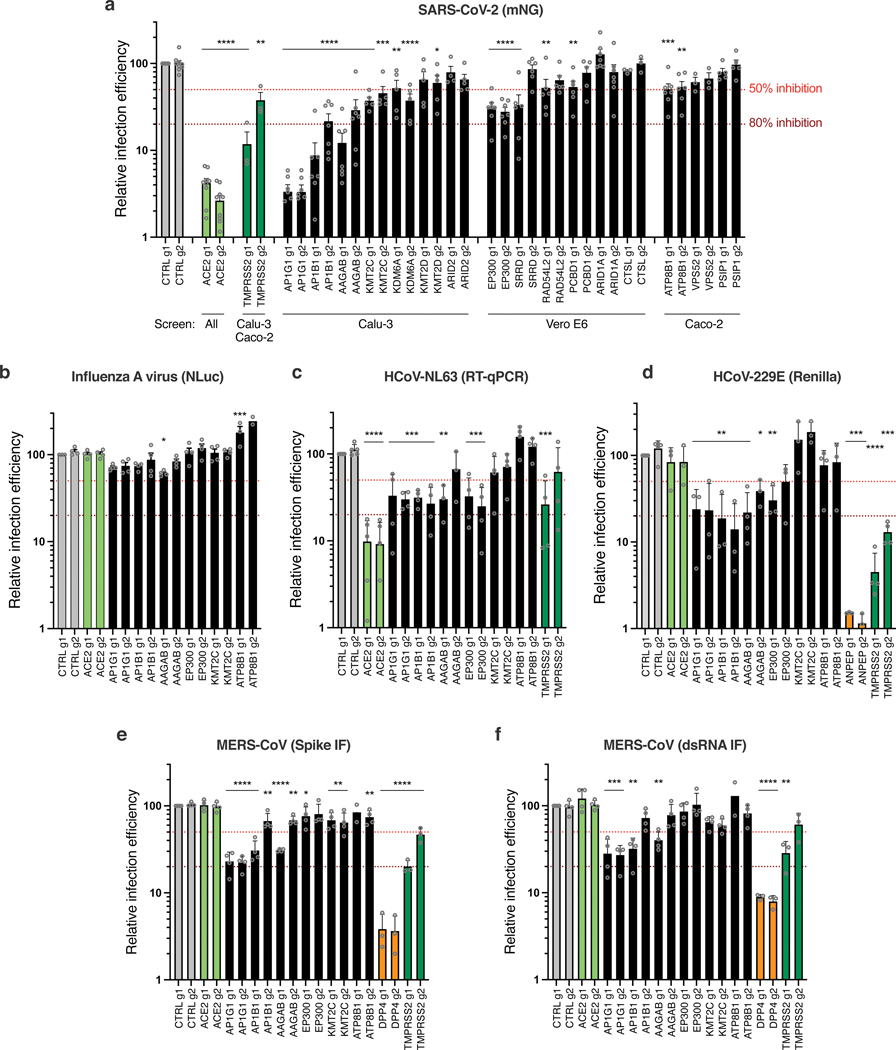
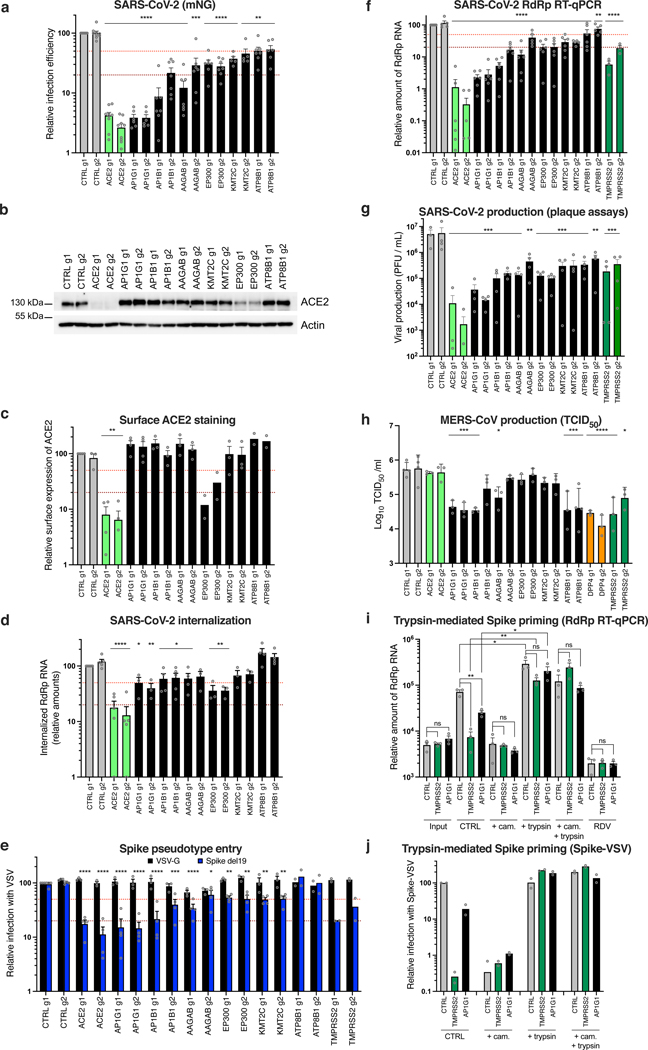
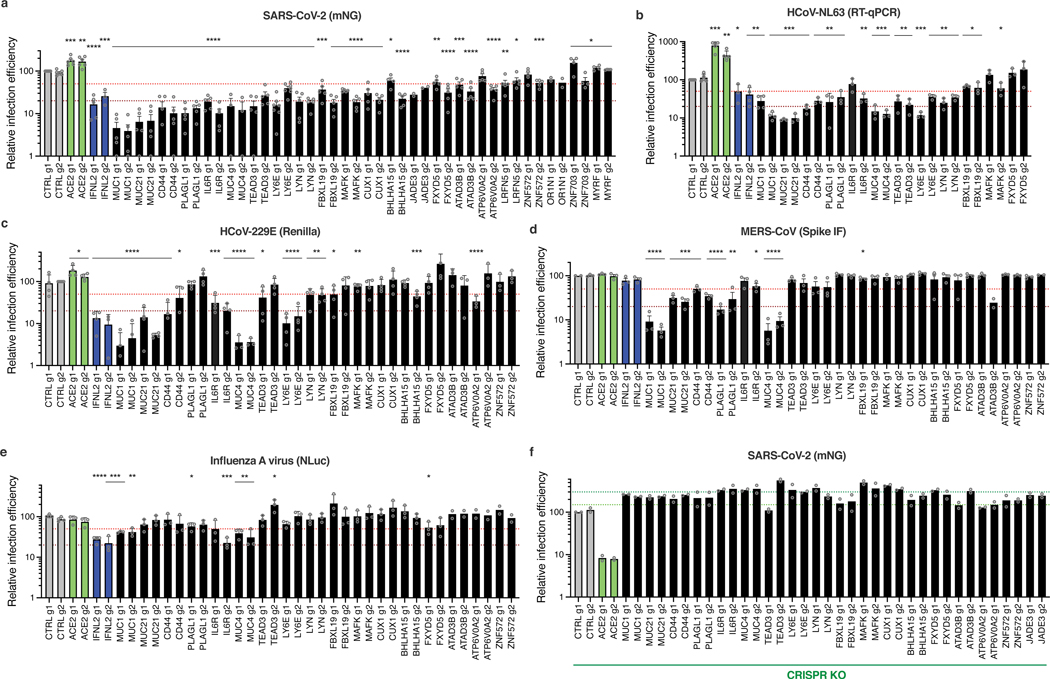
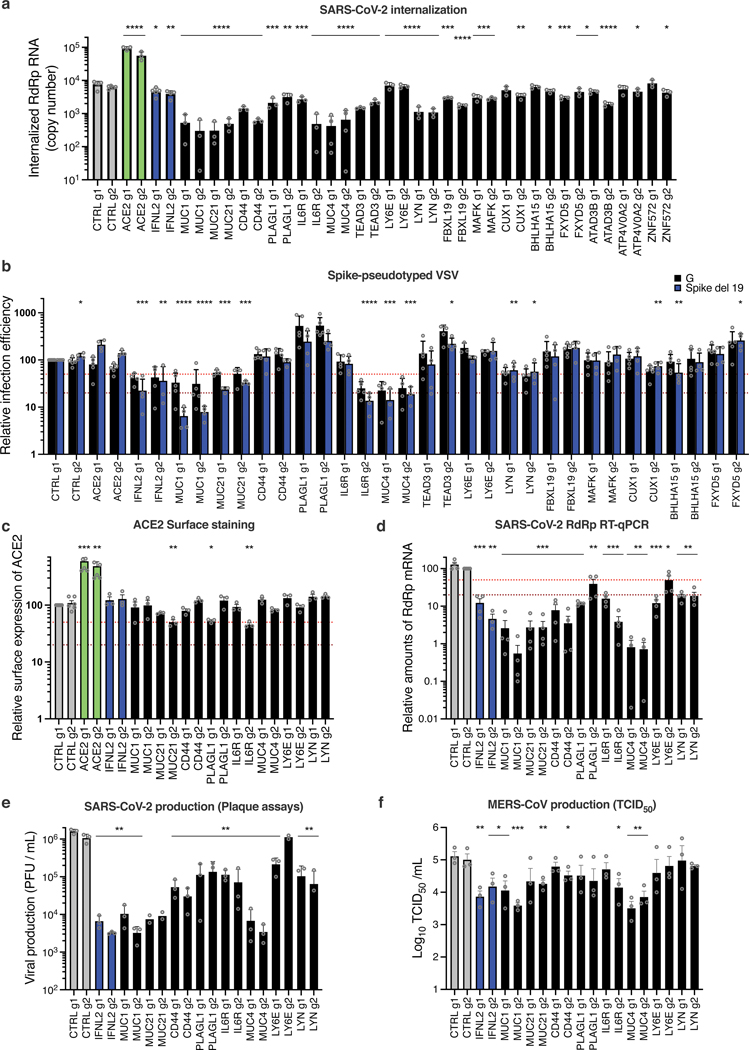
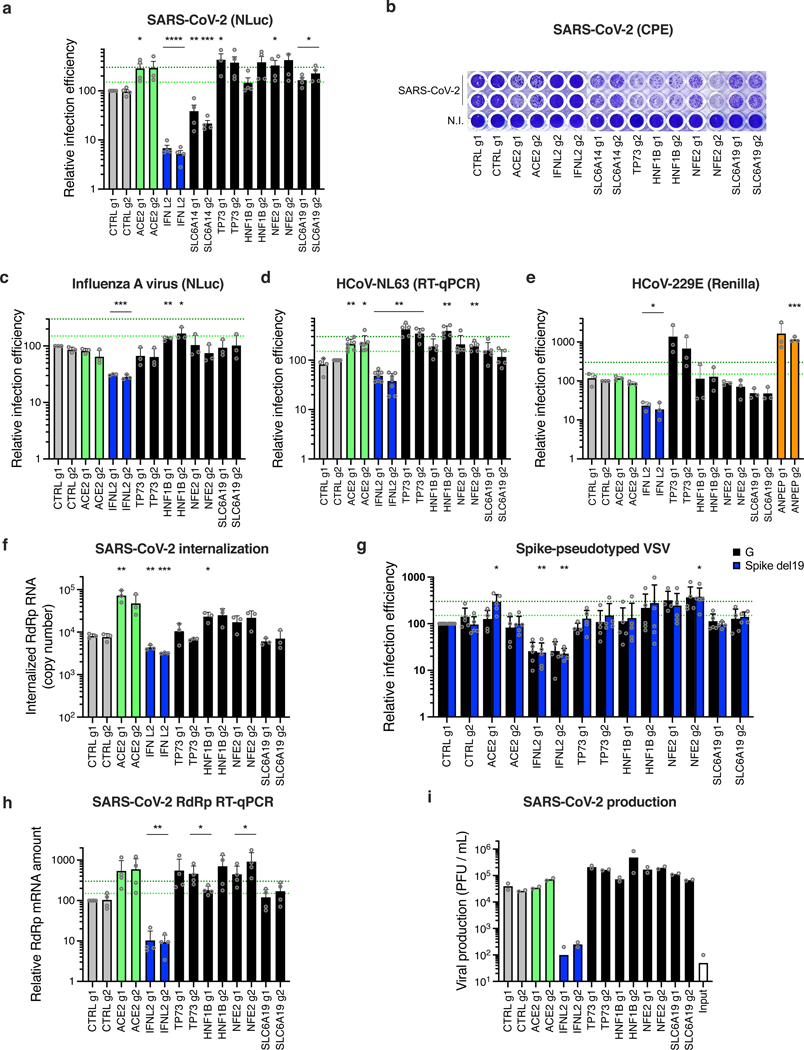
CRISPR knockout (KO) screens have identified host factors regulating severe acute respiratory syndrome coronavirus 2 (SARS-CoV-2) replication. Here, we conducted a meta-analysis of these screens, which showed a high level of cell-type specificity of the identified hits, highlighting the necessity of additional models to uncover the full landscape of host factors. Thus, we performed genome-wide KO and activation screens in Calu-3 lung cells and KO screens in Caco-2 colorectal cells, followed by secondary screens in four human cell lines. This revealed host-dependency factors, including AP1G1 adaptin and ATP8B1 flippase, as well as inhibitors, including mucins. Interestingly, some of the identified genes also modulate Middle East respiratory syndrome coronavirus (MERS-CoV) and seasonal human coronavirus (HCoV) (HCoV-NL63 and HCoV-229E) replication. Moreover, most genes had an impact on viral entry, with AP1G1 likely regulating TMPRSS2 activity at the plasma membrane. These results demonstrate the value of multiple cell models and perturbational modalities for understanding SARS-CoV-2 replication and provide a list of potential targets for therapeutic interventions.


Conflict of interest statement

Competing interests

J.G.D. consults for Agios, Microsoft Research, Phenomic AI, BioNTech, and Pfizer; J.G.D consults for and has equity in Tango Therapeutics. J.G.D.’s interests were reviewed and are managed by the Broad Institute in accordance with its conflict-of-interest policies. The other authors declare no competing interests.

Figures

Extended Data Fig. 1
Extended Data Fig. 1. Meta-analysis of genome-wide screens.
a. Volcano plot showing the top genes conferring resistance (right, blue) and sensitivity (left, red) to SARS-CoV-2 when knocked out in Vero E6 cells for this screen (left panel) and the screen conducted by Wei et al. 2021 (Wilen; right panel). Controls are indicated in green. The gene-level z-score and -log10(FDR) were calculated after averaging across conditions (of note, the FDR value for ACE2 is effectively zero but has been assigned a -log(FDR) value for plotting purposes). (n = 20,928 for each plot). b. Cumulative distribution plots analyzing overlap of top hits between this screen and the Wilen screen. Left panel: Putative hit genes from the Wilen screen are ranked by mean z-score, and classified as validated hits based on mean z-score in the secondary screen, using a threshold of greater than 3. Right panel: Putative hit genes from this screen are ranked by mean z-score, and classified as validated hits based on mean z-score in the Wilen screen, using a threshold of greater than 3. c. Comparison between genome-wide screens conducted in A549 cells overexpressing ACE2 by Daniloski et al. (Sanjana) and Zhu et al. (Zhang) using the GeCKOv2 and Brunello libraries, respectively. Pearson’s correlation coefficient r is indicated. (n = 18,484). d. Pair-wise comparison between genome-wide screens conducted in Huh7.5.1-ACE2-TMPRSS2, Huh7.5, and Huh7 cells by Wang et al. (Puschnik), Schneider et al. (Poirier), and Baggen et al. (Daelemans), respectively, using the GeCKOv2 and Brunello libraries as indicated. Annotated genes include top 3 resistance hits from each screen as well as genes that scored in multiple cell lines based on the criteria used to construct the Venn diagram in Fig. 1d. Pearson’s correlation coefficient r is indicated. (n = 18,470 for each plot).
Extended Data Fig. 2
Extended Data Fig. 2. Genome-wide CRISPR KO and CRISPRa screens in Calu-3 and Caco-2 cells.
a. Volcano plot showing the top genes conferring resistance (right, blue) to SARS-CoV-2 when knocked out in Calu-3 cells. Controls are indicated in green. This screen did not have any sensitization hits. The gene-level z-score and –log10(FDR) were calculated after averaging across replicates. (n = 20,513). b. Volcano plot showing the top genes conferring resistance (right, red) and sensitivity (left, blue) to SARS-CoV-2 when overexpressed in Calu-3 cells. Controls are indicated in green. The gene-level z-score and –log10(FDR) were calculated after averaging across replicates. (n = 20,494). c. Volcano plot showing the top genes conferring resistance (right, blue) and sensitivity (left, red) to SARS-CoV-2 when knocked out in Caco-2 cells. Controls are indicated in green. The gene-level z-score and –log10(FDR) were calculated after averaging across replicates. (n = 18,804). d. Comparison between gene hits in Calu-3 KO and activation screens. Dotted lines indicated mean z-scores of -3 and 2.5 or 3 for each screen. Proviral and antiviral genes are indicated in blue and red, respectively. Pearson’s correlation coefficient r is indicated. (n = 18,173).
Extended Data Fig. 3
Extended Data Fig. 3. Secondary screens in A549-ACE2, Huh7.5.1-ACE2, Caco-2-ACE2 and Calu-3 cells.
a-d. Scatter plots showing gene-level z-scores for each secondary activation screen with top resistance and sensitization hits annotated (A549-ACE2, Huh7.5.1-ACE2, Caco-2-ACE2 and Calu-3, respectively). Pearson’s correlation coefficient, r, is labeled (n = 677, each). e-h. Scatter plots showing gene-level z-scores for each secondary activation screen with top resistance and sensitization hits annotated (A549-ACE2, Huh7.5.1-ACE2, Caco-2-ACE2 and Calu-3, respectively). Pearson’s correlation coefficient, r, is labeled (n = 820, each). i-l. Scatter plots showing mean z-scores comparing each secondary activation screen to each secondary KO screen for each cell line with top resistance and sensitization hits annotated (A549-ACE2, Huh7.5.1-ACE2, Caco-2-ACE2 and Calu-3). Pearson’s correlation coefficient, r, is labeled (n = 179, each).
Extended Data Fig. 4
Extended Data Fig. 4. Secondary KO screen in Calu-3-Cas12a cells and comparison with Cas9-based screens.
a. Scatter plot showing the gene-level z-scores of genes when knocked out using Cas12a in Calu-3 cells. The top genes conferring resistance to SARS-CoV-2 are annotated and shown in blue. The top genes conferring sensitivity to SARS-CoV-2 are annotated and shown in red. (n = 684). Only one replicate is shown as the second replicate had low sequencing quality. b. Scatter plots showing mean z-scores comparing each Cas9 to Cas12a secondary KO screens for Calu-3 cells with top resistance and sensitization hits annotated. Pearson correlation, r, labeled (n = 600 each).
Extended Data Fig. 5
Extended Data Fig. 5. Proviral gene candidate validation in Calu-3 cells.
a. Gating strategy for flow cytometry analysis. Pseudocolored dot-plots of sorted Calu-3 cells, showing gates used for the analysis in Fig. 3a (and all figures using flow cytometry analysis). b. Impact of additional candidate gene KO (panel complementary to Fig. 4a). Calu-3-Cas9 cells were stably transduced to express 2 different sgRNAs (g1, g2) per indicated gene and selected. Cells were infected with SARS-CoV-2 bearing the mNeonGreen (mNG) reporter and the infection efficiency was scored 48 h later by flow cytometry. The cell line/screen in which the candidates were identified is indicated below the graph; data from 2 independent experiments are shown. c. AP1G1, AP1B1, and AAGAB depletion efficiency in Calu-3 KO cell populations. A representative immunoblot is shown out of 3 independent experiments; GAPDH serves as a loading control. d. SARS-CoV-2-induced cytopathic effects in KO cell lines. Calu-3-Cas9 cells were stably transduced to express 2 different sgRNAs (g1, g2) per indicated gene and selected. Cells were infected by SARS-CoV-2 at MOI 0.005 and ~5 days later stained with crystal violet. Representative images out of 2 independent experiments are shown.
Extended Data Fig. 6
Extended Data Fig. 6. Proviral gene candidate validation in other cell lines.
a. Caco-2-Cas9 cells expressing 2 sgRNAs (g1, g2) per indicated gene were infected with SARS-CoV-2 mNG reporter. Infection efficiency scored 48 h later by flow cytometry (left panel). In parallel, supernatants were collected and virus production determined by plaque assays (right panel). Mean and s.e.m. of 3 (left) and mean of 2 (right) independent experiments are shown, respectively. b. Similar to a, with A549-ACE2 cells. Mean and s.e.m. of 5 (left) and mean of 2 (right) independent experiments. c. Similar to a, with Huh7.5.1-ACE2 cells. Mean and s.e.m. of 4 independent experiments (left) or a representative experiment (with technical duplicates) is shown (right). a-c. One-way ANOVA with Dunnett’s test (* p < 0.05, ** p < 0.01, *** p < 0.001, **** p < 0.0001). Of note, ACE2 g1 targets an intron-exon junction on ACE2 endogenous sequence and cannot target ACE2 ectopic CDS in ACE2-transduced cells. d-f. Expression levels of AP1G1, AP1B1 and AAGAB in Caco-2 (d), A549-ACE2 (e) and Huh7.5.1-ACE2 (f) KO cells were analyzed by immunoblot, Actin served as a loading control. A representative immunoblot is shown (from 3 independent experiments). g. RNA samples from 9 (HAE from different donors22), 8 (Calu-3), or 3 (Caco-2, A549-ACE2) independent experiments were analyzed by RT-qPCR. Statistical significance was determined by unadjusted, two-sided Mann-Whitney test (**** p < 0.0001). h. Candidate gene expression levels in cell types from the respiratory epithelium (from Chua et al.). Expression levels in COVID-19 versus healthy patients are color coded; the percentage of cells expressing the respective gene is size coded, as indicated. i. Cells were pretreated for 1 h with camostat mesylate or not, incubated with SARS-CoV-2 mNG on ice and washed. The media was replaced with serum-free media containing trypsin in order to prime Spike, or no trypsin. Infection efficiency was analyzed by flow cytometry after 24 h (for the + camostat conditions) or after 48 h (for CTRL). Statistical significance was determined by two-sided t-tests with no adjustment for multiple comparisons (* p < 0.05, ** p < 0.01, *** p < 0.001, **** p < 0.0001). The exact n and p-values (a, b, c, g, i) are indicated in Supplementary Data 17.
Extended Data Fig. 7
Extended Data Fig. 7. Antiviral gene expression levels.
a. Dot plot depicting the expression levels of the best validated antiviral genes in the different cell types from the respiratory epithelium, from Chua et al. data set. Expression levels in COVID-19 versus healthy patients are color coded; the percentage of cells expressing the respective gene is size coded, as indicated. b. Relative expression levels of a selection of antiviral factors in primary human airway epithelial cells (HAE) compared to Calu-3 cells. RNA samples from 9 and 8 independent experiments for HAE and Calu-3, respectively (described in, as in Extended Data Fig. 6g), were analyzed by RT-qPCR using the indicated taqmans (samples were normalized with ActinB and GAPDH). Statistical significance was determined by unadjusted, two-sided Mann-Whitney test (**** p < 0.0001). The exact n and p-values (b) are indicated in Supplementary Data 17. c. Relative expression levels of the antiviral hits in CRISPRa Calu-3 cells. RNA samples from 3 independent experiments (corresponding to Fig. 6) were analyzed by RT-qPCR using the indicated taqmans (samples were normalized with ActinB and GAPDH); relative expression levels compared to CTRL g1 populations are shown. d-e. Impact of SARS-CoV-2 infection and interferon treatment on antiviral factor expression in Calu-3 cells (d) and primary HAE (e), as indicated, in samples from ≥ 2 independent experiments from our previous study.
Extended Data Fig. 8
Extended Data Fig. 8. Impact of the identified antiviral genes on SARS-CoV-2 in Caco-2 and A549-ACE2 cells.
Caco-2-dCas9-VP64 (a) and A549-ACE2-dCas9-VP64 (b) cells were stably transduced to express 2 different sgRNAs (g1, g2) per indicated gene promoter, or negative controls (CTRL) and selected prior to SARS-CoV-2 mNG infection. The percentage of infected cells was scored 48 h later by flow cytometry. The mean of relative infection efficiencies are shown for 2 independent experiments. The red and dark red dashed lines represent 50% and 80% inhibition, respectively.
Extended Data Fig. 9
Extended Data Fig. 9. Characterization of proviral genes identified by CRISPRa.
a-b. ACE2 expression in CRISPRa cell lines. Calu-3-Cas9 cells were stably transduced to express 2 different sgRNAs (g1, g2) per indicated gene and selected (parallel samples from Fig. 8). a. The cells were lysed and expression levels of ACE2 were analyzed, Actin served as a loading control A representative immunoblot (out of 2 independent experiments) is shown. b. ACE2 surface staining using Spike-RBD-mFc. Mean and SEM of 3 independent experiments. Statistical significance was determined by a two-sided t-test (* p < 0.05, ** p < 0.01, *** p < 0.001, **** p < 0.0001). c. Dot plot depicting the expression levels of the best validated proviral genes in the different cell types from the respiratory epithelium, from Chua et al. data set. Expression levels in COVID-19 versus healthy patients are color coded; the percentage of cells expressing the respective gene is size coded, as indicated.
Extended Data Fig. 10
Extended Data Fig. 10. Bidirectional screen data comparison between this study and Hsu et al’s.
a. Comparison between this Calu-3 KO screen to the Calu-3 KO screen conducted by Hsu and colleagues. Genes that scored among the top 20 resistance hits in both screens are annotated and shown in green. Pearson’s correlation coefficient r is indicated. b. Comparison between this Calu-3 activation screen to the Calu-3 activation screen conducted by Hsu and colleagues. Genes that scored among the top 20 resistance hits and sensitization hits in both screens are annotated and shown in green. Pearson’s correlation coefficient r is indicated.
Fig. 1.
Fig. 1.. Cell-type specificity of SARS-CoV-2 regulators identified by CRISPR screens.
a. Schematic of pooled screen pipeline to identify SARS-CoV-2 regulators in Vero E6 cells. b. Scatter plot showing the gene-level mean z-scores of genes when knocked out in Vero E6 cells. The top genes conferring resistance to SARS-CoV-2 are annotated and shown in blue. (n = 20,928). c. Comparison between this Vero E6 screen to the Vero E6 screen conducted by the Wilen lab. Genes that scored among the top 20 resistance hits and sensitization hits in both screens are labeled. Pearson’s correlation coefficient r is indicated. (n = 20,928). d. Venn diagram comparing hits across screens conducted in Vero E6, A549 and Huh7.5 (or Huh7.5.1) cells (ectopically expressing ACE2 and TMPRSS2 or not). The top 20 genes from each cell line are included, with genes considered a hit in another cell line if the average z-score was > 3.
Fig. 2.
Fig. 2.. Genome-wide CRISPR screens in Calu-3 reveal new regulators of SARS-CoV-2.
a. Scatter plot showing the gene-level mean z-scores of genes when knocked out in Calu-3 cells. The top genes conferring resistance to SARS-CoV-2 are annotated and shown in blue. This screen did not have any sensitization hits. (n = 20,513). b. Scatter plot showing the gene-level mean z-scores of genes when overexpressed in Calu-3 cells. The top genes conferring resistance and sensitivity to SARS-CoV-2 are annotated and shown in red and blue, respectively. (n = 20,000). c. Scatter plot showing the gene-level mean z-scores of genes when knocked out in Caco-2 cells. The top genes conferring resistance to SARS-CoV-2 are annotated and shown in blue. (n = 18,804). d. Heatmap of top 5 resistance hits from each cell line after averaging across screens in addition to genes that scored in multiple cell lines based on the criteria used to construct the Venn diagram in Fig. 1d (based on and this study). Grey squares indicate genes that were filtered out for that particular cell line due to number of guides targeting that gene (see Methods).
Fig. 3.
Fig. 3.. Secondary screens in Calu-3, Caco-2-ACE2, A549-ACE2 and Huh7.5.1-ACE2 cells.
a. Schematic of secondary library design and screen strategy. b. Cumulative distribution plots analyzing overlap of top hits between primary and secondary screens. Putative hit genes from the primary screen are ranked by mean z-score, and classified as validated hits based on mean z-score in the secondary screen, using a threshold of greater than 3 for KO or less than -3 for activation. AUC: area under the curve. c. Heatmap comparison of top resistance and sensitization hits from secondary KO screens across cell lines. d. Heatmap comparison of top resistance and sensitization hits from secondary activation screens across cell lines.
Fig. 4.
Fig. 4.. Impact of the identified proviral genes on coronaviruses SARS-CoV-2, HCoV-229E, HCoV-NL63, MERS-CoV and on orthomyxovirus influenza A.
Calu-3-Cas9 cells were stably transduced to express 2 different sgRNAs (g1, g2) per indicated gene and selected. a. Cells were infected with SARS-CoV-2 bearing the mNeonGreen (mNG) reporter and the infection efficiency was scored 48h later by flow cytometry. The cell lines/screens in which the candidates were identified are indicated below the graph. b. Cells were infected with influenza A virus bearing the Nanoluciferase (NLuc) reporter and 10h later, relative infection efficiency was measured by monitoring NLuc activity. c. Cells were infected with HCoV-NL63 and 5 days later, relative infection efficiency was determined using RT-qPCR. d. Cells were infected with HCoV-229E-Renilla and 48–72h later, relative infection efficiency was measured by monitoring Renilla activity. e-f. Cells were infected with MERS-CoV and 16h later, the percentage of infected cells was determined using anti-Spike (e) or anti-dsRNA (f) immunofluorescence (IF) staining followed by microscopy analysis (n=10 fields per condition). The mean and SEM of ≥ 3 independent experiments are shown (a-f; except in b for ATP8B1 g2, and in e and f for ATP8B1 g1, n=2). Statistical significance was determined with one-way ANOVA with Dunnett’s test (* p<0.05, ** p<0.01, *** p<0.001, **** p<0.0001) (a-f). Exact n numbers and p-values are indicated in Supplementary Data 17. The red and dark red dashed lines represent 50% and 80% inhibition, respectively.
Fig. 5.
Fig. 5.. Characterization of the impact of identified SARS-CoV-2 dependency factors.
Calu-3-Cas9 cells were transduced to express 2 sgRNAs (g1, g2) per gene. a. Cells were infected with SARS-CoV-2 mNG and infection efficiency was scored 48h later by flow cytometry. b. Expression levels of ACE2 were analyzed by immunoblot, Actin served as a loading control. A representative experiment (from 2 independent experiments) is shown. c. Relative surface ACE2 expression was measured using a Spike-RBD-mFc fusion followed by flow cytometry analysis. d. Cells were incubated with SARS-CoV-2 for 2h, treated with Subtilisin A followed by RNA extraction and RdRp RT-qPCR analysis. e. Cells were infected with Spike del19 and VSV-G pseudotyped, GFP-expressing VSV and infection efficiency was analyzed 24h later by flow cytometry. f. Cells were infected with SARS-CoV-2 and, 24h later, lysed for RNA extraction and RdRp RT-qPCR analysis. g. Supernatants from f were harvested and plaque assays performed. h. Cells were infected with MERS-CoV and 16h later, viral production in the supernatant was measured by TCID50. i. Cells were pre-treated with camostat mesylate (cam.) or not, or remdesivir (RDV) or not, incubated with SARS-CoV-2 for 30 min on ice and washed. Spike was then primed with trypsin or not, the media replaced and 7h later, cells were lysed for RNA extraction and RdRp RT-qPCR analysis. j. Similar to i, with Spike-pseudotyped, Firefly-expressing VSV. Cells were lysed and relative infection measured by monitoring Firefly activity 24h later. The mean and SEM of ≥ 5 (a), ≥ 3 (c, d, e, f, h, i; except for EP300 and ATP8B1 KO in c and for ATP8B1 and TMPRSS2 KO in e, n=2) or 4 (g) independent experiments, or the mean of 2 independent experiments (j) are shown. Statistical significance was analyzed using a two-sided t-test with no adjustment for multiple comparisons (a, c, i) or a one-way ANOVA with Dunnett’s test (d, e, f, g, h) (* p<0.05, ** p<0.01, *** p<0.001, **** p<0.0001). Exact n numbers and p-values are indicated in Supplementary Data 17. The red and dark red dashed lines represent 50% and 80% inhibition, respectively (a, c-f).
Fig. 6.
Fig. 6.. Impact of the identified antiviral genes on coronaviruses SARS-CoV-2, HCoV-229E, and MERS-CoV, and on orthomyxovirus influenza A.
Calu-3-dCas9-VP64 (a-e) or Calu-3-Cas9 (f) cells were stably transduced to express 2 sgRNAs (g1, g2) per indicated gene promoter (a-e) or coding region (f), or negative controls (CTRL) and selected for at least 10–15 days. a. Cells were infected with SARS-CoV-2 bearing the mNG reporter and the infection efficiency was scored 48h later by flow cytometry. b. Cells were infected with HcoV-NL63 and infection efficiency was scored 5 days later by RT-qPCR. c. Cells were infected with HcoV-229E-Renilla and 48–72h later, relative infection efficiency was measured by monitoring Renilla activity. d. Cells were infected with MERS-CoV and 16h later, the percentage of infected cells was determined using anti-Spike IF staining followed by microscopy analysis (n=10 fields per condition). e. Cells were infected with influenza A virus bearing the NLuc reporter and 10h later relative infection efficiency was measured by monitoring NLuc activity. f. Cells were infected with SARS-CoV-2 bearing the mNG reporter and the infection efficiency was scored 48h later by flow cytometry. The mean and SEM of ≥ 3 (a, b, c, d, e; except for a, JADE3, OR1N1 KO, d, MAFK1 g1, ATAD3B g2, ZNF572 g2 KO, and e, ATAD3B, ATP6V0A2, ZNF572 KO, n=2) or 2 (f) independent experiments are shown. Statistical significance was determined by a two-sided t-test (* p<0.05, ** p<0.01, *** p<0.001, **** p<0.0001) (a-e). Exact n numbers and p-values are indicated in Supplementary Data 17. The red and dark red dashed lines indicate 50% and 80% inhibition (a-e), and the green and dark green dashed lines indicate 150% and 300% increase in infection efficiency, respectively (f).
Fig. 7.
Fig. 7.. Characterization of the impact of identified SARS-CoV-2 antiviral factors.
Calu-3-dCas9-VP64 cells were stably transduced to express 2 different sgRNAs (g1, g2) per indicated gene promoter and selected for 10–15 days. a. Cells were incubated with SARS-CoV-2 for 2h and then treated with Subtilisin A followed by RNA extraction and RdRp RT-qPCR analysis. b. Cells were infected with Spike del19 and VSV-G pseudotyped, Firefly-expressing VSV and infection efficiency was analyzed 24h later by monitoring Firefly activity. c. Relative surface ACE2 expression was measured using a Spike-RBD-mFc fusion and a fluorescent secondary antibody followed by flow cytometry analysis. d. Cells were infected with SARS-CoV-2 and, 24h later, lysed for RNA extraction and RdRp RT-qPCR analysis. e. Aliquots of the supernatants from d were harvested and plaque assays were performed to evaluate the production of infectious viruses in the different conditions. f. Cells were infected with MERS-CoV and 16h later, infectious particle production in the supernatant was measured by TCID50. The mean and SEM of ≥ 3 independent experiments are shown (a, c, d, e, f; except for e, MUC21 and LY6E g2 KO, n=2). Statistical significance was determined by a two-sided t-test with no adjustment for multiple comparisons (* p<0.05, ** p<0.01, *** p<0.001, **** p<0.0001) (a-f). Exact n numbers and p-values are indicated in Supplementary Data 17. The red and the dark red (b, c, d) dashed lines represent 50% and 80% inhibition, respectively.
Fig. 8.
Fig. 8.. Impact of the proviral genes identified by CRISPRa on coronaviruses SARS-CoV-2, HCoV-229E, HCoV-NL63 and on orthomyxovirus influenza A.
Calu-3-dCas9-VP64 cells were stably transduced to express 2 different sgRNAs (g1, g2) per indicated gene promoter and selected. a. Cells were non infected (N.I.) or incubated with SARS-CoV-2 bearing NLuc reporter and the infection efficiency was scored 30 h later by monitoring NLuc activity. b. Cells were infected by SARS-CoV-2 at MOI 0.05 and 5 days later stained with crystal violet. Representative images from 2 independent experiments are shown. c. Cells were infected with influenza A virus bearing NLuc reporter and 10h later, relative infection efficiency was measured by monitoring NLuc activity. d. Cells were infected with HCoV-NL63 and 5 days later, infection efficiency was determined using RT-qPCR. e. Cells were infected with HCoV-229E-Renilla and 72h later, relative infection efficiency was measured by monitoring Renilla activity. f. Cells were incubated with SARS-CoV-2 for 2h and then treated with Subtilisin A followed by RNA extraction and RdRp RT-qPCR analysis as a measure of viral internalization. g. Cells were infected with Spike del19 and VSV-G pseudotyped, Firefly-expressing VSV and infection efficiency was analyzed 24h later by monitoring Firefly activity. h. Cells were infected with SARS-CoV-2 and, 24h later, lysed for RNA extraction and RdRp RT-qPCR analysis. i. Aliquots of the supernatants from h were harvested and plaque assays were performed to evaluate the production of infectious viruses in the different conditions. The mean and SEM of ≥ 3 (a, c, e, f), ≥ 4 (d, g, h), or 2 (i) independent experiments are shown. Statistical significance was determined by a two-sided t-test with (* p<0.05, ** p<0.01, *** p<0.001, **** p<0.0001) (a, c-h). Exact n numbers and p-values are indicated in Supplementary Data 17. The green and dark green dashed lines indicate 150% and 300% increase in infection efficiency, respectively (a, c-e, g-h).

Update of

References

    1. Drosten C et al. Identification of a Novel Coronavirus in Patients with Severe Acute Respiratory Syndrome. N Engl J Med 348, 1967–1976 (2003). - PubMed
    1. Peiris J et al. Coronavirus as a possible cause of severe acute respiratory syndrome. The Lancet 361, 1319–1325 (2003). - PMC - PubMed
    1. Zhong N et al. Epidemiology and cause of severe acute respiratory syndrome (SARS) in Guangdong, People’s Republic of China, in February, 2003. The Lancet 362, 1353–1358 (2003). - PMC - PubMed
    1. Zaki AM, van Boheemen S, Bestebroer TM, Osterhaus ADME & Fouchier RAM Isolation of a Novel Coronavirus from a Man with Pneumonia in Saudi Arabia. N Engl J Med 367, 1814–1820 (2012). - PubMed
    1. van der Hoek L Human coronaviruses: what do they cause? Antivir. Ther. (Lond.) 12, 651–658 (2007). - PubMed

Methods-only references

    1. Konermann S et al. Genome-scale transcriptional activation by an engineered CRISPR-Cas9 complex. Nature 517, 583–588 (2015). - PMC - PubMed
    1. DeWeirdt PC et al. Optimization of AsCas12a for combinatorial genetic screens in human cells. Nat Biotechnol 39, 94–104 (2021). - PMC - PubMed
    1. Sanjana NE, Shalem O & Zhang F Improved vectors and genome-wide libraries for CRISPR screening. Nat Methods 11, 783–784 (2014). - PMC - PubMed
    1. Shalem O et al. Genome-scale CRISPR-Cas9 knockout screening in human cells. Science 343, 84–87 (2014). - PMC - PubMed
    1. Doyle T et al. The interferon-inducible isoform of NCOA7 inhibits endosome-mediated viral entry. Nat Microbiol 3, 1369–1376 (2018). - PMC - PubMed

Publication types

MeSH terms