. 2022 Jul 25;5(1):740.
doi: 10.1038/s42003-022-03637-w.

PI3Kδ activity controls plasticity and discriminates between EMT and stemness based on distinct TGFβ signaling

Affiliations

PI3Kδ activity controls plasticity and discriminates between EMT and stemness based on distinct TGFβ signaling

Jean Agnetti et al. Commun Biol. .

Abstract

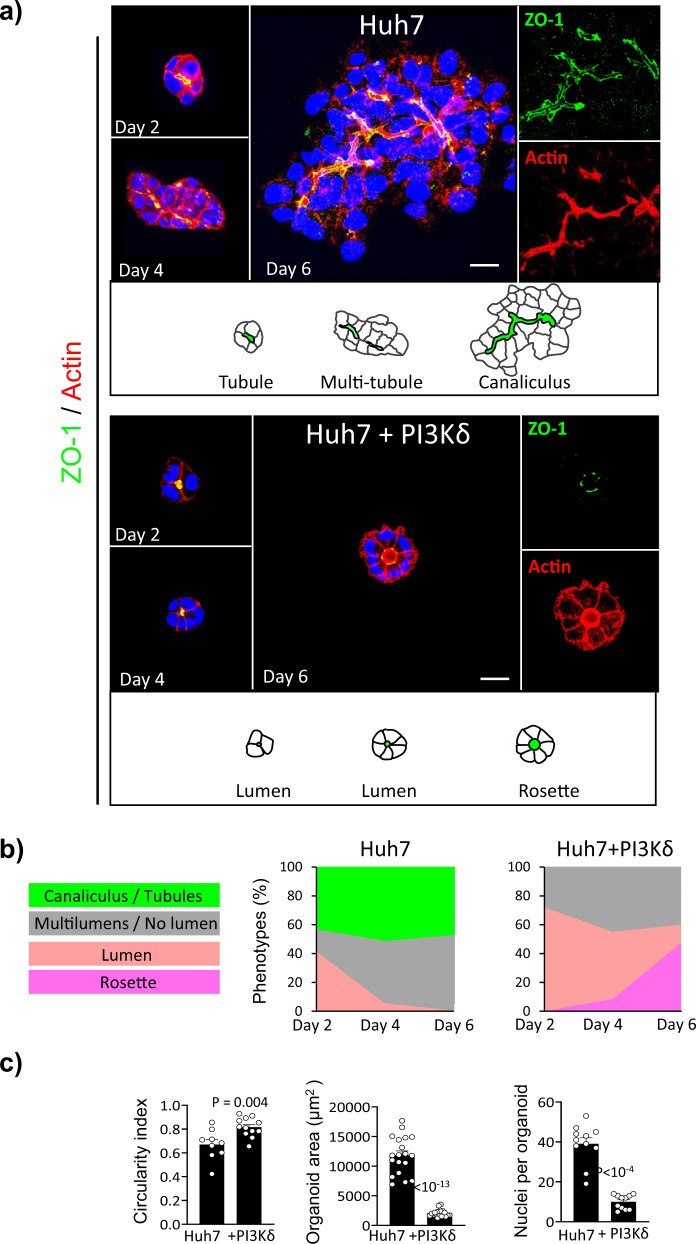
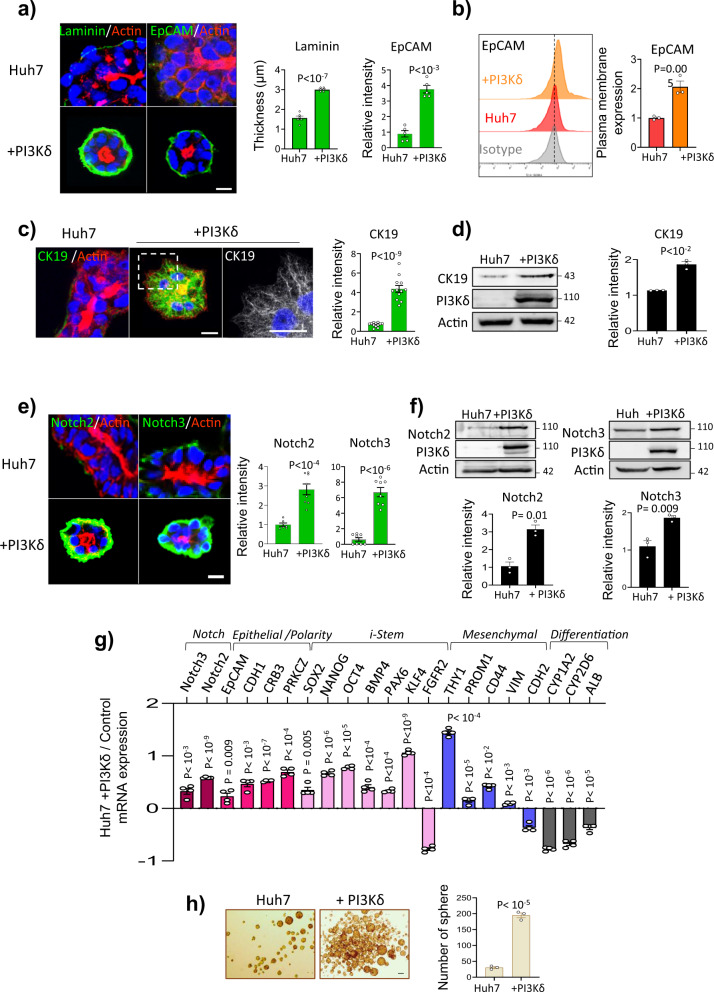
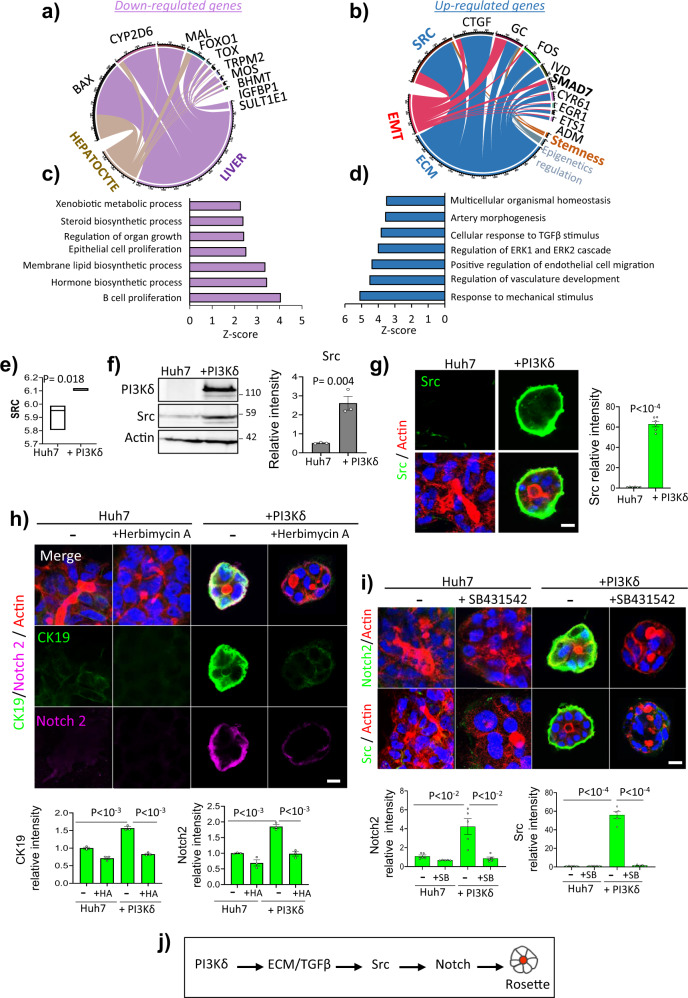
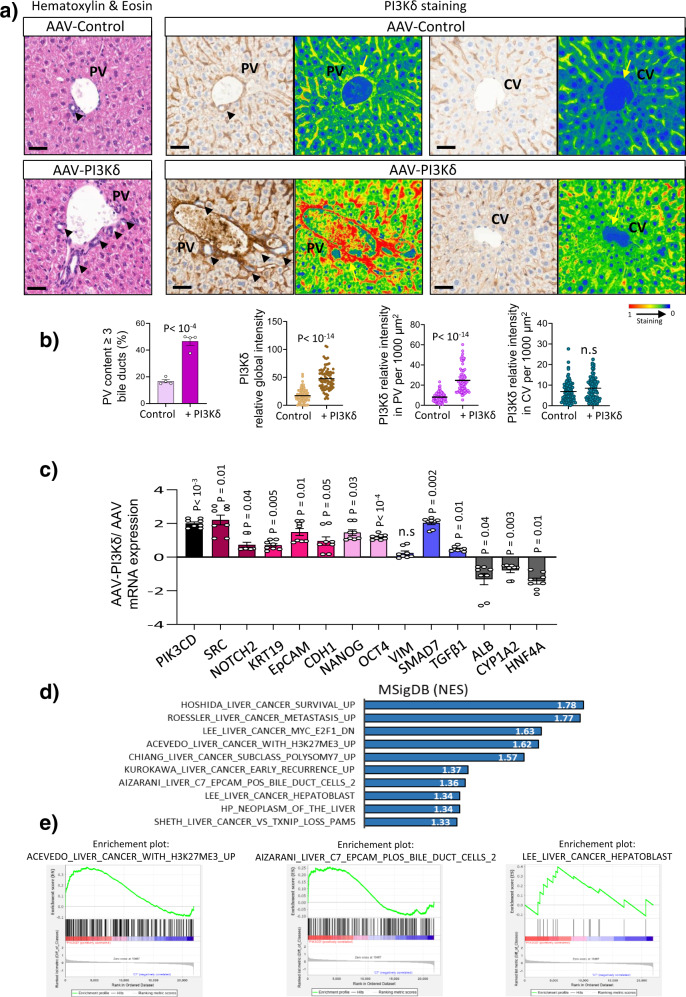
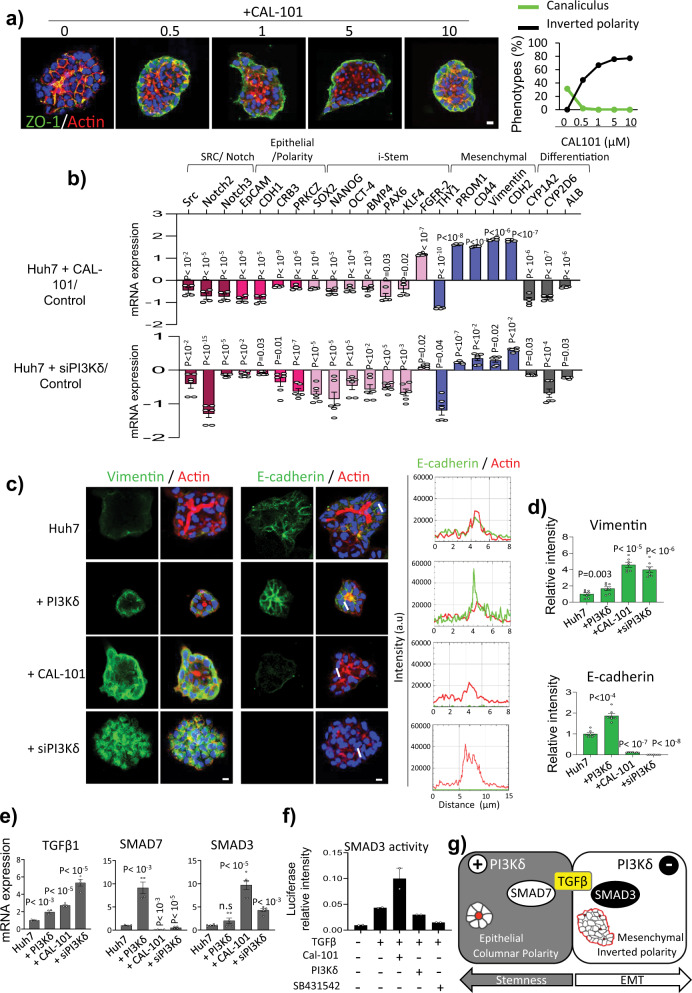
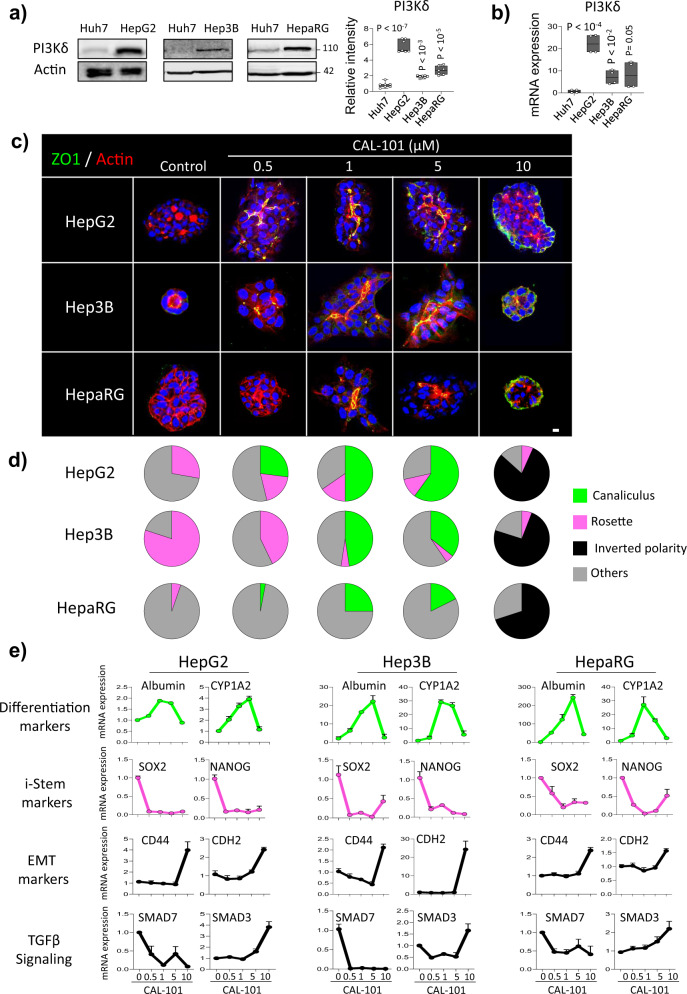
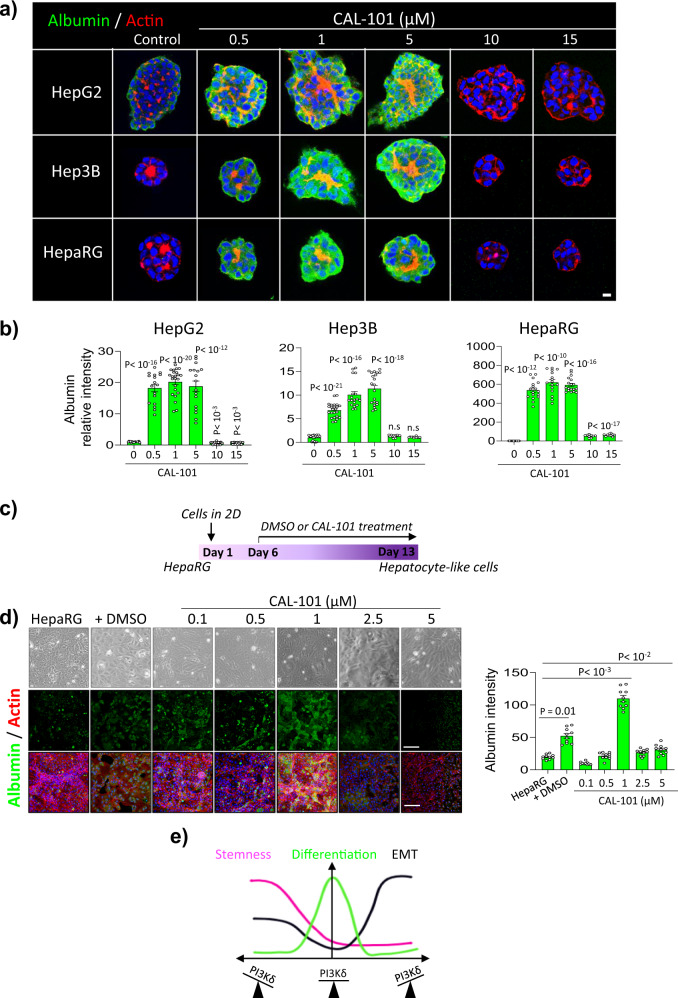
The stem cells involved in formation of the complex human body are epithelial cells that undergo apicobasal polarization and form a hollow lumen. Epithelial plasticity manifests as epithelial to mesenchymal transition (EMT), a process by which epithelial cells switch their polarity and epithelial features to adopt a mesenchymal phenotype. The connection between the EMT program and acquisition of stemness is now supported by a substantial number of reports, although what discriminates these two processes remains largely elusive. In this study, based on 3D organoid culture of hepatocellular carcinoma (HCC)-derived cell lines and AAV8-based protein overexpression in the mouse liver, we show that activity modulation of isoform δ of phosphoinositide 3-kinase (PI3Kδ) controls differentiation and discriminates between stemness and EMT by regulating the transforming growth factor β (TGFβ) signaling. This study provides an important tool to control epithelial cell fate and represents a step forward in understanding the development of aggressive carcinoma.


Conflict of interest statement

The authors declare no competing interests.

Figures

Fig. 1
Fig. 1. PI3Kδ is required for bile canaliculi formation and its overexpression induces formation of rosette-like structures.
a Time-course analysis of lumen formation in Huh7 and Huh7 overexpressing PI3Kδ (Huh7 + PI3Kδ) organoids plated in 3D Matrigel-matrix and stained after 2, 4 or 6 days for Zonula-occludens 1 (ZO-1, green), actin microfilaments using phalloidin (red) and nuclei using Hoechst (blue). Scale bar: 10 μm. b Quantification of the phenotypes percentage over the days of culture of Huh7 (n = 117 organoids) and Huh7 + PI3Kδ (n = 123 organoids). c Quantification of Huh7 and Huh7 + PI3Kδ circularity index, organoids area and nuclei per organoid. Each dot of the graph corresponds to an organoid. All values are expressed as mean ± S.E.M.
Fig. 2
Fig. 2. PI3Kδ activity regulates the plasticity of hepatocyte between epithelial and mesenchymal features.
a Immunofluorescence staining in Huh7 and Huh7 + PI3Kδ after 6 days of 3D culture for Laminin-111 and EpCAM (green), actin microfilaments using phalloidin (red) and nuclei using Hoechst (blue). Scale bar: 10 μm. Quantification of laminin thickness and the relative intensity of EpCAM (right). Each dot of the graph corresponds to an organoid. b Flow cytometry analysis of EpCAM intensity at plasma membrane in Huh7 (red) versus Huh7 + PI3K cells 3 days after transfection (orange), control isotype is presented in gray. Right: Quantification of EpCAM mean intensity at the plasma membrane measured by flow cytometry analysis. c Immunofluorescence staining in Huh7 and Huh7 + PI3Kδ after 6 days of 3D culture for CK19 (green), actin microfilaments using phalloidin (red) and nuclei using Hoechst (blue). Scale bar: 10 μm. Quantification of the relative intensity of CK19 (right). Each dot of the graph corresponds to an organoid. d Immunoblot analysis of CK19 in Huh7 and Huh7 + PI3Kδ with the quantification of the relative intensity (n = 3 experiments). e Immunofluorescence staining in Huh7 and Huh7 + PI3Kδ after 6 days of 3D culture for Notch2 and Notch3 (green), actin microfilaments using phalloidin (red) and nuclei using Hoechst (blue). Scale bar: 10 μm. Quantification of the relative intensities (right). Each dot of the graph corresponds to an organoid. f Immunoblot analysis of Notch2 and Notch3 in Huh7 and Huh7 + PI3Kδ with the quantification of the relative intensity (below, n = 3 experiments). g RT-qPCR analysis of different genes performed in Huh7 and Huh7 + PI3Kδ organoids after 6 days of 3D culture. Data are presented as log10 mRNA fold change in Huh7 + PI3Kδ compared to Huh7 in two independent experiments performed in duplicate. h Spheroid formation assay in Huh7 and Huh7 + PI3Kδ, the number of spheres was determined after 5 days of culture based on two independent experiments performed in triplicate. All values are expressed as mean ± S.E.M.
Fig. 3
Fig. 3. The PI3Kδ-induced phenotype in Huh7 cells is dependent on TGFβ/Src pathway.
a, b Circosplot representing connection numbers during text-mining prioritization on pubmed of the genes downregulated (a) and upregulated (b) by PI3Kδ in transcriptomics analysis and terms hepatocyte, liver, EMT, ECM, epigenetics regulation and stemness. c, d functional enrichment of the gene downregulated (c) and upregulated (d) by PI3Kδ in transcriptomics analysis (GO-BP basis) e boxplot of Src expression in transcriptomics analysis. f Immunoblot analysis of Src in Huh7 and Huh7 + PI3Kδ with the quantification of the relative intensity (n = 3 experiments). g Immunofluorescence staining for Src (green), actin microfilaments using phalloidin (red) and nuclei (blue) in Huh7 and Huh7 + PI3Kδ organoids after 6 days of 3D culture. Scale bar: 10 µm. Quantification of the relative intensities (right). Each dot of the graph corresponds to an organoid. h Immunofluorescence staining for CK19 (purple), Notch2 (green), actin microfilaments using phalloidin (red) and nuclei (blue) in Huh7 and Huh7 + PI3Kδ organoids treated or not with the Src inhibitor herbimycin A at 100 nM during 6 days of 3D culture. Scale bar: 10 µm. Quantification of the relative intensities (below). Each dot of the graph corresponds to an organoid. i Immunofluorescence staining for Notch2 or Src (green), actin microfilaments using phalloidin (red) and nuclei (blue) in Huh7 and Huh7 + PI3Kδ organoids treated or not with 2 µM of the TGFβ inhibitor SB431542 during 6 days of 3D culture. Scale bar: 10 µm. Quantification of the relative intensities (below). Each dot of the graph corresponds to an organoid. j Proposed PI3Kδ dependant pathway for rosette-like structure formation in Huh7 expressing PI3Kδ. All values are expressed as mean ± S.E.M.
Fig. 4
Fig. 4. PI3Kδ overexpression in mouse liver induces histological changes and increase of stem cells markers.
a Representative images of H&E staining of liver sections from mice injected with pAAV8-TBG-EGFP (AAV-control) (n = 4 mice) and with pAAV8- TGB- PI3Kδ (AAV-PI3Kδ) (n = 4 mice) allowing a visualization of liver architecture (portal vein (PV) and central vein (CV)) and ductular structure around the portal vein (PV). Scale bar: 50 µm. Right: Representative images of immunohistochemistry staining of PI3Kδ on AAV-control and AAV- PI3Kδ liver around the PV and CV structure. Colored images using case Viewer were presented at the right of each panel. Scale bar: 50 µm. b Bar graphs representing the percentage of portal vein (PV) with >3 small ductular structures. Bar graphs representing PI3Kδ global staining intensity and PI3Kδ staining intensity in PV and CV per 1000 µm2 (n = 20 for each mice). c RT-qPCR analysis of several markers expression indicated in the figure from AAV-PI3Kδ and AAV-control mice (duplicate measurement of n = 4 mice per condition). Data are presented as log10 mRNA fold change in AAV-PI3Kδ compared to AAV-control. d Liver signature of gene sets enriched in AAV-PI3Kδ. e Gene set enrichment analysis of upregulated genes in AAV-PI3Kδ. All values are expressed as mean ± S.E.M.
Fig. 5
Fig. 5. PI3Kδ activity discriminates EMT from stemness acquisition based on different TGFβ signaling.
a Immunofluorescence staining for ZO-1 (green), actin microfilaments using phalloidin (red) and nuclei (blue) of 3D culture in organoids of Huh7 treated or not with PI3Kδ specific inhibitor idelalisib (CAL-101) at different concentrations after 6 days of 3D and quantification of the canaliculus and inverted polarity phenotype percentage in the different conditions (n > 49 for each condition). b RT-qPCR analysis of different genes expression performed in organoids of Huh7, Huh7+CAL-101 (5 µM) and Huh7 + siPI3Kδ after 6 days of 3D culture in two independent experiments performed in duplicate for Huh7 + 5CAL and in triplicate for HuH7 + siPI3Kδ. Data are presented as log10 mRNA fold change in Huh7+CAL-101 or Huh7 + siPI3Kδ compared to Huh7. c Immunofluorescence staining for the different markers indicated in the panel in organoids of Huh7, Huh7 + PI3Kδ, Huh7+CAL-101 (5 µM) and Huh7 + siPI3Kδ. Scale bar: 10 µm. The right panels present E-cadherin (green) and actin microfilaments using phalloidin (red) line profile blots of the white lines. d Quantification of relative intensity of these markers. Each dot of the graph corresponds to an organoid. e RT-qPCR analysis of different genes expression performed in organoids of HuH7, Huh7 + PI3Kδ, Huh7+CAL-101 (5 µM) and Huh7 + siPI3Kδ after 6 days of 3D culture in two independent experiments performed in duplicate. f Smad3 transcriptional activity, measured using CAGA-luciferase reporter, in HuH7, Huh7+ CAL-101 (5 µM) and Huh7 + PI3Kδ treated with TGFβ (2 ng/ml) and Huh7 treated with TGFβ and SB431542 (2 µM). Data represent a typical experiment performed in triplicate. g Schematic representation of the PI3Kδ-dependant plasticity with the EMT and stemness routes. All values are expressed as mean ± S.E.M.
Fig. 6
Fig. 6. Inhibition of PI3Kδ activity improves canaliculus formation and differentiation in HepG2, Hep3B and HepaRG cells associated with the regulation of EMT and stemness markers.
a Immunoblot analysis of PI3Kδ protein level in Huh7, HepG2, Hep3B and HepaRG with the quantification of its relative intensity (right, n = 3 experiments). b RT-qPCR analysis of PI3Kδ expression in Huh7, HepG2, Hep3B and HepaRG cells; RPLP0 was used as the housekeeping gene for normalization. c Immunofluorescence staining for ZO-1 (green), actin microfilaments using phalloidin (red) and nuclei (blue) in HepG2, Hep3B and HepaRG cells plated in 3D cultures for 6 days and treated with the PI3Kδ specific inhibitor (CAL-101) at different doses. Scale bar: 10 µm d Quantification of the percentage of the different phenotypes seen in the conditions above (n = 40 organoids). e RT-qPCR analysis of several markers expression in HepG2, Hep3B and HepaRG cells plated in 3D culture and treated with different doses of CAL-101 for 6 days in two independent experiments performed in duplicate; RPLP0 was used as the housekeeping gene for normalization. All values are expressed as mean ± S.E.M.
Fig. 7
Fig. 7. The inhibition of PI3Kδ activity increases albumin protein level in different hepatic cell lines.
a Immunofluorescence staining for Albumin (green), actin microfilaments using phalloidin (red) and nuclei (blue) in HepG2, Hep3B and HepaRG cells plated in 3D cultures for 6 days and treated or not with the PI3Kδ specific inhibitor (CAL-101) at different doses. Scale bar: 10 µm. b Quantification of albumin relative intensity in the different cell lines treated or not with CAL-101 at different doses. c Experiment plan for HepaRG differentiation using DMSO or CAL-101. d Immunofluorescence staining for Albumin (green), actin microfilaments using phalloidin (red) and nuclei (blue) in HepaRG cells treated with DMSO or CAL-101 at different doses after 7 days of treatment. Scale bar: 100 µm. Quantification of albumin relative intensity in HepaRG within the different conditions above. e Proposed PI3Kδ dependant pathway discriminating EMT from stemness. All values are expressed as mean ± S.E.M.

Similar articles

Cited by

References

    1. Fruman DA, et al. The PI3K pathway in human disease. Cell. 2017;170:605–635. doi: 10.1016/j.cell.2017.07.029. - DOI - PMC - PubMed
    1. Bilanges B, Posor Y, Vanhaesebroeck B. PI3K isoforms in cell signalling and vesicle trafficking. Nat. Rev. Mol. Cell Biol. 2019;20:515–534. doi: 10.1038/s41580-019-0129-z. - DOI - PubMed
    1. Guillermet-Guibert J, et al. The p110beta isoform of phosphoinositide 3-kinase signals downstream of G protein-coupled receptors and is functionally redundant with p110gamma. Proc. Natl Acad. Sci. USA. 2008;105:8292–8297. doi: 10.1073/pnas.0707761105. - DOI - PMC - PubMed
    1. Chantry D, et al. p110delta, a novel phosphatidylinositol 3-kinase catalytic subunit that associates with p85 and is expressed predominantly in leukocytes. J. Biol. Chem. 1997;272:19236–19241. doi: 10.1074/jbc.272.31.19236. - DOI - PubMed
    1. Furman RR, et al. Idelalisib and rituximab in relapsed chronic lymphocytic leukemia. N. Engl. J. Med. 2014;370:997–1007. doi: 10.1056/NEJMoa1315226. - DOI - PMC - PubMed

Publication types

MeSH terms

Substances