. 2022 Jul;4(7):901-917.
doi: 10.1038/s42255-022-00602-z. Epub 2022 Jul 25.

Prolonged breastfeeding protects from obesity by hypothalamic action of hepatic FGF21

Affiliations

Prolonged breastfeeding protects from obesity by hypothalamic action of hepatic FGF21

Veronica Pena-Leon et al. Nat Metab. 2022 Jul.

Abstract

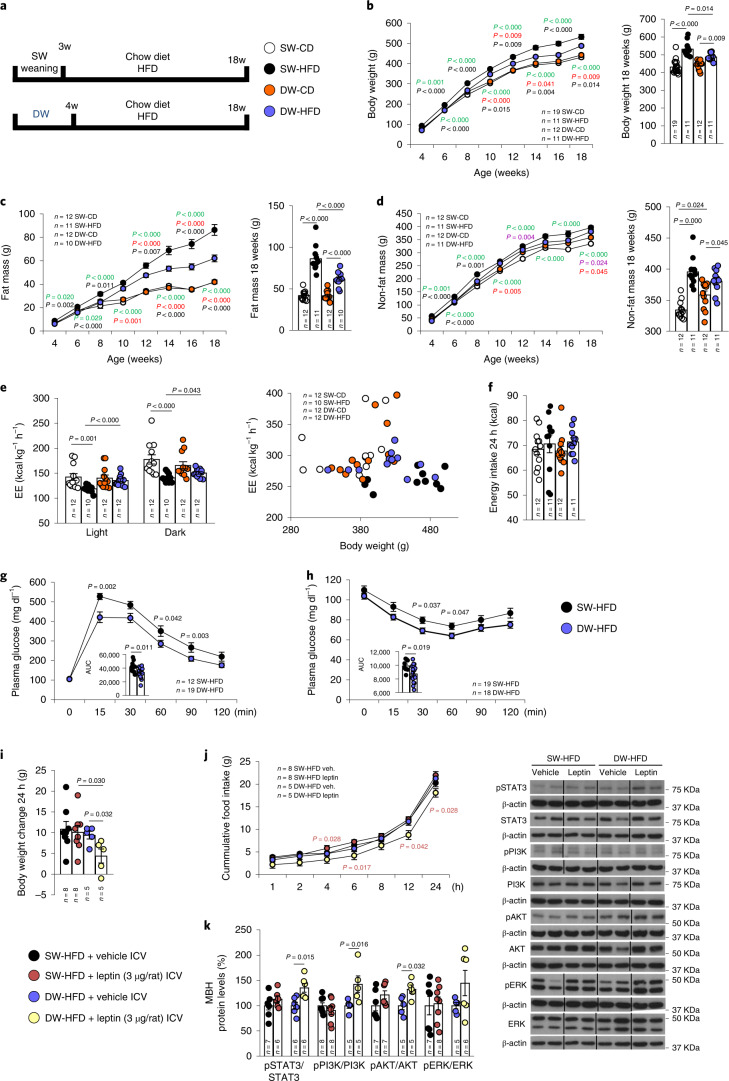
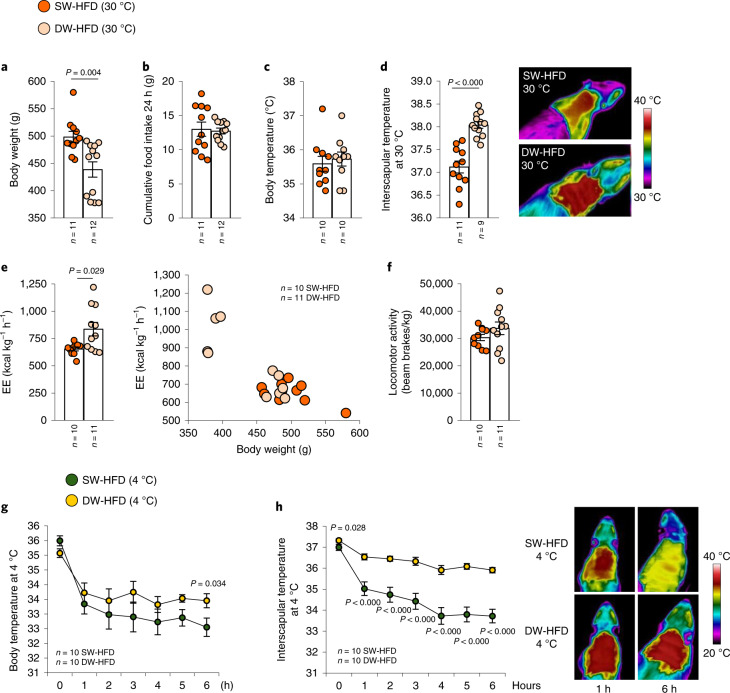
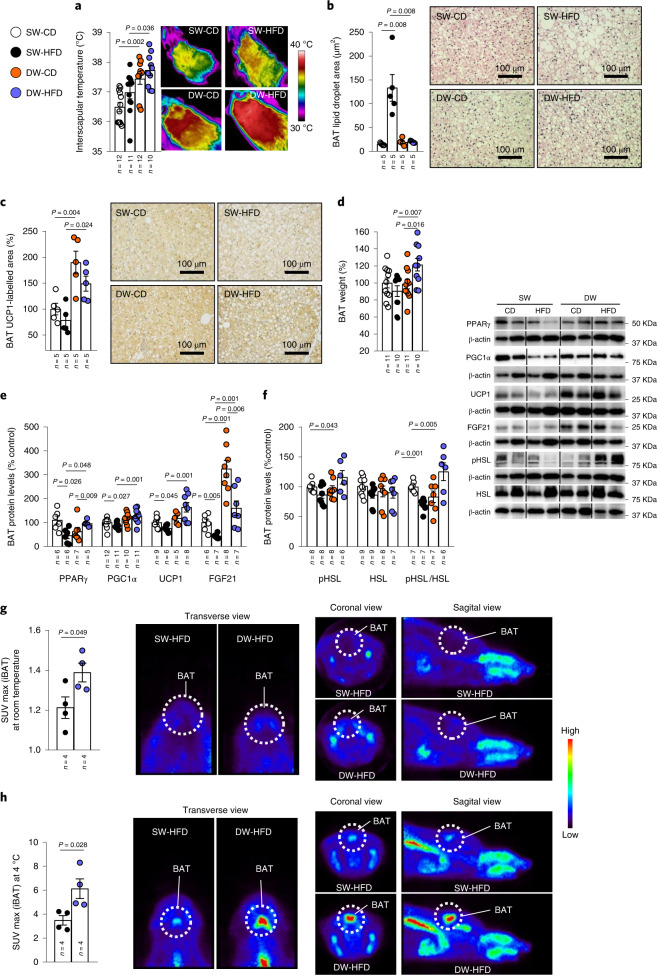
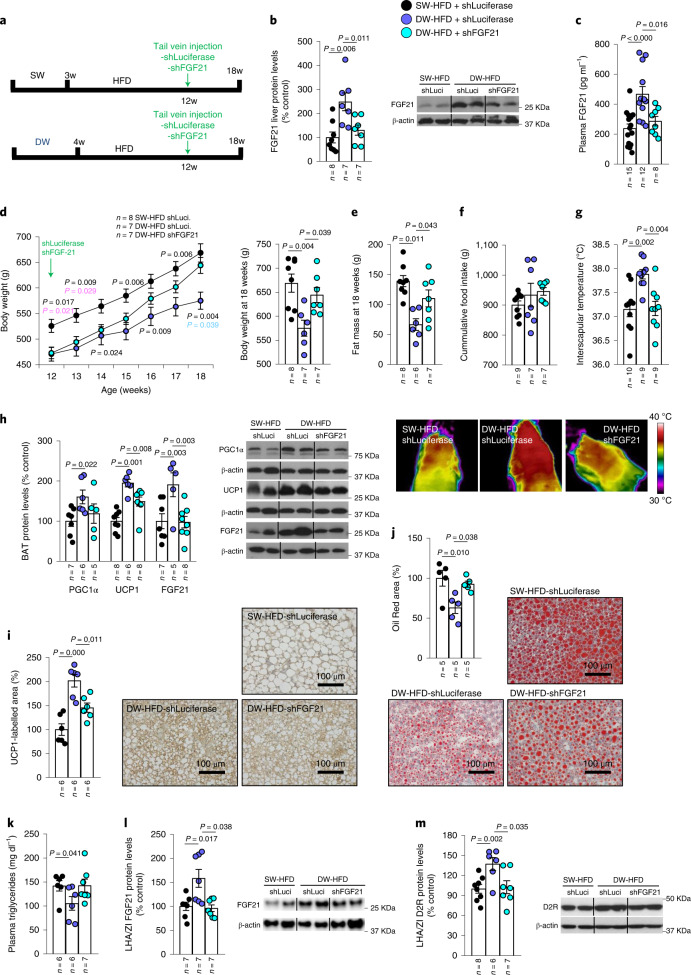
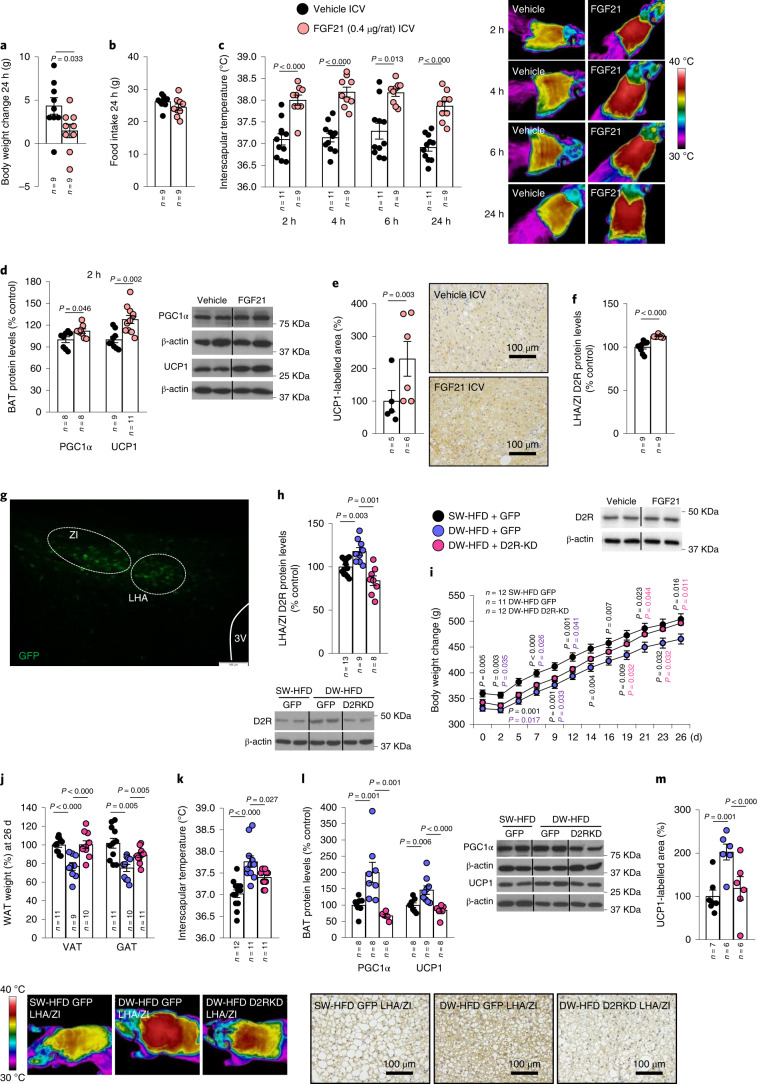
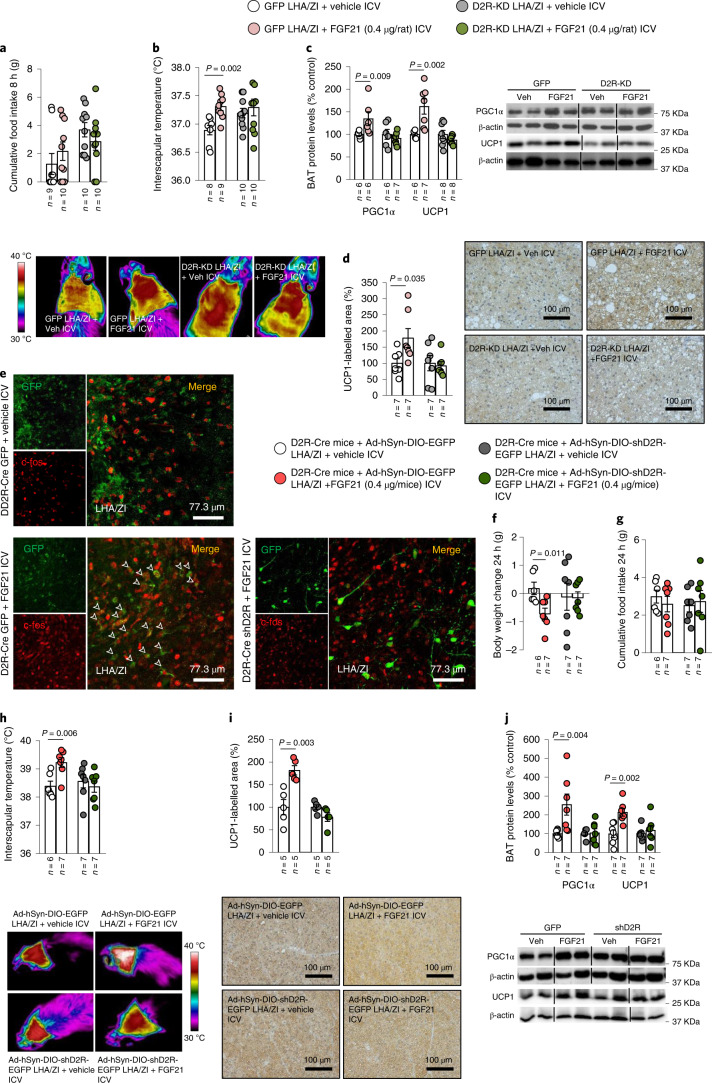
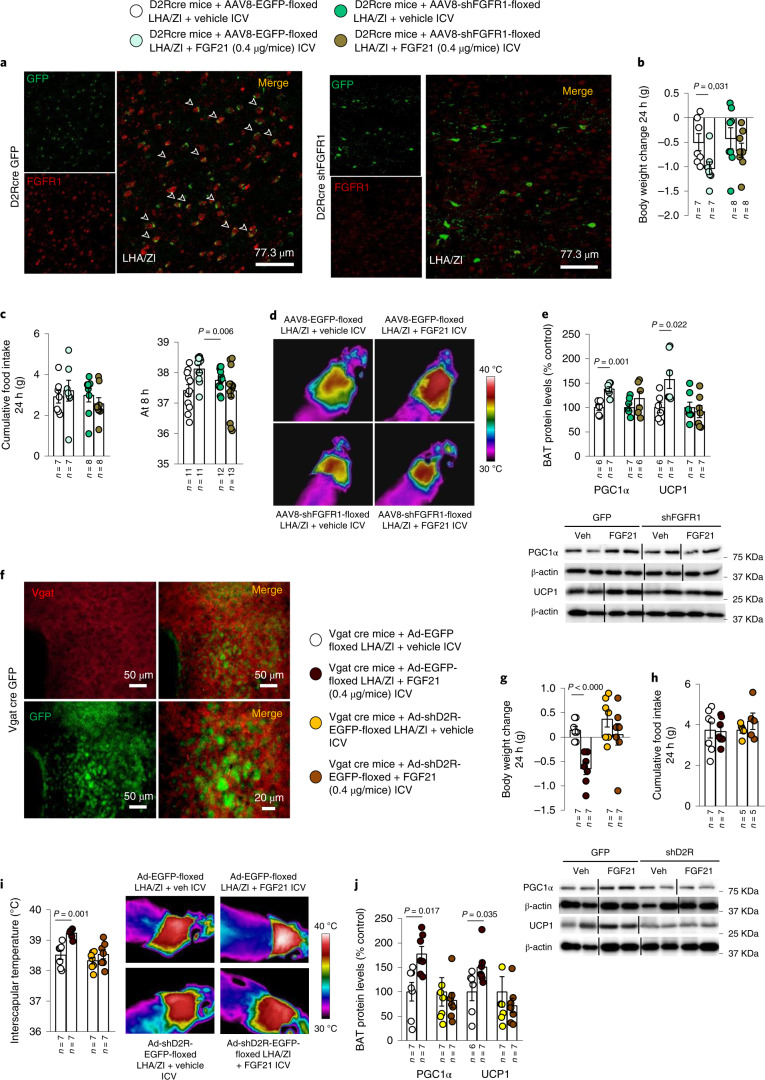
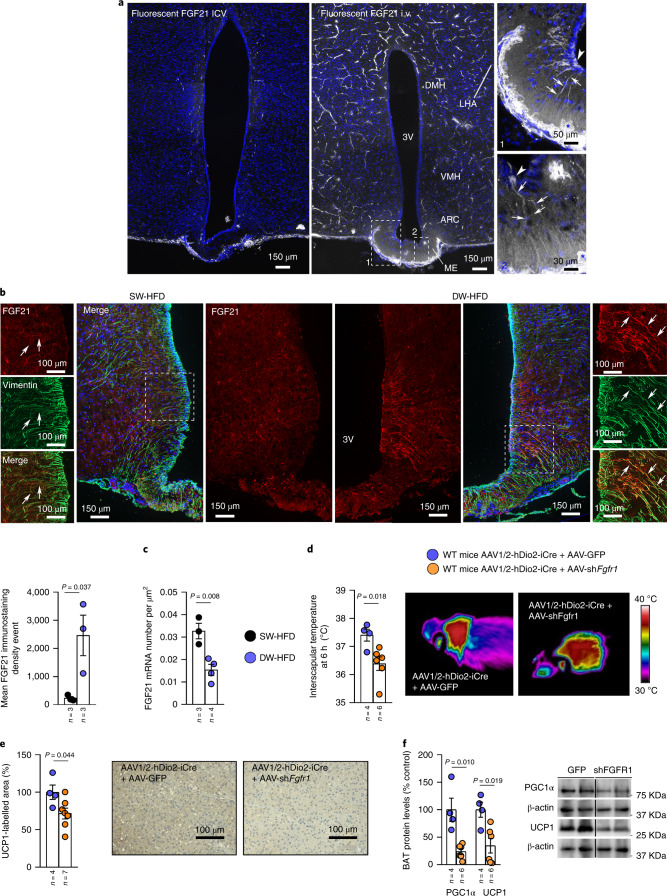
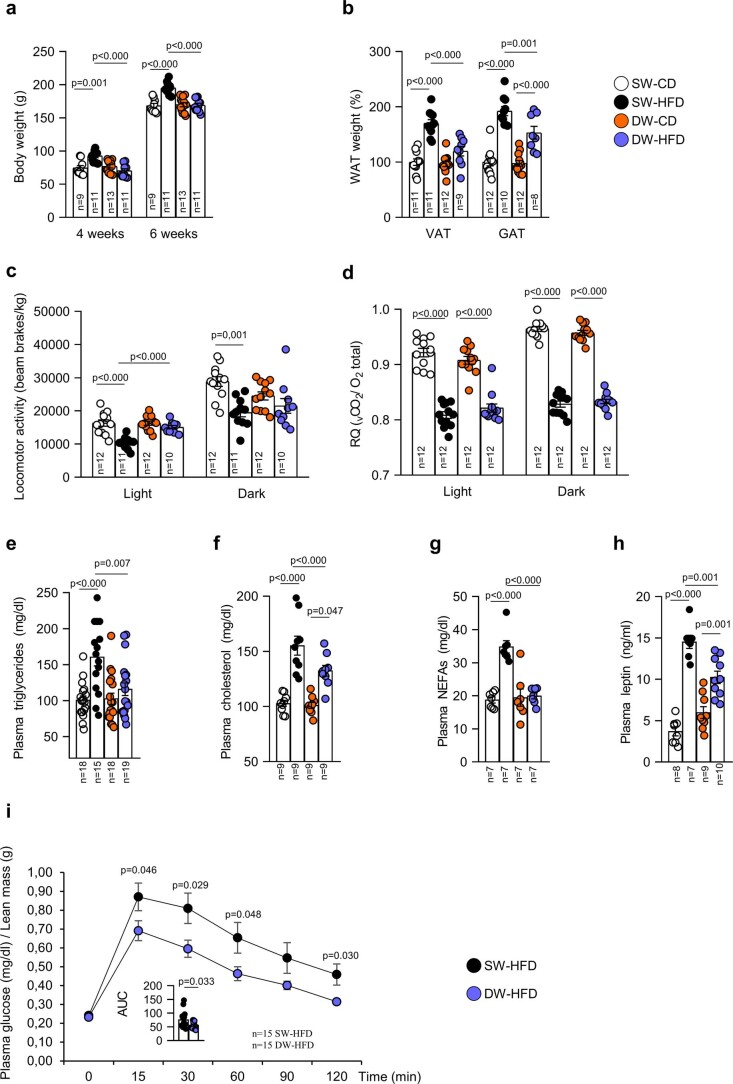
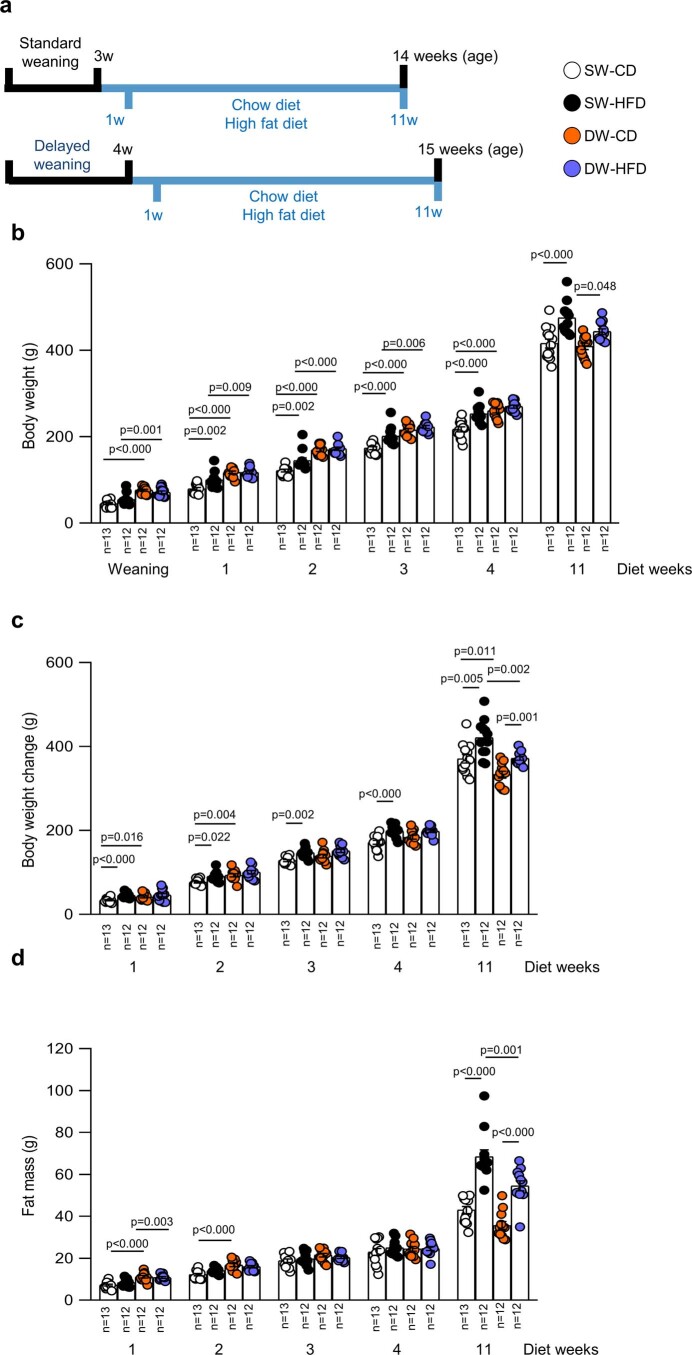
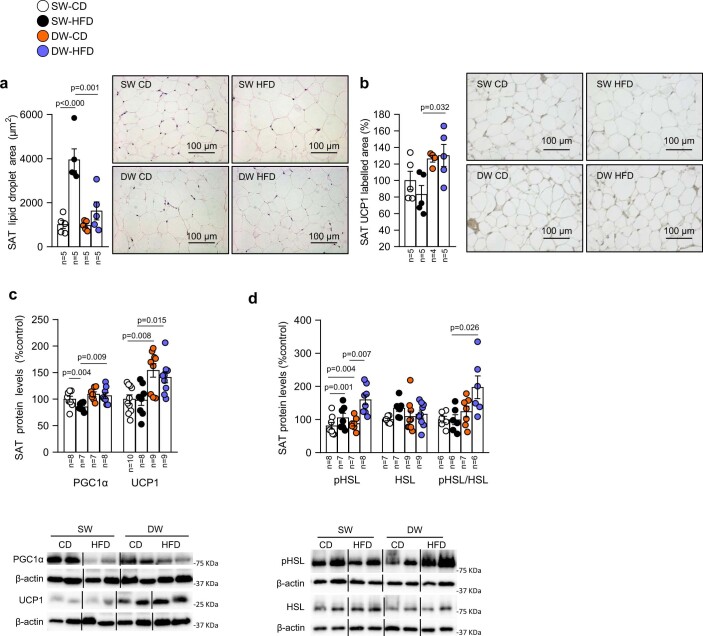
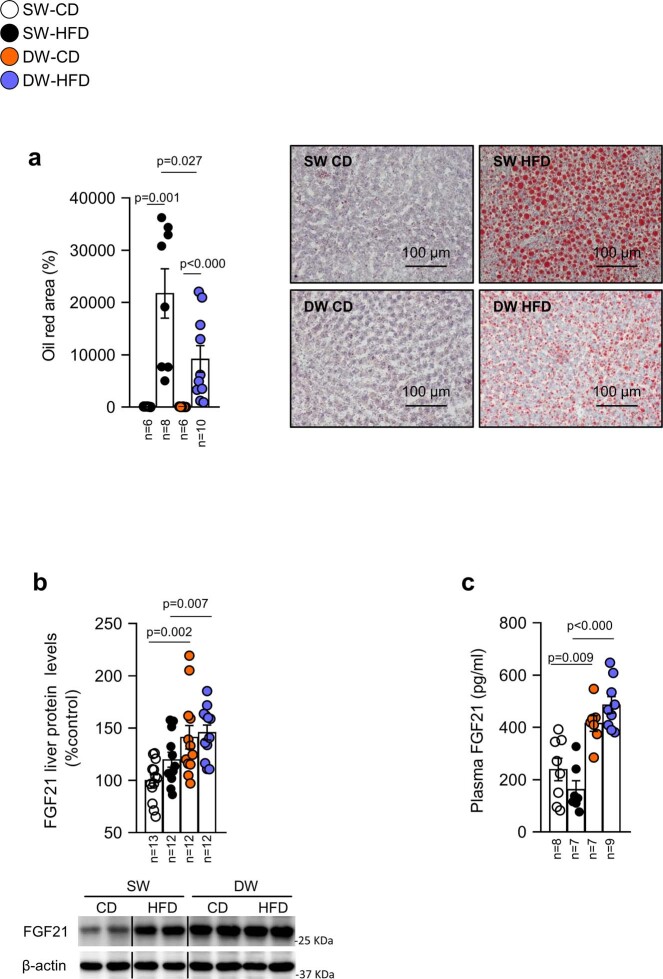
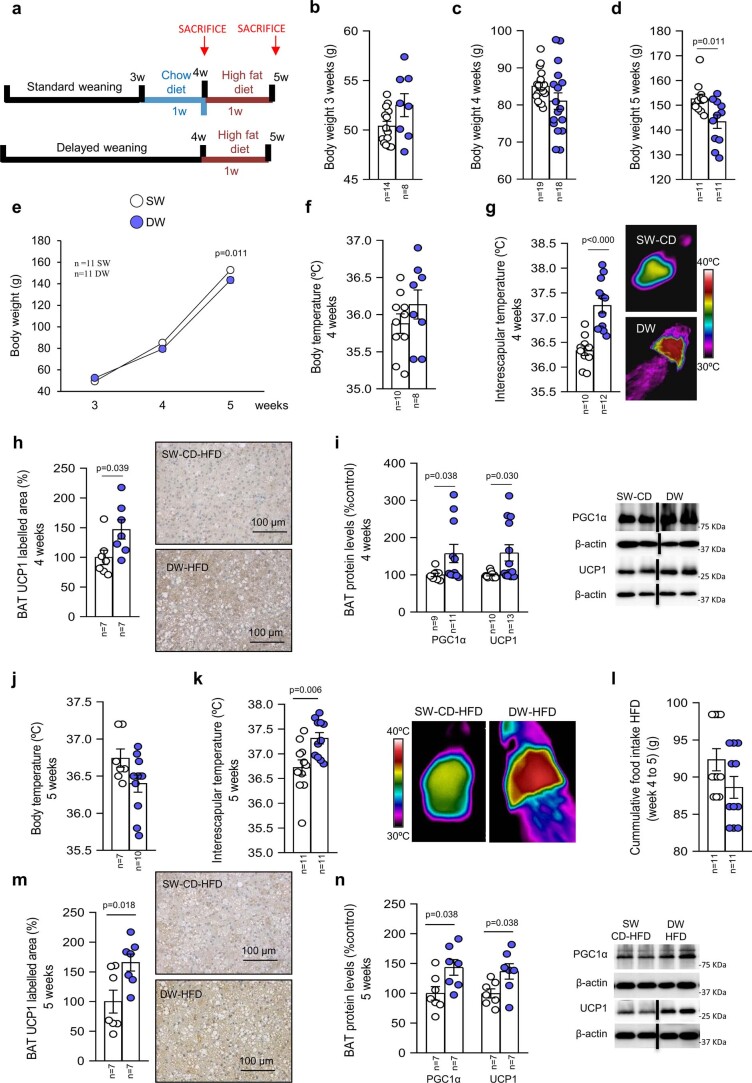
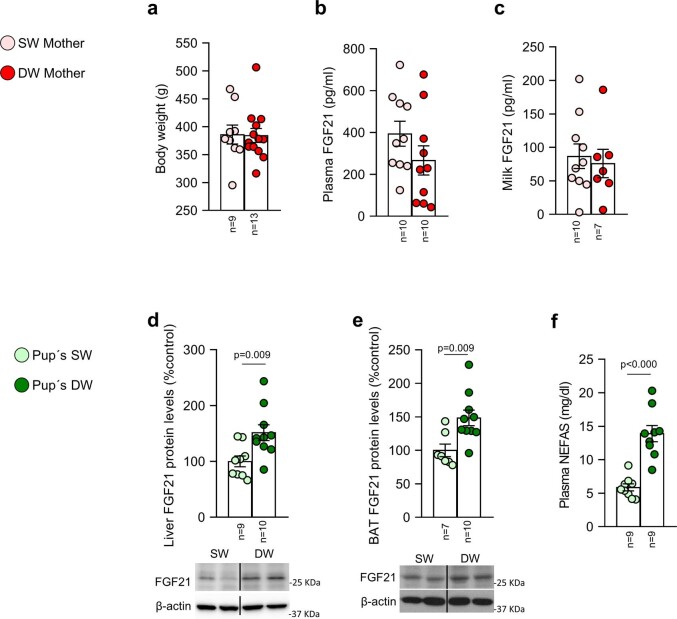
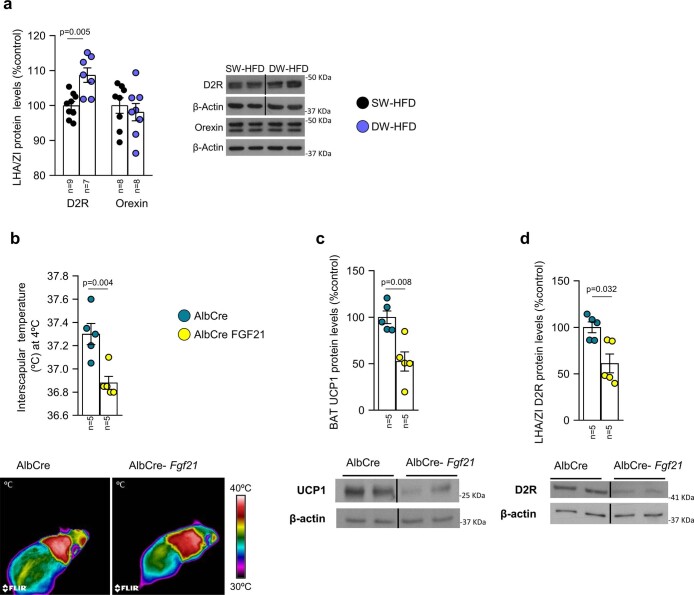
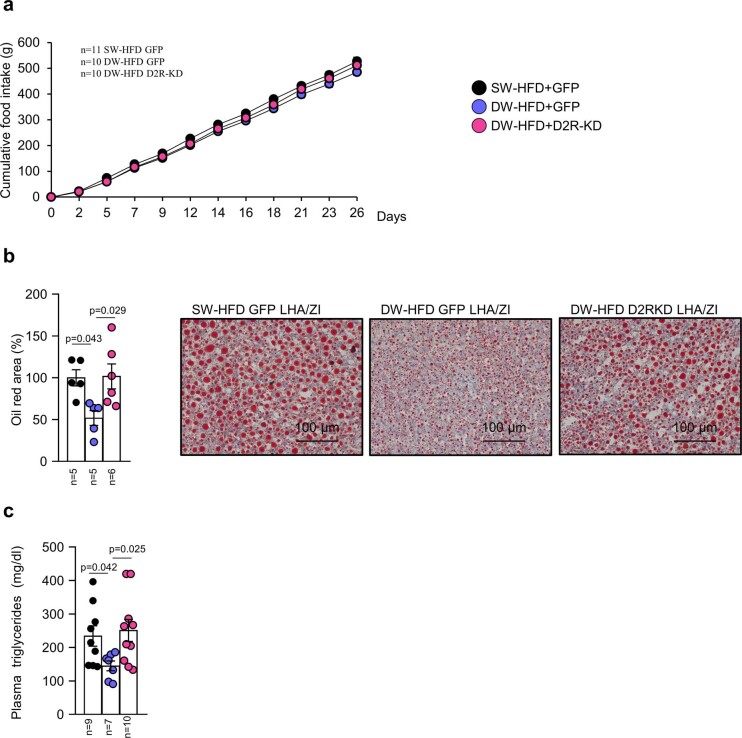
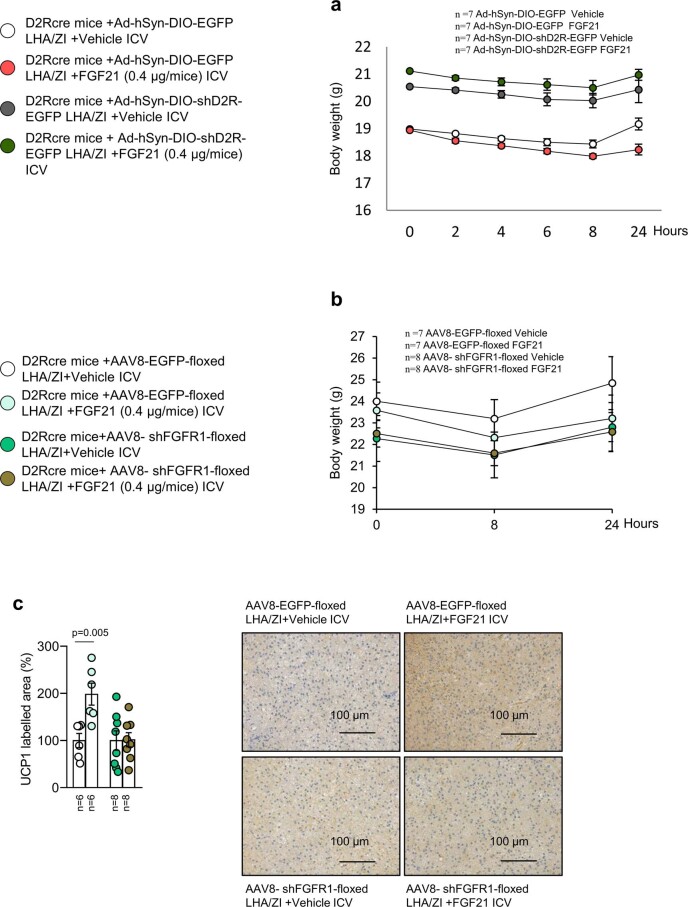
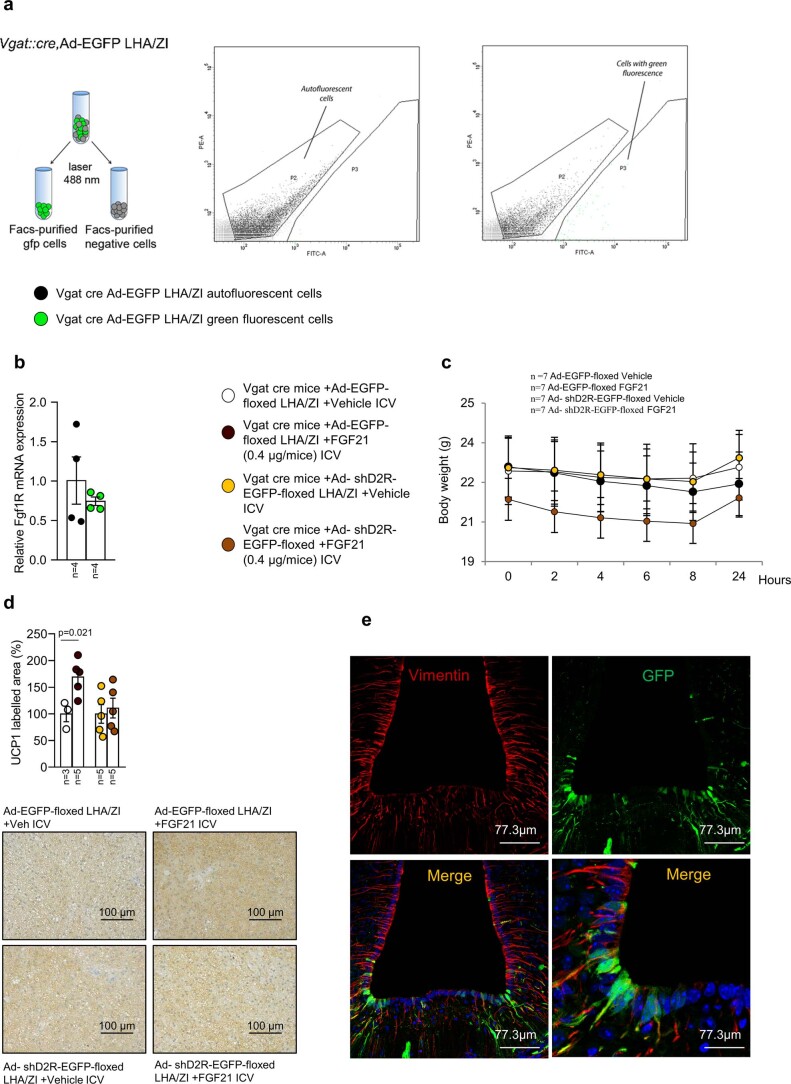
Early-life determinants are thought to be a major factor in the rapid increase of obesity. However, while maternal nutrition has been extensively studied, the effects of breastfeeding by the infant on the reprogramming of energy balance in childhood and throughout adulthood remain largely unknown. Here we show that delayed weaning in rat pups protects them against diet-induced obesity in adulthood, through enhanced brown adipose tissue thermogenesis and energy expenditure. In-depth metabolic phenotyping in this rat model as well as in transgenic mice reveals that the effects of prolonged suckling are mediated by increased hepatic fibroblast growth factor 21 (FGF21) production and tanycyte-controlled access to the hypothalamus in adulthood. Specifically, FGF21 activates GABA-containing neurons expressing dopamine receptor 2 in the lateral hypothalamic area and zona incerta. Prolonged breastfeeding thus constitutes a protective mechanism against obesity by affecting long-lasting physiological changes in liver-to-hypothalamus communication and hypothalamic metabolic regulation.


Conflict of interest statement

The authors declare no competing interests.

Figures

Fig. 1
Fig. 1. Prolonged suckling (delayed weaning) decreases body weight and fat mass while increasing energy expenditure, with no change of food intake in rats.
a, Timeline of the experimental protocol. bh, Effects of delayed weaning on body weight (b); fat mass (c); non-fat mass (d); energy expenditure (EE) in light and dark phases and as a function of body weight (e); energy intake over 24 h (f); glucose tolerance (g); and insulin response (h). ik, In rats fed an HFD, effect of delayed weaning on response to ICV administration of leptin (3 μg per rat) in terms of body weight change (i), cumulative food intake (j) and MBH protein levels of pSTAT3, STAT3, pPI3K, PI3K, pAKT, AKT, pERK and ERK (k). Protein data were expressed as percentages in relation to control (SW-HFD vehicle) animals. β-actin was used to normalize protein levels. Dividing lines indicate splicing within the same gel. Values are represented as means ± s.e.m., n per group. Exact P values are shown. Statistical differences between groups are indicated by the following colours: black, SW-HFD versus DW-HFD; green, SW-CD versus SW-HFD; violet, SW-CD versus DW-CD; red, DW-CD versus DW-HFD. Statistical differences were determined by one-way analysis of variance (ANOVA; normal data and homogeneity of variances) followed by Tukey’s post hoc multiple-comparison test (bd, f and j) or a two-sided Student’s t-test (normal data; g and h), a two-sided Mann–Whitney U test (non-normal data and non-homogeneous variance; e, i and k), or an analysis of covariance (ANCOVA) with body weight as a covariate (e). AUC, area under the curve. Source data
Fig. 2
Fig. 2. Prolonged suckling (delay weaning) increases interscapular temperature in both thermoneutral and cold exposureconditions.
af, Delayed-weaning effects in rats fed an HFD under thermoneutral conditions on body weight (a); cumulative food intake (b); body temperature (c); infrared thermal images and quantification of BAT interscapular temperature (d); energy expenditure (e) and locomotor activity (f). g,h, Delayed-weaning effects in rats fed an HFD and exposed to cold (4 °C) for 6 h on body temperature (g) and infrared thermal images and quantification of BAT interscapular temperature at 4 °C (h). Values are represented as means ± s.e.m., n per group. Exact P values are shown. Statistical differences were determined by a two-sided Student’s t-test (normal data; ch), a two-sided Mann–Whitney U test (non-normal data and non-homogeneous variance; a and b), or an ANCOVA with body weight as a covariate (e). Source data
Fig. 3
Fig. 3. Prolonged suckling activates BAT thermogenesis and browning of WAT.
ah, Effects of delayed weaning shown on infrared thermal images and quantification of BAT interscapular (iBAT) temperature (n = 10–12; a); quantification of lipid droplet cross-sectional area in BAT (n = 5; b); quantification of immunolabelling for UCP1 in BAT (n = 5; c); BAT weight (n = 10–11; d); BAT protein levels of PPARγ, PGC1α, UCP1 and FGF21 (n = 5–12; e) and pHSL, HSL and pHSL/HSL (n = 6–9; f); 18F-FDG uptake analysis (standardized uptake value (SUV max)) of rats at room temperature (n = 4; g); and 18F-FDG uptake analysis of rats at 4 °C (n = 4; h). Protein data were expressed as percentages in relation to control (SW-CD) animals. β-actin was used to normalize protein levels. Dividing lines indicate splicing within the same gel. Values are represented as means ± s.e.m., n per group indicated in each figure. Exact P values are shown. Statistical differences were determined by one-way ANOVA (normal data and homogeneity of variances) followed by Tukey’s post hoc multiple-comparison test (a and c) or a two-sided Student’s t-test (normal data; g and h) or a two-sided Mann–Whitney U test (non-normal data and non-homogeneous variance; b and df). Source data
Fig. 4
Fig. 4. Knockdown of Fgf21 in the liver blunts delayed-weaning-induced weight loss.
a, Timeline of the experimental protocol. bm, Effect of infection with adenoviral particles encoding shFgf21 in the tail vein of 12-week-old rats fed an HFD after prolonged suckling on liver protein levels of FGF21 (b); plasma FGF21 levels (c); body weight (d); fat mass (e); cumulative food intake (f); infrared thermal images and quantification of BAT interscapular temperature (g); BAT protein levels of PGC1α, UCP1 and FGF21 (h); quantification of immunolabelling for UCP1 in BAT (i); Oil Red area in the liver (j); plasma triglycerides (k); LHA/ZI protein levels of FGF21 (l); and LHA/ZI protein levels of D2R (m). Protein data were expressed as percentages in relation to control (SW-HFD shLuciferase) animals. β-actin was used to normalize protein levels. Dividing lines indicate splicing within the same gel. Values are represented as means ± s.e.m., n per group. Exact P values are shown. Statistical differences were determined by one-way ANOVA (normal data and homogeneity of variances) followed by Tukey’s post hoc multiple-comparison test (ce, g and ik) or a two-sided Mann–Whitney U test (non-normal data and non-homogeneous variance; b, f, h, l and m). Source data
Fig. 5
Fig. 5. FGF21 decreases body weight by increasing thermogenesis in BAT and D2R expression in LHA/ZI, while knockdown of D2R in the LHA/ZI blunts delayed-weaning-induced weight loss.
af, Effect of ICV injection of FGF21 (0.4 µg per rat) in male rats fed a CD on body weight change at 24 h (a); food intake at 24 h (b); infrared thermal images and quantification of BAT interscapular temperature at 2, 4, 6 and 24 h (c); BAT protein levels of PGC1α and UCP1 (d); quantification of immunolabelling for UCP1 in BAT (e) and LHA/ZI protein levels of D2R (f). g, Representative photomicrograph of a brain section showing GFP expression following injection of viral vectors that encode GFP expression precisely into the LHA/ZI; scale bar, 0.1 mm. hm, Effect of injecting adenoviral particles encoding GFP or shD2R (leading to D2R knockdown; KD) into the LHA/ZI of rats fed an HFD following prolonged suckling on LHA/ZI protein levels of D2R (h); body weight change (i); WAT weight in terms of weight of VAT and GAT (j); infrared thermal images and quantification of BAT interscapular temperature (k); BAT protein levels of PGC1α and UCP1 (l); and quantification of immunolabelling for UCP1 in BAT (m). Protein data were expressed as percentages in relation to control (vehicle) animals. β-actin was used to normalize protein levels. Dividing lines indicate splicing within the same gel. Values are represented as means ± s.e.m., n per group. Exact P values are shown. Statistical differences were determined by one-way ANOVA (normal data and homogeneity of variances) followed by Tukey’s post hoc multiple-comparison test (i and k) or to a two-sided Student’s t-test (normal data; ac), a two-sided Mann–Whitney U test (non-normal data and non-homogeneous variance; df, h, j, l and m). Source data
Fig. 6
Fig. 6. The effects of FGF21 on body weight and BAT thermogenesis are dependent on D2R in the LHA/ZI.
ad, Effect of injecting adenoviral particles encoding GFP or shD2r (D2R-KD) into the LHA/ZI of rats fed a CD and treated with ICV FGF21 on cumulative food intake (a); infrared thermal images and quantification of BAT interscapular temperature (b); BAT protein levels of PGC1α and UCP1 (c); and quantification of immunolabelling for UCP1 in BAT (d). e, Photomicrographs showing the colocalization of GFP and c-Fos in the LHA/ZI of D2r-cre GFP mice treated with ICV FGF21, or shD2R + FGF21 ICV, demonstrating lack of c-Fos activation in LHA/ZI D2r neurons following D2r knockdown. fj, Effect of injecting an adenoviral vector encoding a scrambled RNA (Ad-hSyn-DIO-EGFP) or an shRNA against D2r (Ad-hSyn-DIO-shD2r-EGFP) in a Cre-dependent manner followed by ICV injection of vehicle or FGF21 into D2r-Cre mice on body weight change (f); cumulative food intake (g); infrared thermal images and quantification of BAT interscapular temperature (h); quantification of immunolabelling for UCP1 in BAT (i); and BAT protein levels of PGC1α and UCP1 (j). Protein data were expressed as percentages in relation to control (GFP vehicle) animals. β-actin was used to normalize protein levels. Dividing lines indicate splicing within the same gel. Values are represented as means ± s.e.m., n per group. Exact P values are shown. Statistical differences were determined by a two-sided Student’s t-test (normal data; a, d and fi) or a two-sided Mann–Whitney U test (non-normal data and non-homogeneous variance; b, c and j). Source data
Fig. 7
Fig. 7. D2R signalling in LHA/ZI GABA neurons is required for FGF21 action.
a, Photomicrographs showing the colocalization of GFP and FGFR1 in the LHA/ZI of D2r-Cre mice. be, Effect of injecting an adenoviral vector encoding a scrambled RNA (AAV-EF1A-EGFP-floxed) or an shRNA against Fgfr1 (AAV8-EGFP-shFgfr1-floxed) in a Cre-dependent manner, followed by ICV injection of vehicle or FGF21 in D2r-Cre mice on body weight change (b); cumulative food intake at 24 h and 8 h (c); infrared thermal images and quantification of BAT interscapular temperature (n = 11–13; d); and BAT protein levels of PGC1α and UCP1 (e). f, Photomicrographs showing the colocalization of GFP and Vgat in the LHA/ZI of D2r-Cre mice. gj, Effect of injecting an adenoviral vector encoding a scrambled RNA (Ad-hSyn-DIO-EGFP) or an shRNA against D2r (Ad-hSyn-DIO-shD2r-EGFP) in a Cre-dependent manner, followed by ICV injection of vehicle or FGF21 in Vgat-ires-Cre mice on body weight change (g), cumulative food intake (h); infrared thermal images and quantification of BAT interscapular temperature (i); and BAT protein levels of PGC1α and UCP1 (j). Protein data were expressed as percentages in relation to control (GFP vehicle) animals. β-actin was used to normalize protein levels. Dividing lines indicate splicing within the same gel. Values are represented as means ± s.e.m., n per group. Exact P values are shown. Statistical differences were determined by a two-sided Student’s t-test (normal data; bd, g and h), or a two-sided Mann–Whitney U test (non-normal data and non-homogeneous variance; e, i and j). Source data
Fig. 8
Fig. 8. Tanycytic FGFR1 is required for the transport of FGF21 to the hypothalamus.
a, Representative photomicrographs of the tuberal region of the hypothalamus of a wild-type mouse showing tanycytic processes (arrows) and cell bodies (arrowheads) labelled by fluorescent FGF21 in the median eminence (inset), 1 min after injection into the jugular vein or after the ICV injection. b,c, Immunoreactivity of FGF21 is increased in tanycytes of SW-HFD and DW-HFD rats (n = 3; b); mRNA expression of FGF21 in SW-HFD and DW-HFD rats (n = 3; c). df, Effect of injecting an AAV1/2 into the lateral ventricle expressing Cre recombinase under transcriptional control of the hDio2 promoter (AAV1/2-hDio2-iCre) together with an AAV-GFP-floxed or an shRNA against Fgfr1 (AAV-GFP-shFgfr1-floxed) in wild-type (WT) mice on infrared thermal images and quantification of BAT interscapular temperature (n = 4–6; d); quantification of immunolabelling for UCP1 in BAT (n = 4–6; e); BAT protein levels of PGC1α and UCP1 (n = 4–6; f). Protein data were expressed as percentages in relation to control (GFP) animals. β-actin was used to normalize protein levels. Dividing lines indicate splicing within the same gel. Values are represented as means ± s.e.m., n per group. Exact P values are shown. Statistical differences were determined by a two-sided Student’s t-test (normal data; be), or a two-sided Mann–Whitney U test (non-normal data and non-homogeneous variance; f). Source data
Extended Data Fig. 1
Extended Data Fig. 1. Prolonged breastfeeding decreases fat mass and improves dyslipidemia.
ah, Delayed weaning effects on body weight (a), white adipose tissue (WAT) weight in terms of the weight of Visceral Adipose Tissue (VAT) and Gonadal Adipose Tissue (GAT) (n = 8–12) (b); locomotor activity (c); respiratory quotient (RQ) (d); circulating levels of triglycerides (e), cholesterol (f), non-esterified fatty acids (NEFAs) (g), and leptin (h). i, Delayed weaning effects on glucose tolerance normalized with lean mass. Values are represented as means ± SEM, n per group indicated in each figure. Exact P values are shown. Statistical differences according to a One-way analysis of variance ANOVA (normal data and homogeneity of variances) followed by Tukey’s post hoc multiple comparison test (a, b, c, d, g and h) or to a two-sided Student’s t-test (normal data) (i), a two-sided Mann-Whitney U-test (non-normal data and non-homogeneous variance) (e and f). Source data
Extended Data Fig. 2
Extended Data Fig. 2. Prolonged breastfeeding protects against diet-induced obesity at early stages.
Prolonged suckling (delayed weaning) decreases body weight and fat mass in rats accordingly to the weeks of exposition to high fat diet (HFD) instead of weeks of age. a, Timeline of the experimental protocol. bd, Effects of delayed weaning on body weight (b), body weight changes (c) and fat mass (d). Values are represented as means ± SEM, n per group indicated in each figure. Exact P values are shown. Statistical differences according to a One-way analysis of variance ANOVA (normal data and homogeneity of variances) followed by Tukey’s post hoc multiple comparison test (b, c and d). Source data
Extended Data Fig. 3
Extended Data Fig. 3. Prolonged breastfeeding reduces lipid droplets and increases UCP1 in adipose tissue.
Prolonged suckling activates browning of WAT. ad, Effects of delayed weaning on quantification of lipid droplet cross-sectional area in SAT (a); quantification of immunolabeling for UCP1 in SAT (b); SAT protein levels of PGC1α and UCP1 (c); SAT protein levels of pHSL, HSL and ratio pHSL/HSL (d). Protein data were expressed in relation (%) to control (SW-CD) animals. β-actin was used to normalize protein levels. Dividing lines indicate splicing within the same gel. Values are represented as means ± SEM, n per group indicated in each figure. Exact P values are shown. Statistical differences according to a One-way analysis of variance ANOVA (normal data and homogeneity of variances) followed by Tukey’s post hoc multiple comparison test (a and b) or to a two-sided Mann-Whitney U-test (non-normal data and non-homogeneous variance) (c and d). Source data
Extended Data Fig. 4
Extended Data Fig. 4. Prolonged breastfeeding reduces liver steatosis and stimulates FGF21 levels.
Prolonged suckling alleviates HFD-induced steatosis. ac, Effects of delayed weaning on oil red area in the liver (a); liver protein levels of FGF21 (b); plasma FGF21 levels (c). Protein data were expressed in relation (%) to control (SW-CD) animals. β-actin was used to normalize protein levels. Dividing lines indicate splicing within the same gel. Values are represented as means ± SEM, n per group indicated in each figure. Exact P values are shown. Statistical differences according to a One-way analysis of variance ANOVA (normal data and homogeneity of variances) followed by Tukey’s post hoc multiple comparison test (c) or to a two-sided Mann-Whitney U-test (non-normal data and non-homogeneous variance) (a and b). Source data
Extended Data Fig. 5
Extended Data Fig. 5. Prolonged breastfeeding activates brown fat thermogenesis after weaning.
Prolonged suckling (delayed weaning) decreases body weight while activates BAT thermogenesis in rats with only one week of HFD. a, Timeline of the experimental protocol. bn, Effects of delayed weaning on body weight at 3 weeks (b); body weight at 4 weeks (c); body weight at 5 weeks (d); body weight change (e), body temperature at 4 weeks (f), infrared thermal images and quantification of BAT interscapular temperature at 4 weeks (g); quantification of immunolabeling for UCP1 in BAT at 4 weeks (h); BAT protein levels of PGC1α and UCP1 at 4 weeks (i); body temperature at 5 weeks (j), infrared thermal images and quantification of BAT interscapular temperature at 5 weeks (k); cumulative food intake HFD between week 4 and 5 (l); quantification of immunolabeling for UCP1 in BAT at 5 weeks (m); BAT protein levels of PGC1α and UCP1 at 5 weeks (n). Protein data were expressed in relation (%) to control (SW) animals. β-actin was used to normalize protein levels. Dividing lines indicate splicing within the same gel. Values are represented as means ± SEM, n per group indicated in each figure. Exact P values are shown. Statistical differences according to a two-sided Student’s t-test (normal data) (b, d, e, f, h, j, k, l and m), a two-sided Mann-Whitney U-test (non-normal data and non-homogeneous variance) (c, g, i and n). Source data
Extended Data Fig. 6
Extended Data Fig. 6. FGF21 is increased in pups but not mothers after prolonged breastfeeding.
The different levels observed in FGF21 between SW-HFD and DW-HFD animals are not coming from the mothers. ac, Effects of delayed weaning on mother´s: body weight (a), plasma FGF21 levels (b), milk FGF21 levels. df, Effects of delayed weaning on pups: liver protein levels of FGF21 (n = 9–10) (d); BAT protein levels of FGF21 (e); plasma NEFAS (f). Protein data were expressed in relation (%) to control (SW) animals. β-actin was used to normalize protein levels. Dividing lines indicate splicing within the same gel. Values are represented as means ± SEM, n per group indicated in each figure. Exact P values are shown. Statistical differences according to a two-sided Student’s t-test (normal data) (a, b, c, d, e and f). Source data
Extended Data Fig. 7
Extended Data Fig. 7. FGF21 increases protein levels of D2R in the LHA/ZI.
a, Delayed weaning effects on LHA/ZI protein levels of D2R and Orexin levels in rats fed HFD. bd, Effect of exposure to cold in mice lacking FGF21 in the liver (Albcre) on infrared thermal images and quantification of BAT interscapular temperature (b); BAT protein levels of UCP1 (c); LHA/ZI protein levels of D2R (d). Protein data were expressed in relation (%) to control (SW) animals. β-actin was used to normalize protein levels. Dividing lines indicate splicing within the same gel. Values are represented as means ± SEM, n per group indicated in each figure. Exact P values are shown. Statistical differences according to a two-sided Student’s t-test (normal data) (b), a two-sided Mann-Whitney U-test (non-normal data and non-homogeneous variance) (a, c and d). Source data
Extended Data Fig. 8
Extended Data Fig. 8. Knockdown of D2R in the LHA/ZI reverses the effects of prolonged breastfeeding in liver.
ac, Effect of injecting adenoviral particles encoding for GFP- or D2R-KD in the LHA/ZI of rats fed HFD with prolonged breastfeeding period on cumulative food intake (a); oil red area in Liver (b); plasma triglycerides (c). Values are represented as means ± SEM, n per group indicated in each figure. Exact P values are shown. Statistical differences according to a One-way analysis of variance ANOVA (normal data and homogeneity of variances) followed by Tukey’s post hoc multiple comparison test (a, b) or to a two-sided Mann-Whitney U-test (non-normal data and non-homogeneous variance) (c). Source data
Extended Data Fig. 9
Extended Data Fig. 9. ac, FGF21 requires D2R and FGFR1 for its effects.
Effect of injecting an adenoviral vector encoding a scrambled RNA (Ad-hSyn-DIO-EGFP) or an shRNA against D2R (Ad-hSyn-DIO-shD2R-EGFP) in a Cre-dependent manner followed by ICV injection of vehicle or FGF21 into D2R-Cre mice on body weight (a), effect of injecting an adenoviral vector encoding a scrambled RNA (AAV-EF1A-EGFP-floxed) or an shRNA against FGFR1 (AAV8-EGFP-shfgfr1-floxed) in a Cre-dependent manner, followed by ICV injection of vehicle or FGF21 in D2R-Cre mice on body weight (b) and quantification of immunolabeling for UCP1 in BAT (c).Values are represented as means ± SEM, n per group indicated in each figure. Exact P values are shown. Statistical differences according to a two-sided Student’s t-test (normal data) (a, b and c). Source data
Extended Data Fig. 10
Extended Data Fig. 10. D2R signalling in LHA/ZI GABA neurons is required for FGF21 action.
a,b, Fluorescent activated cell sorting (FACS) to isolate D2R-expressing neurons (GFP-positive) in the LHA/ZI (a); FGF21 receptor (FGFR1) mRNA is expressed in isolated D2R cells from the LHA/ZI (b). c,d, Effect of injecting an adenoviral vector encoding a scrambled RNA (Ad-hSyn-DIO-EGFP) or an shRNA against D2R (Ad-hSyn-DIO-shD2r-EGFP) in a Cre-dependent manner, followed by ICV injection of vehicle or FGF21 in Vgat-ires-Cre mice on body weight (c) and quantification of immunolabeling for UCP1 in BAT (d). e, Photomicrograph showing the colocalization of Vimentin and GFP in the lateral ventricle. Source data

Comment in

References

    1. Barker DJ. The developmental origins of adult disease. Eur. J. Epidemiol. 2003;18:733–736. doi: 10.1023/A:1025388901248. - DOI - PubMed
    1. Lukaszewski MA, Eberle D, Vieau D, Breton C. Nutritional manipulations in the perinatal period program adipose tissue in offspring. Am. J. Physiol. Endocrinol. Metab. 2013;305:E1195–E1207. doi: 10.1152/ajpendo.00231.2013. - DOI - PubMed
    1. Liang X, et al. Maternal high-fat diet during lactation impairs thermogenic function of brown adipose tissue in offspring mice. Sci. Rep. 2016;6:34345. doi: 10.1038/srep34345. - DOI - PMC - PubMed
    1. Tsuduki T, Kitano Y, Honma T, Kijima R, Ikeda I. High dietary fat intake during lactation promotes development of diet-induced obesity in male offspring of mice. J. Nutr. Sci. Vitaminol. 2013;59:384–392. doi: 10.3177/jnsv.59.384. - DOI - PubMed
    1. Butruille L, et al. Maternal high-fat diet during suckling programs visceral adiposity and epigenetic regulation of adipose tissue stearoyl-CoA desaturase-1 in offspring. Int. J. Obes. 2019;43:2381–2393. doi: 10.1038/s41366-018-0310-z. - DOI - PubMed

Publication types

Substances