. 2022 Oct;18(10):1056-1064.
doi: 10.1038/s41589-022-01094-4. Epub 2022 Jul 25.

Cas13d knockdown of lung protease Ctsl prevents and treats SARS-CoV-2 infection

Affiliations

Cas13d knockdown of lung protease Ctsl prevents and treats SARS-CoV-2 infection

Zhifen Cui et al. Nat Chem Biol. 2022 Oct.

Abstract

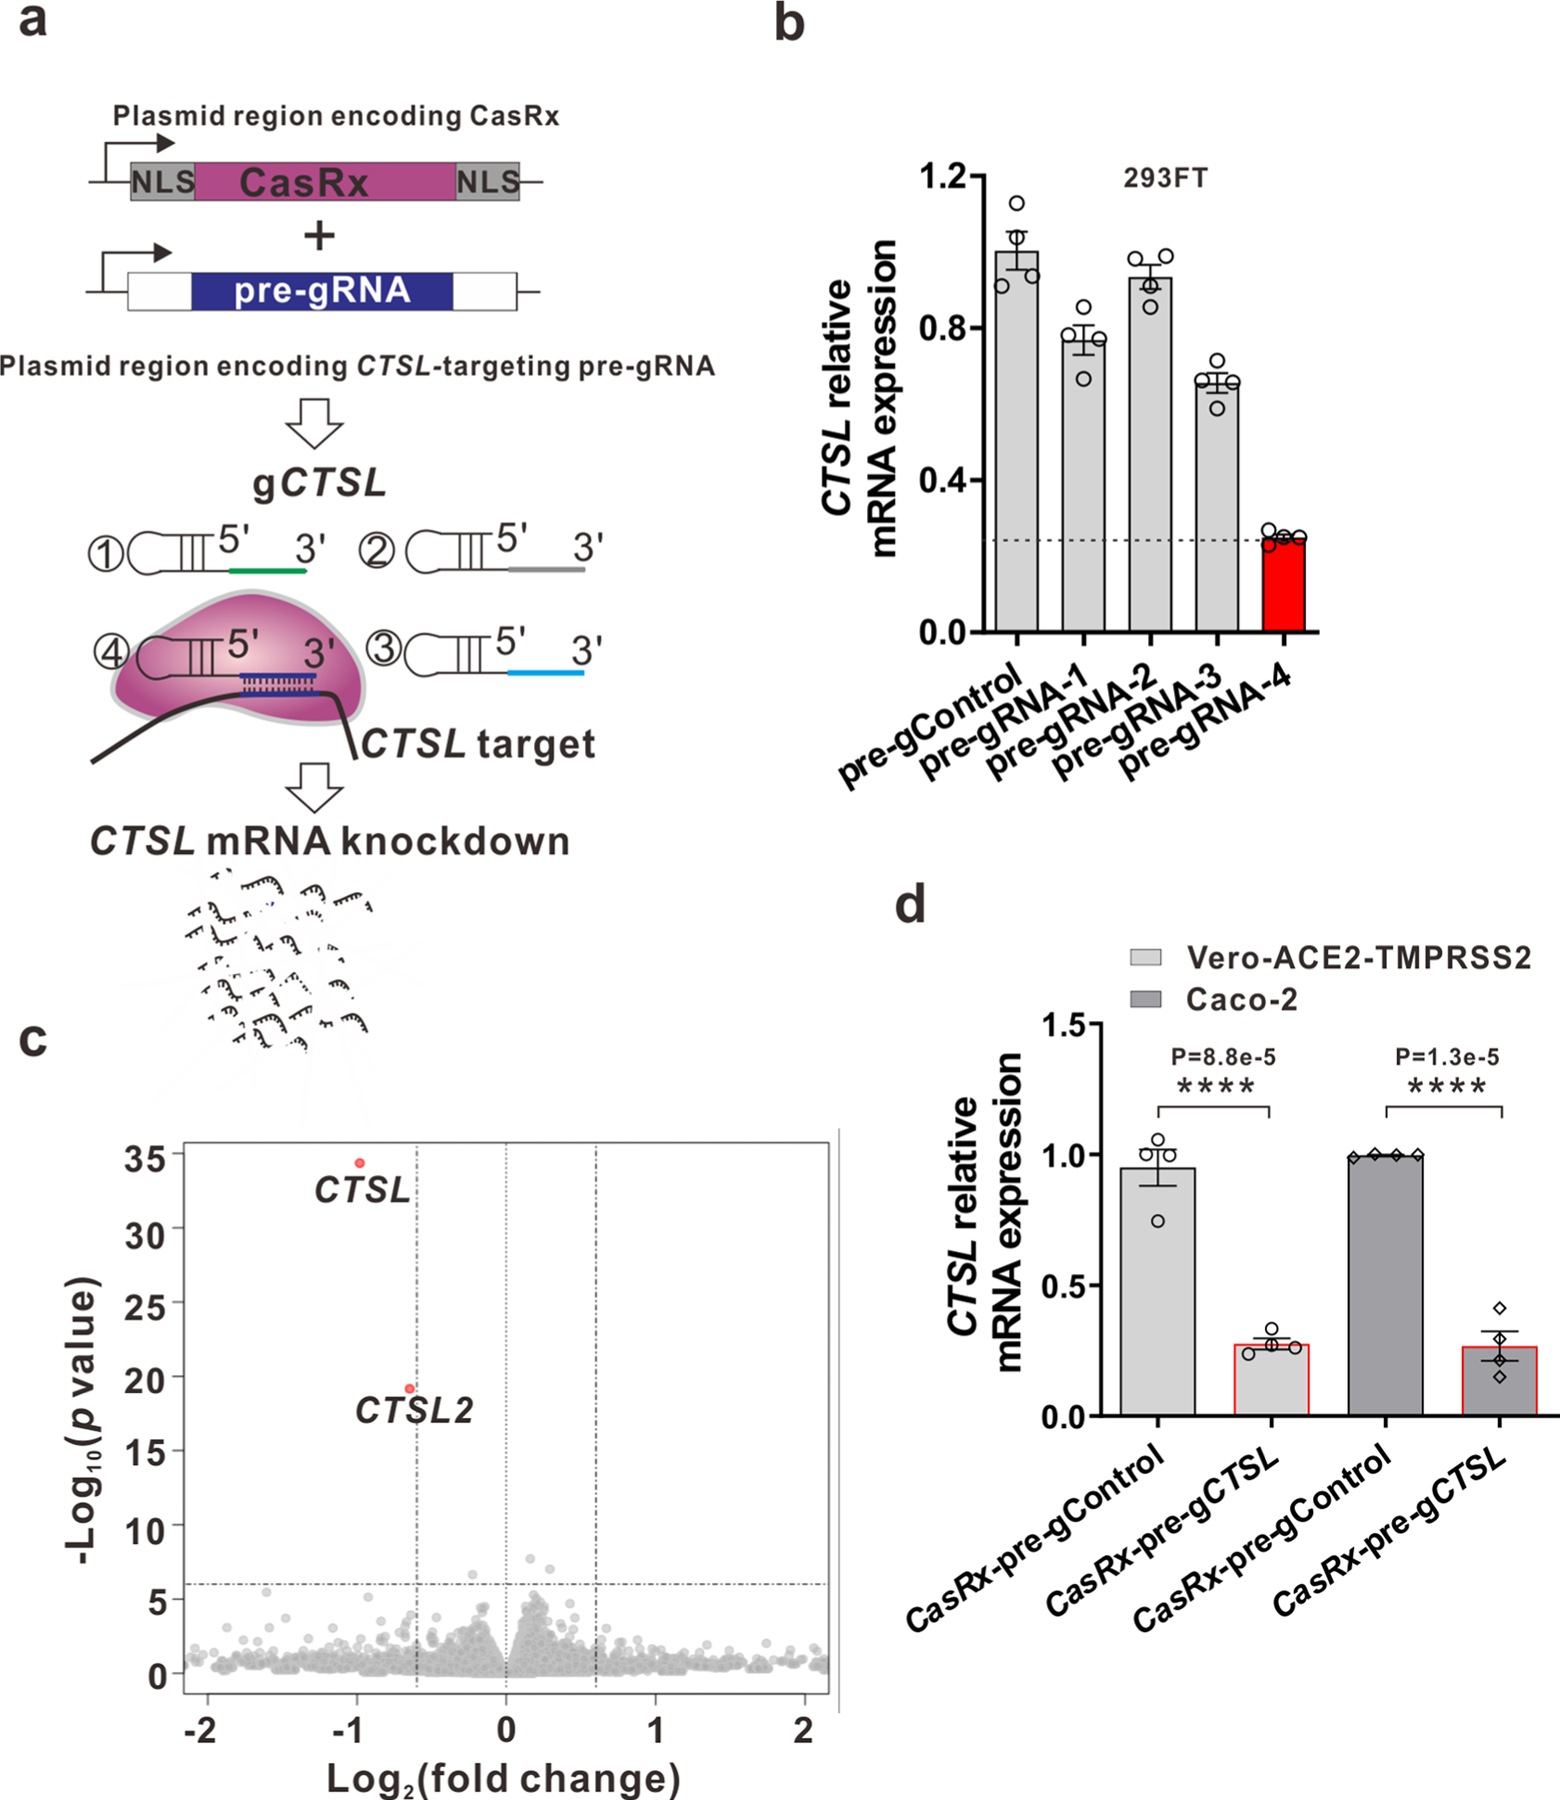
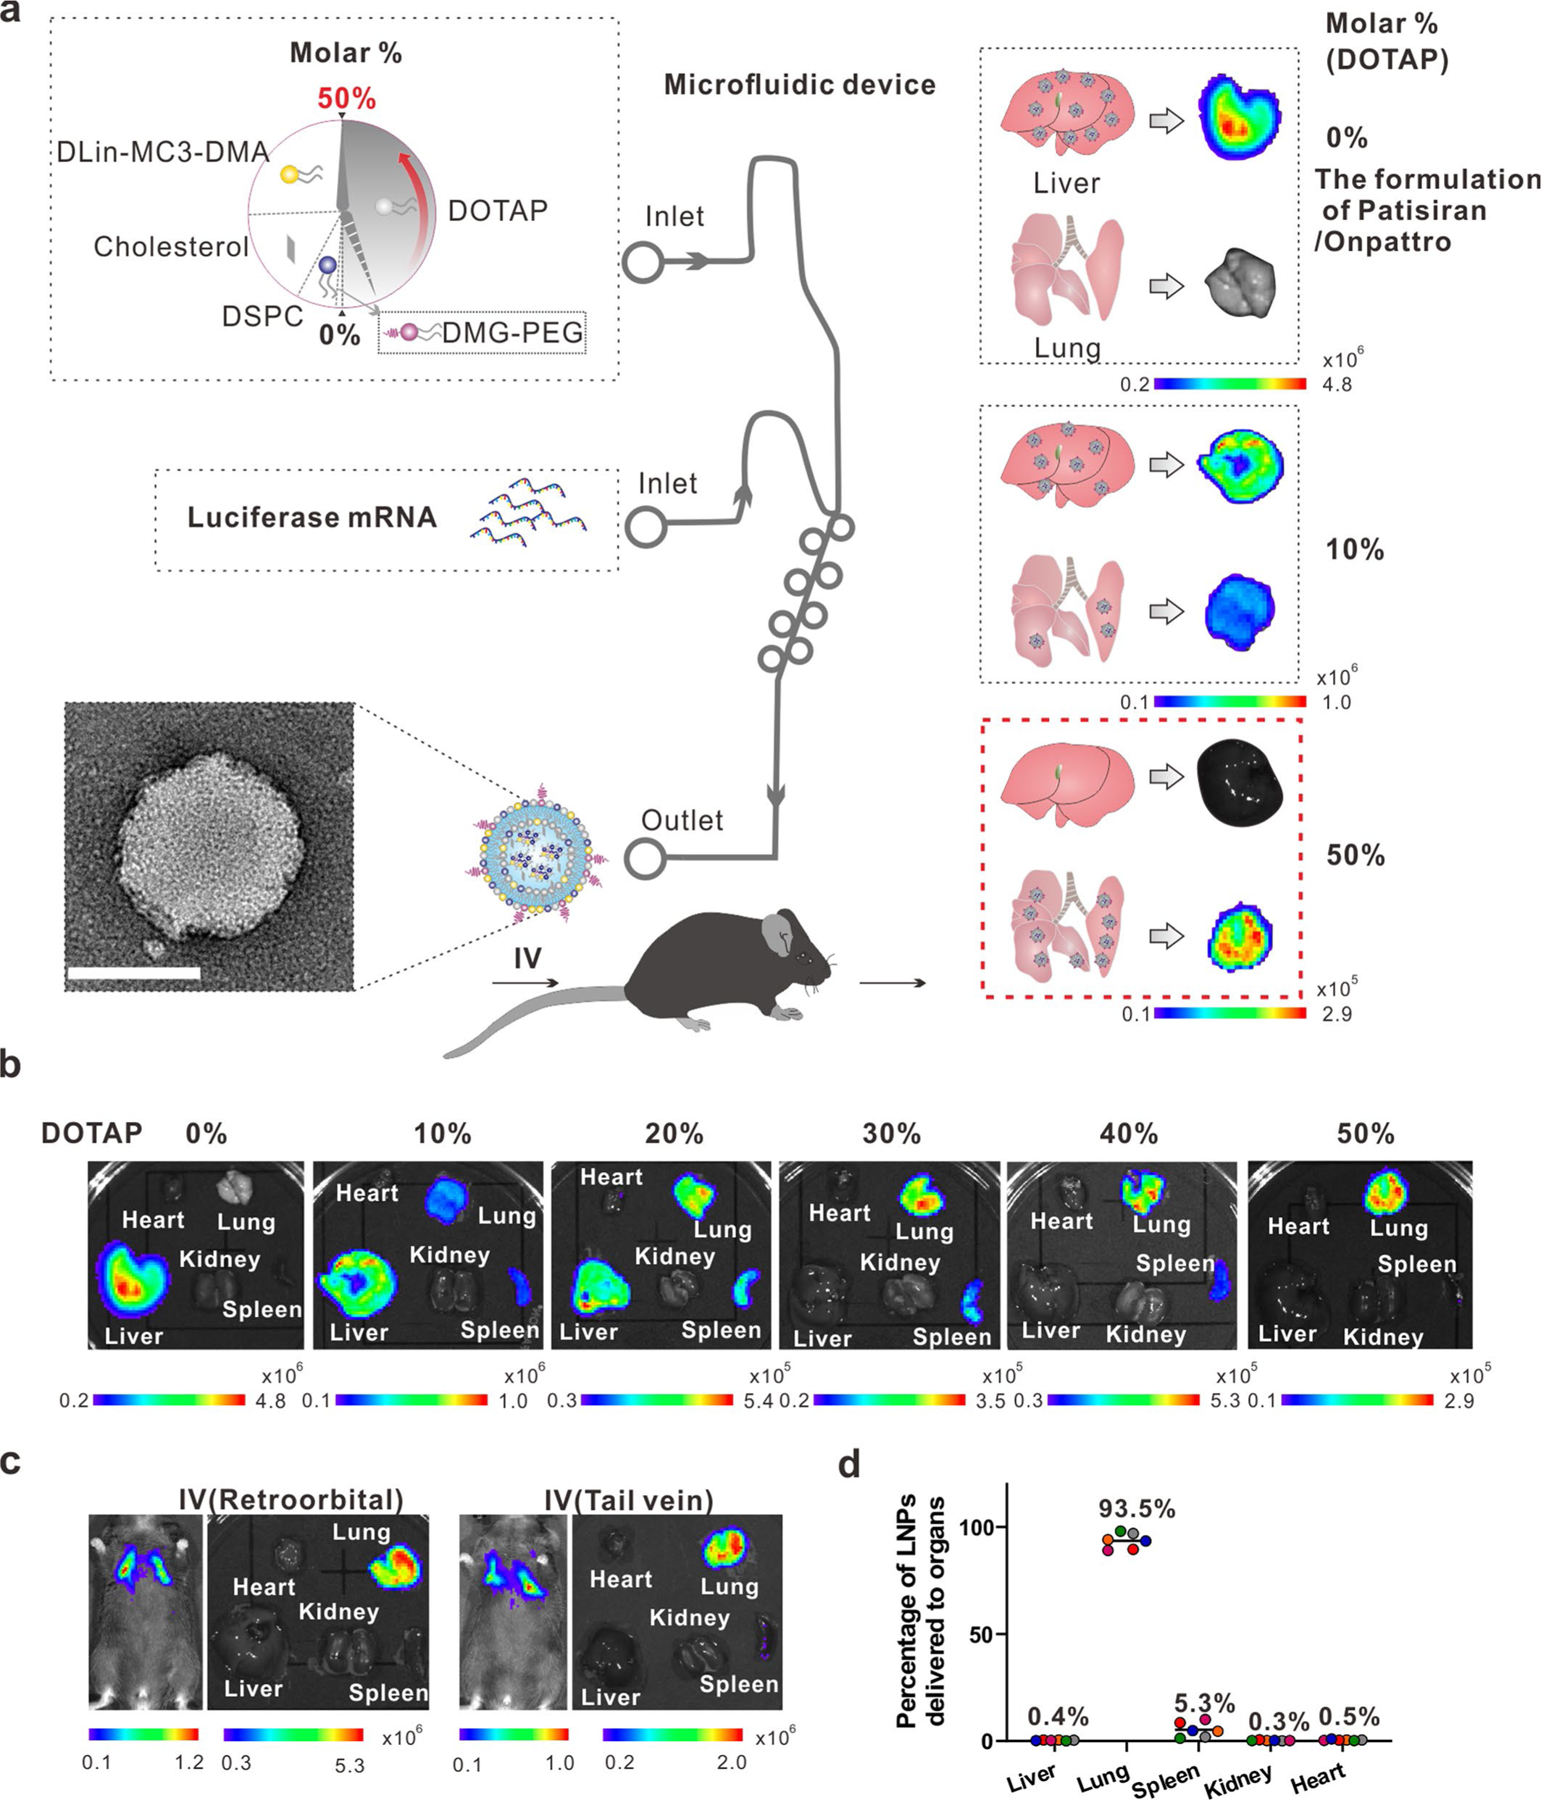
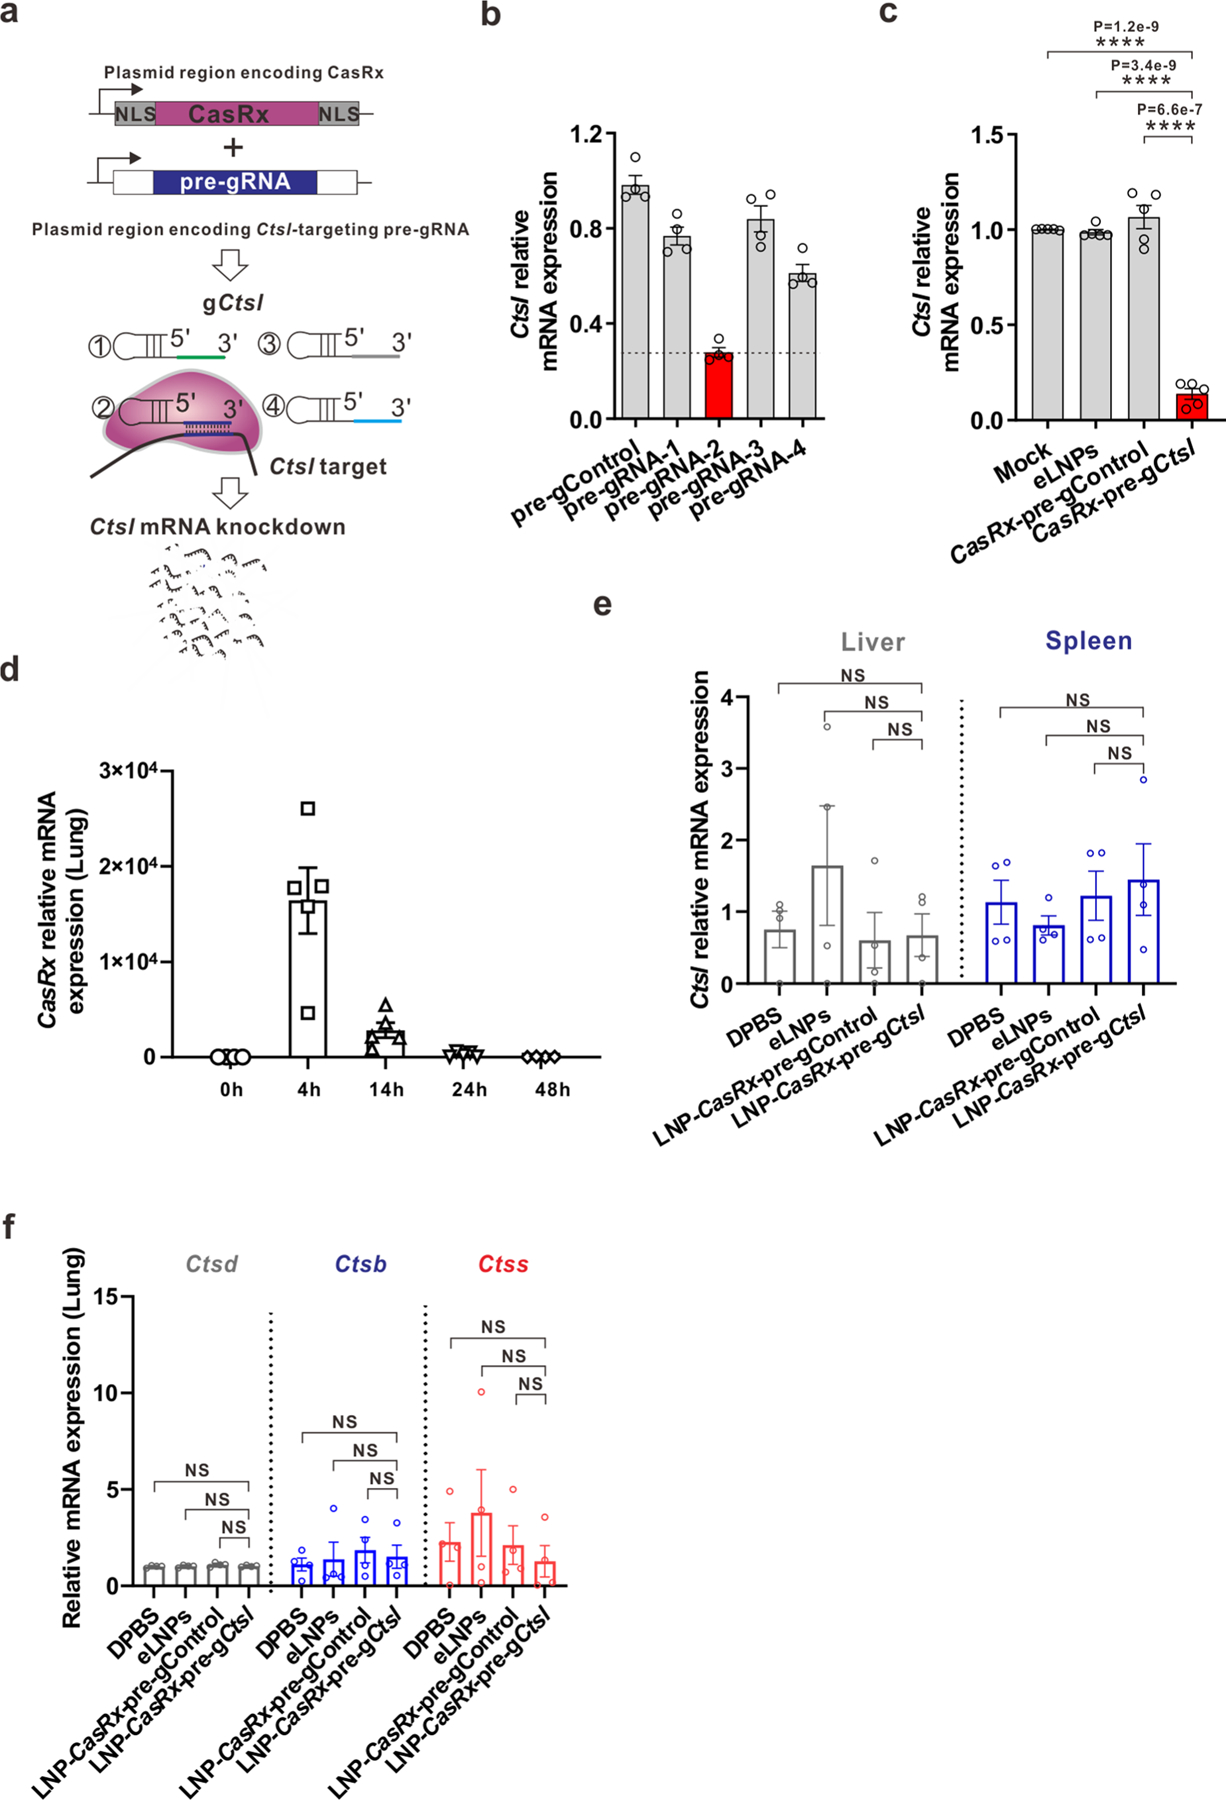
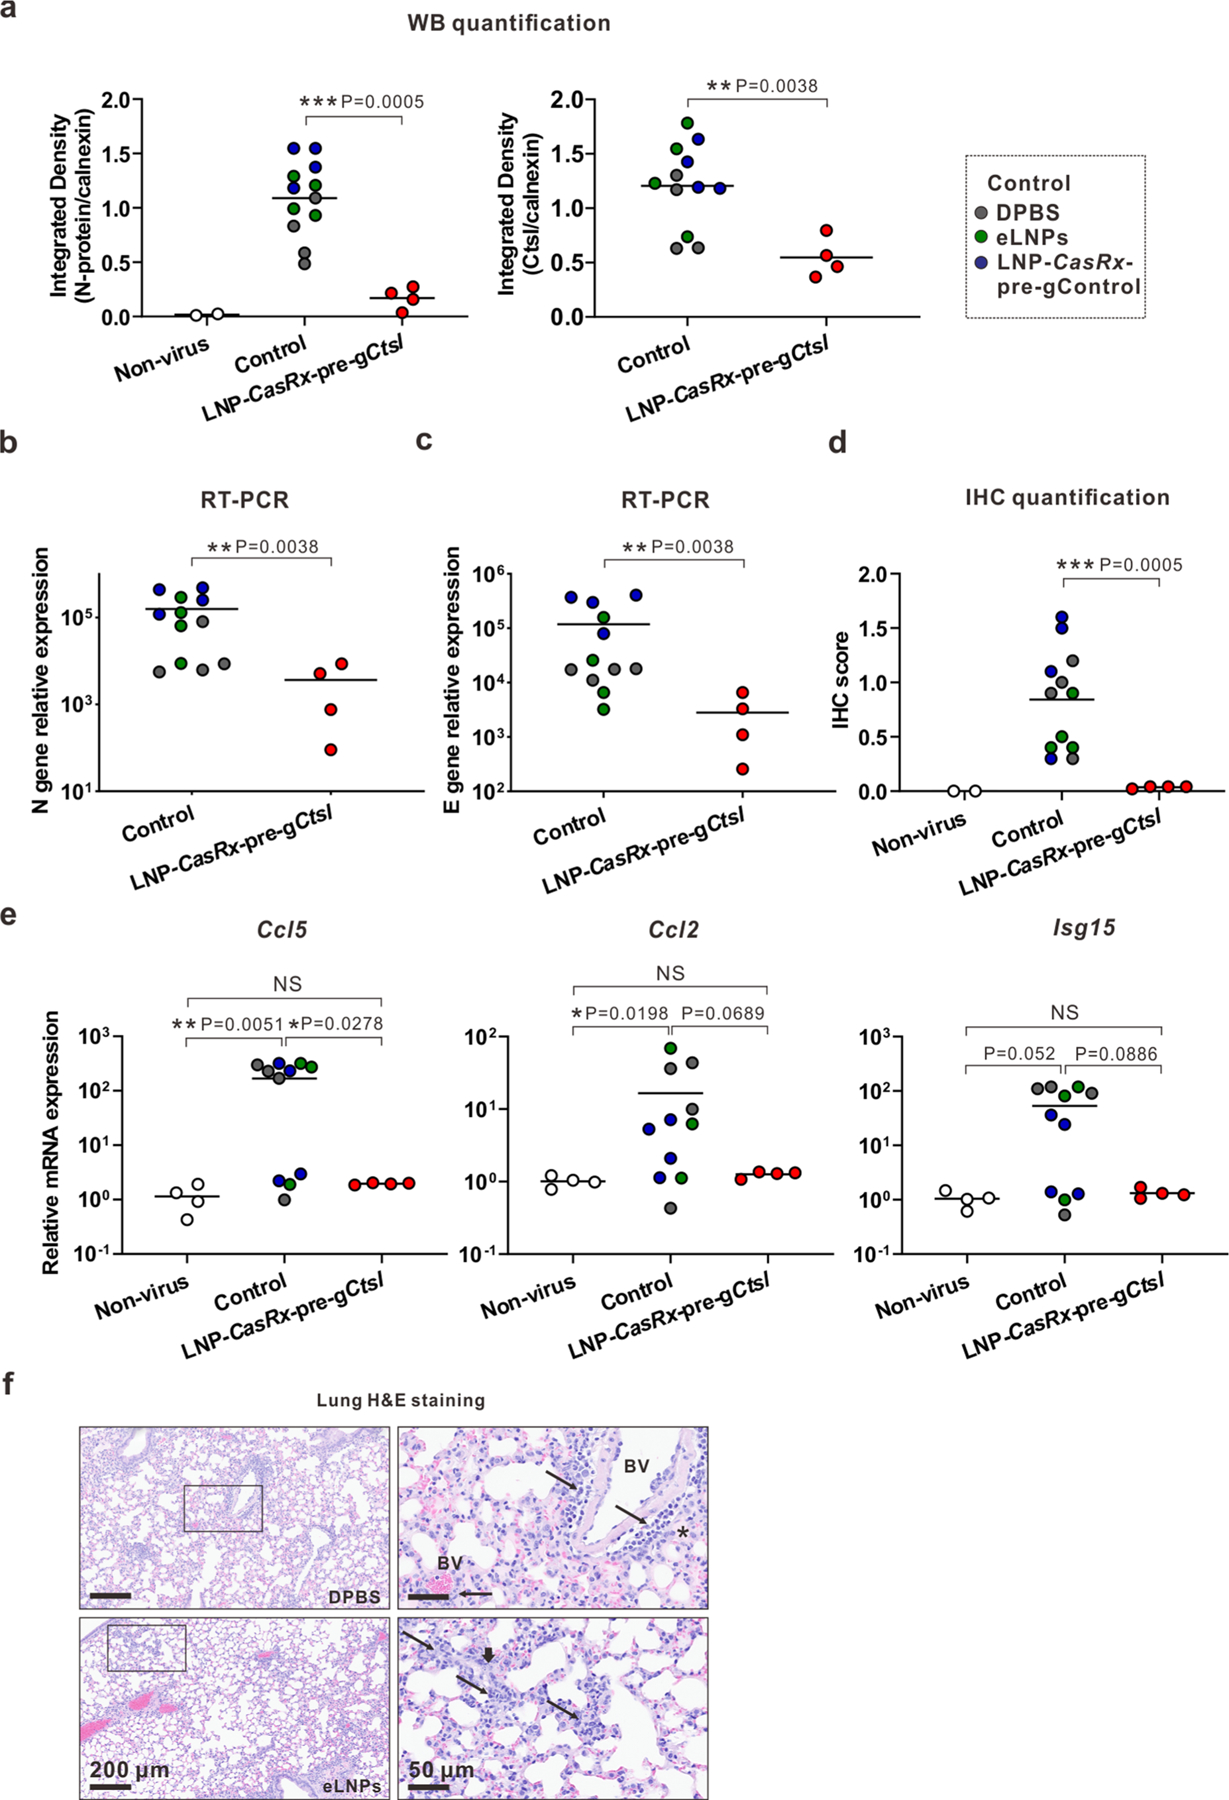
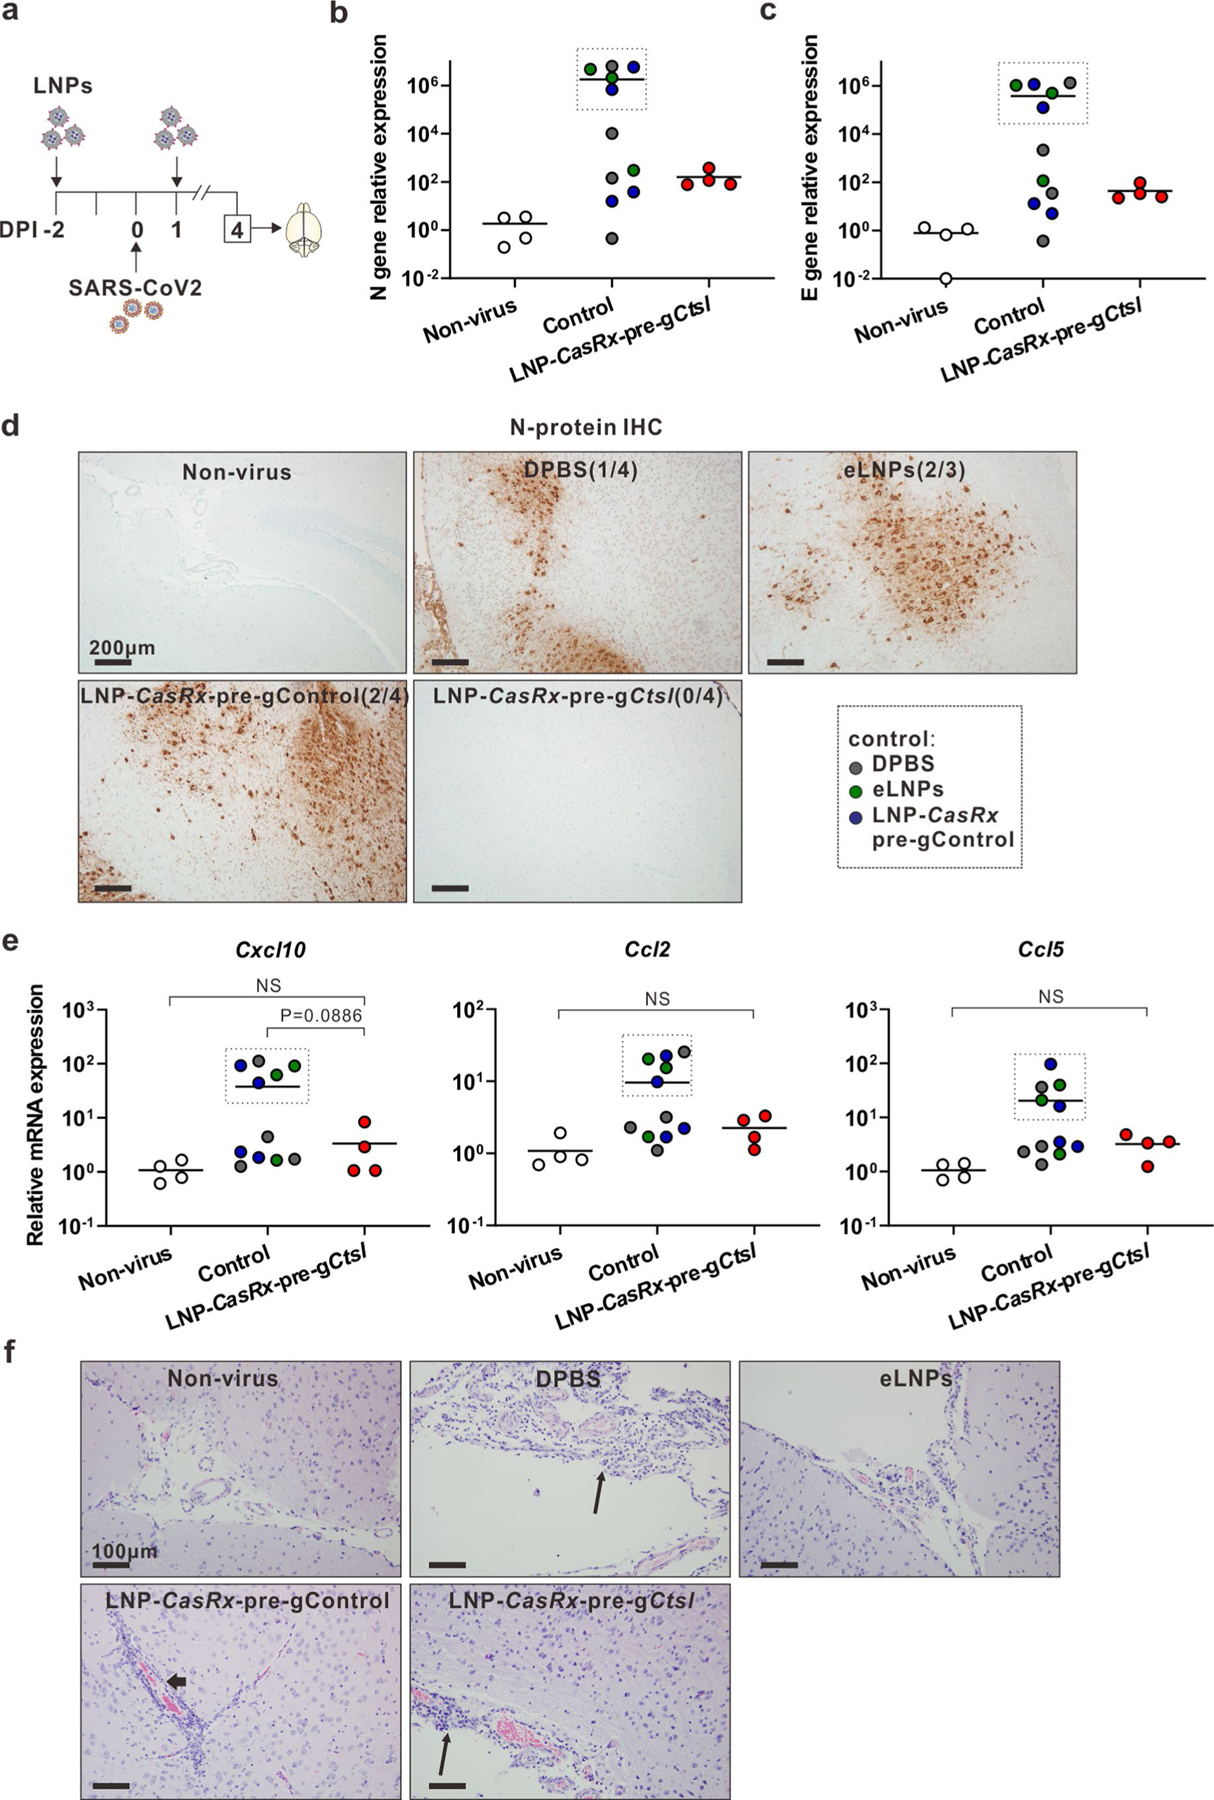
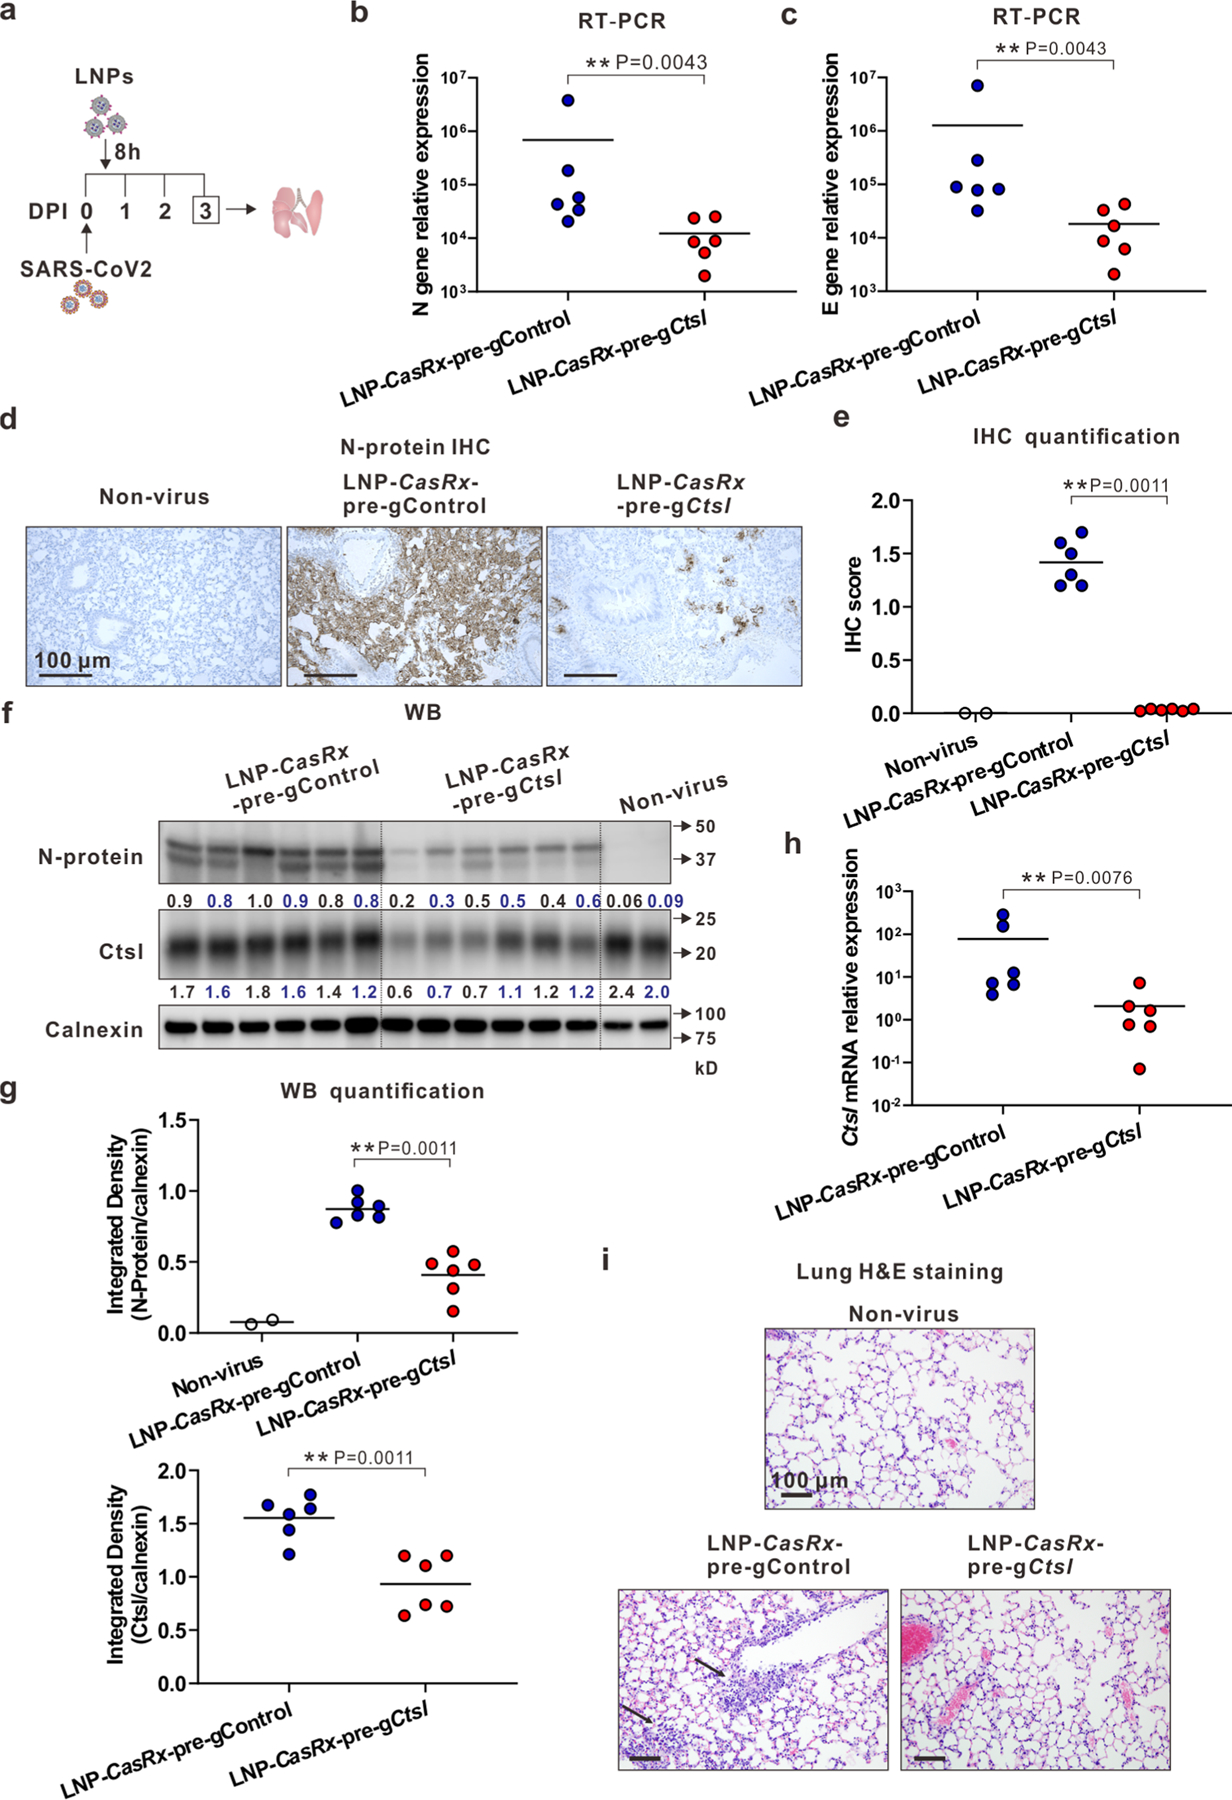
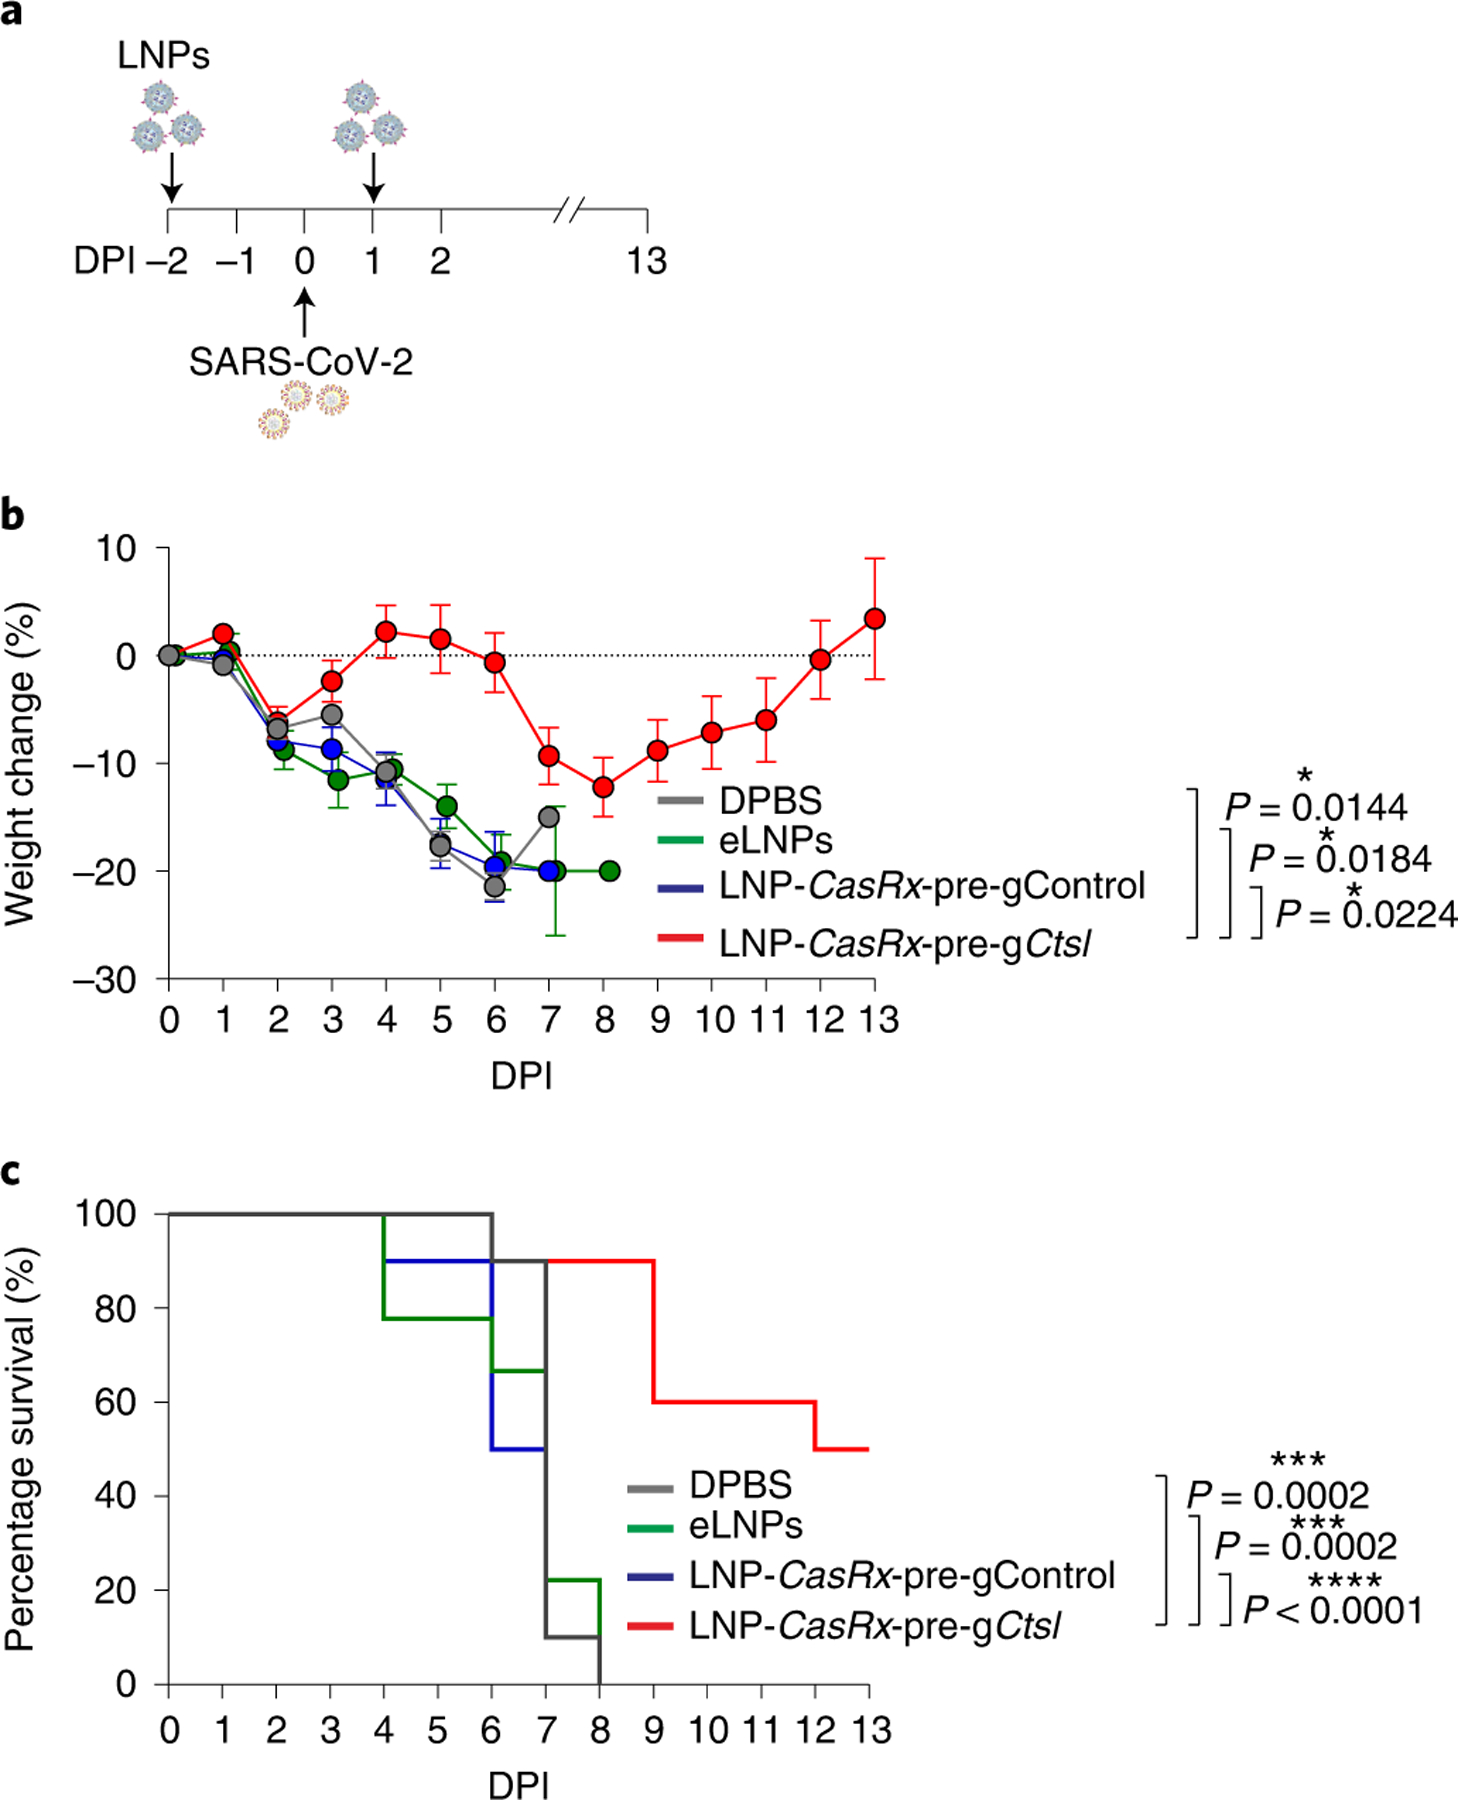
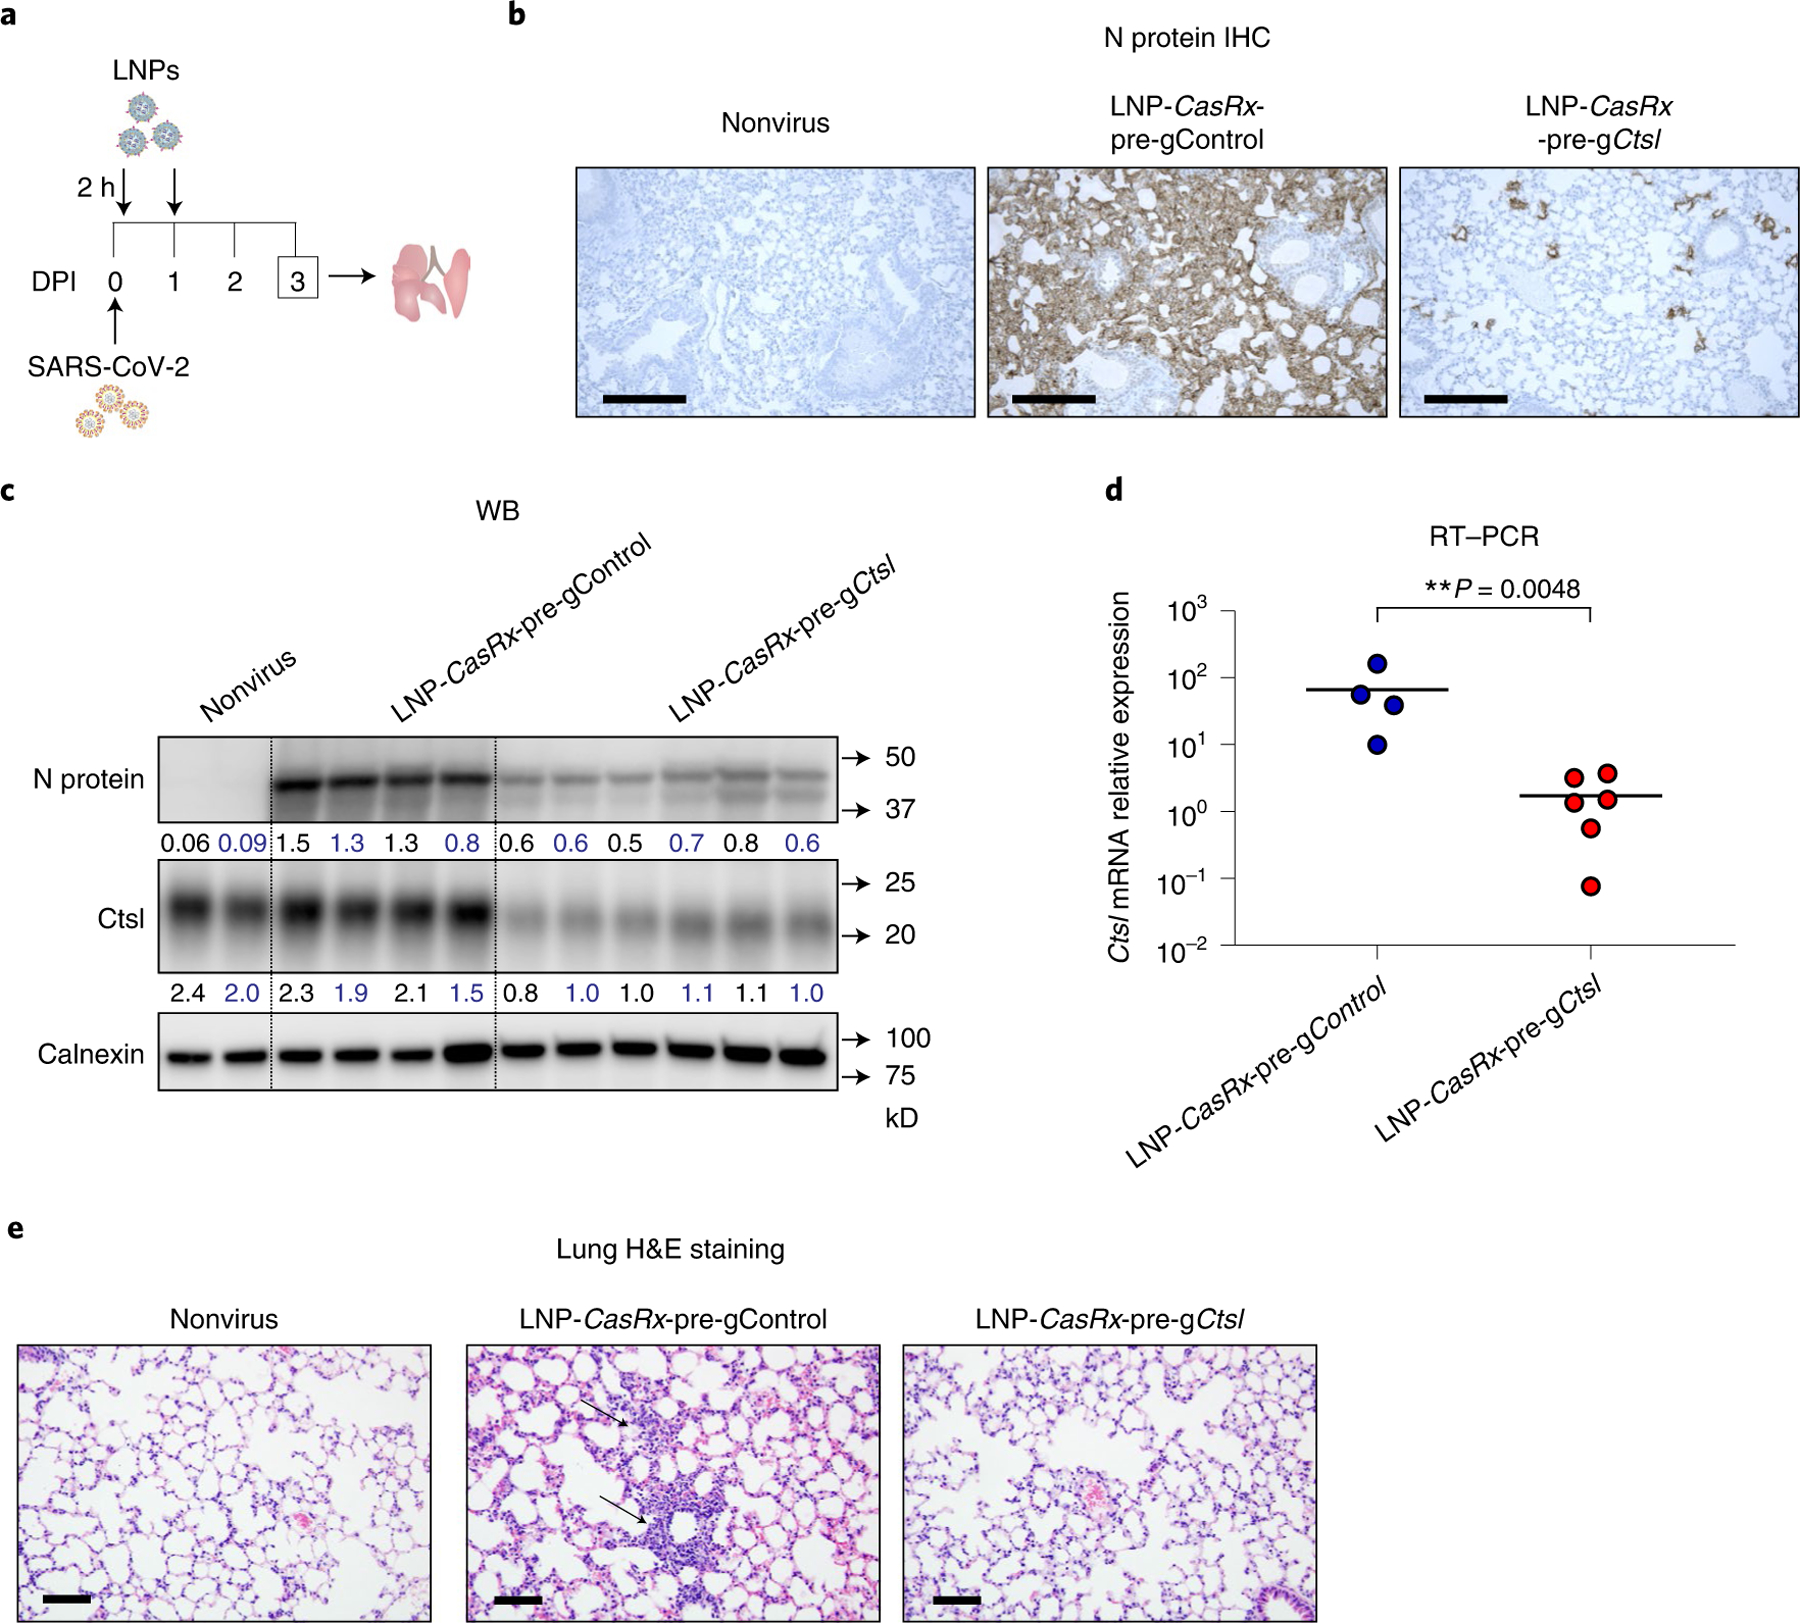
SARS-CoV-2 entry into cells requires specific host proteases; however, no successful in vivo applications of host protease inhibitors have yet been reported for treatment of SARS-CoV-2 pathogenesis. Here we describe a chemically engineered nanosystem encapsulating CRISPR-Cas13d, developed to specifically target lung protease cathepsin L (Ctsl) messenger RNA to block SARS-CoV-2 infection in mice. We show that this nanosystem decreases lung Ctsl expression in normal mice efficiently, specifically and safely. We further show that this approach extends survival of mice lethally infected with SARS-CoV-2, correlating with decreased lung virus burden, reduced expression of proinflammatory cytokines/chemokines and diminished severity of pulmonary interstitial inflammation. Postinfection treatment by this nanosystem dramatically lowers the lung virus burden and alleviates virus-induced pathological changes. Our results indicate that targeting lung protease mRNA by Cas13d nanosystem represents a unique strategy for controlling SARS-CoV-2 infection and demonstrate that CRISPR can be used as a potential treatment for SARS-CoV-2 infection.


Conflict of interest statement

Competing interests

Q.W., Z.C. and Y.D. are inventors on a patent (US Patent Application no. 17/626,482 entitled ‘Nanoparticle Systems for Targeted Delivery of CRISPR–Cas13 and Methods of Using Same’ filed 12 January, 2022, patent pending; European Patent Application no. 20840456.6 entitled ‘Nanoparticle Systems for Targeted Delivery of CRISPR–Cas13 and Methods of Using Same’ filed 12 January, 2022, patent pending) filed by Duke University that relates to the research reported in this paper. J.H. is a consultant for or owns shares in the following companies: Kingmed, MoreHealth, OptraScan, Genetron, Omnitura, Vetonco, York Biotechnology, Genecode, VIVA Biotech and Sisu Pharma and received grants from Zenith Epigenetics, BioXcel Therapeutics, Inc. and Fortis Therapeutics. The remaining authors declare no competing interests.

Figures

Extended Data Fig. 1 |
Extended Data Fig. 1 |. Screening for a pre-gRNA targeting human CTSL and evaluation of its knockdown efficiency and specificity in cultured cells.
a, Schematic of CasRx and pre-gRNA plasmid system for screening candidate pre-gRNA targeting human CTSL. b, Relative CTSL mRNA expression was measured by RT-PCR after 48 h after transfection with CasRx plasmid and different pre-gRNAs designed to target CTSL in 293 FT cells. c, Volcano plot of gene expression changes between CasRx-pre-gCTSL and CasRx-pre-gControl transfected 293FT cells for 24 h. RNA sequencing was performed in biological triplicates. Significantly differentially expressed genes (Fold change >1.5, P-value<1E-6) are shown in red color. d, CTSL knockdown efficiency in Vero-ACE2-TMPRSS2 and Caco-2 cells. Of note, the pre-gCTSL targeting sequence in CTSL mRNA is same for human and monkey. Data in plots b and d were shown with n = 4 biologically independent replicates and presented as mean ± SEM. Transcript levels are normalized to 18 s rRNA. P values were calculated by two-tailed Student’s t-test. **** P < 0.0001.
Extended Data Fig. 2 |
Extended Data Fig. 2 |. IVIS imaging for the LNPs biodistribution.
a, Schematic illustration for the construction of lung-targeting LNPs. The lipids are injected into the upper inlet of a microfluidic device (SPARKTM CARTRIDGE), whereas the cargo luciferase mRNA is loaded into the lower inlet to generate the LNPs from the outlet. Lung-selectivity of LNPs is achieved by adding 50% (molar%) supplementary cationic lipid DOTAP (a SORT molecule) to the traditional LNPs formulation employed by the FDA-approved RNAi therapy Patisiran/Onpattro. Scale bar, 100 nm. b, Mouse major organs were imaged 3 h following tail vein injection of luciferase mRNA-loaded LNPs (LNP-Luc, 0.4 mg/kg) formulated with a series of molar % of DOTAP (0–50 %). c, The animal’s whole body and organs were imaged 3 h after IV injection (retro-orbital or tail vein) of 50% DOTAP-containing LNPs loaded with 0.5 mg/kg luciferase mRNA. d, The average percentages of LNPs with 50% DOTAP delivered to each mouse organ. n = 6 mice.
Extended Data Fig. 3 |
Extended Data Fig. 3 |. Characterization of empty LNPs (eLNPs) and LNPs encapsulating luciferase mRNA.
a, Size distribution. The size of two batches of eLNPs and LNP-Luc were analyzed by Zetasizer. b, Representative transmission electron microscopic images. The experiment was repeated twice with similar results. c, Zeta potential. eLNPs and LNP-Luc were diluted to 0.8 μg/μl with 1X DPBS for measurement. Data are presented as mean ± SD of two batches of samples. d, Encapsulation rate and stability of LNP-Luc. The encapsulation efficiency of LNP-Luc was determined by RiboGreen assay on days 0, 2, 4, 6, 8 and 10 following its storage at 4°C.
Extended Data Fig. 4 |
Extended Data Fig. 4 |. Screening of candidate pre-gRNAs targeting mouse Ctsl in vitro and examination of the editing specificity of LNP-CasRx-pre-gCtsl in vivo.
a, Schematic of CasRx and pre-gRNA plasmid system for screening candidate pre-gRNA targeting mouse Ctsl. Relative Ctsl mRNA expression was measured by RT-PCR after 48 h transfection with b, Plasmids encoding CasRx with different pre-gRNAs designed for targeting Ctsl; or c, CasRx mRNA and selected pre-gCtsl from (b) in mouse KLN205 cells. n = 4 biologically independent samples for b; n = 5 biologically independent samples for c. Data are presented as mean ± SEM. P values were calculated by two-tailed Student’s t-tests. ****P < 0.0001. d, Kinetics of CasRx mRNA in lung. C57BL/6 mice were administered LNPs encapsulating CasRx mRNA at 0.5 mg/kg by tail vein. Lungs were collected at 0, 4, 14, 24 or 48 h, respectively, after the injection for qRT-PCR analysis. Data are presented as mean ± SEM for each time point (n = 4 for 0, 48 h; n = 5 for 4 h, 14 h, 24 h). e-f, C57BL/6 mice were administered DPBS, eLNPs, LNP-CasRx-pre-gControl or LNP-CasRx-pre-gCtsl by tail vein. After 72 h, the lung, liver and spleen were collected for analysis. e, Ctsl mRNA levels in liver and spleen remained unchanged by LNP-CasRx-pre-gCtsl treatment. f, mRNA levels of isoform Ctsd, Ctsb and Ctss in lung are unchanged by LNP-CasRx-pre-gCtsl treatment. Transcript levels were normalized to Gapdh and presented as mean ± SEM. n = 4 per group, 2 females and 2 males. P values were calculated by one-tailed Mann-Whitney U test. NS, not significant.
Extended Data Fig. 5 |
Extended Data Fig. 5 |. Immunogenicity, hematology and histological evaluation of LNP-CasRx-pre-gCtsl treatment in C57BL/6 mice.
a, Cytokine and chemokine transcript levels in mouse lung were unchanged by LNP-CasRx-pre-gCtsl treatment. C57BL/6 mice lung issues were collected at 72 h following the treatments. All transcript levels are normalized to Gapdh. Data are presented as mean ± SEM for each group (n = 4, 2 females and 2 males). P values were calculated by two-tailed Mann-Whitney U test, NS, not significant. b, Hematology was not impaired by LNP-CasRx-pre-Ctsl treatment. WBC, white blood cells; PLT, platelets; RBC, red blood cells; HGB, hemoglobin. Data are presented as box and whisker plots of each group with n = 8 (4 females and 4 males in each group except for 3 females and 5 males in LNP-CasRx-pre-gControl group). Whiskers are min to max. P values were calculated by two-tailed Mann-Whitney U test, NS, not significant. c, No substantial histopathological changes were produced by LNP-CasRx-pre-gCtsl treatment in indicated organ tissues. Two sections of each organ from 3 mice per group were evaluated after H&E staining and the representative images are presented.
Extended Data Fig. 6 |
Extended Data Fig. 6 |. CasRx-mediated Ctsl knockdown reduces viral burden and chemokines/cytokines in lungs of K18-hACE2 mice on Day 2 or 4 after SARS-CoV-2 infection.
The experimental designs are same as in Fig. 4a. or 5a, respectively. a, Integrated density of N protein (left panel) and Ctsl (right panel) over the loading control on 2 DPI. b, Viral N gene transcript level on 2 DPI. c, Viral E gene transcript level on 2 DPI. d, IHC score for N protein on 2 DPI. e, Ccl5, Ccl2 and Isg15 transcript levels on 4 DPI. b, c, e, All transcript levels were determined by RT-PCR and normalized to Gapdh. P values were calculated by one-tailed Mann-Whitney U test, grand mean. NS, not significant, * P < 0.05, ** P < 0.01. f, Representative photomicrographs of H&E-stained lung sections for the controls of DPBS and eLNPs on 4 DPI. Annotations: BV, blood vessel; thin arrow, perivascular or interstitial inflammatory infiltrates; thick arrow, karyorrhexic nuclei and region of diffuse alveolar damage; asterisk, intra-alveolar edema.
Extended Data Fig. 7 |
Extended Data Fig. 7 |. CasRx-mediated Ctsl knockdown reduces viral burden in the lungs of K18-hACE2 mice on Day 4 after SARS-CoV-2 infection.
The experiment design was same as in Fig. 5a. a, Viral N gene transcript level. b, Viral E gene transcript level. c, Western blot of viral N protein and Ctsl in mouse lung. All mice were subjected to this analysis. Each lane represents an individual mouse. Calnexin was used as a loading control. The ratio of N protein or Ctsl to calnexin signal is listed under the blot. d, Integrated density of N protein (upper panel) and Ctsl (lower panel) over the loading control. e, Representative images for N protein immunostaining in the lungs. One section per mouse was subjected to IHC analysis and only one representative image from each group was presented. f, IHC score for N protein. g, Ctsl transcript levels. a, b, g, All transcript levels are normalized to Gapdh. P values were calculated by one-tailed Mann-Whitney U test, grand mean. * P < 0.05, ** P < 0.01, *** P < 0.001.
Extended Data Fig. 8 |
Extended Data Fig. 8 |. Brain responses in SARS-CoV-2-infected K18-hACE2 mice at 4 DPI following LNP-CasRx-pre-gCtsl treatment.
a, Schematic illustration of the experimental design. The treatments and virus challenge are same as in Fig. 5a. Brains were collected at 4 DPI for analysis. The right lobes were subjected to RT-PCR, whereas the left lobes were sectioned for staining. b, Viral N gene transcript level. c, Viral E gene transcript level. d, Representative photomicrographs of N-protein immunostaining show strong intracytoplasmic immunoreactivity of neurons in the cerebral cortex and the thalamus and hypothalamus regions of SARS-CoV-2 infected mice. Two sections of brain tissues per mouse from 4 mice of each group (3 for eLNPs group) were subjected to IHC analysis. The occurrence of strong positive staining was indicated in brackets for each group. e, Cxcl10, Ccl2 and Ccl5 transcript levels. b, c, e, all transcript levels were normalized to Gapdh. P values were calculated by one-tailed Mann-Whitney U test, grand mean. NS, not significant. As boxed in the graphs, 5 out of 11 mice in the control group express high transcript levels of viral N gene, E gene and chemokines in the brain. f, Representative photomicrographs of perivascular lymphoid infiltrate (thin arrows) in meninges and Virchow-Robin spaces (thick arrow) show vascular inflammatory changes in all virus-infected groups. Two brain sections per mouse for all mice were subjected to histological analysis and one representative image from each group was shown.
Extended Data Fig. 9 |
Extended Data Fig. 9 |. Postexposure treatment with LNP-CasRx-pre-gCtsl reduces virus burden in lungs of SARS-Cov-2 infected K18-hACE2 mice.
The experiment design was same as in Fig. 6a. LNP-CasRx-pre-gControl group consisted of 4 mice (2 females and 2 males), whereas LNP-CasRx-pre-gCtsl group had 6 mice (3 females and 3 males). Non-virus, 1 female and 1 male mouse. The lungs were collected on 3 DPI for analysis. a, Viral nucleocapsid N gene transcript levels. b, Viral envelope E gene transcript levels. All transcript levels are normalized to Gapdh. c, IHC score for the viral N protein. d, Integrated density of N protein (left panel) and Ctsl (right panel) over the loading control calnexin. P values were calculated by one-tailed Mann-Whitney U test, grand mean. ** P <0.01.
Extended Data Fig. 10 |
Extended Data Fig. 10 |. A single 8-hour post-exposure treatment with LNP-CasRx-pre-gCtsl decreases virus burden in the lungs of SARS-Cov-2 infected K18-hACE2 mice.
a, Schematic illustration of the experimental design. Mice were intranasally infected with 104 PFU of SARS-CoV-2. They were treated with LNP-CasRx-pre-gControl or LNP-CasRx-pre-gCtsl through retro-orbital injections 8 hours post infection. Each group consisted of 6 mice (3 females and 3 males). Non-virus, 1 female and 1 male mouse. Lungs were collected on 3 DPI for analysis. b, Viral nucleocapsid N gene transcript levels. c, Viral envelope E gene transcript levels. d, Representative images for N protein immunostaining in the lungs. One section per mouse for all mice were subjected for IHC analysis and only one representative image from each group is shown. e, IHC score for N protein. f, Western blot of viral N protein and Ctsl protein in mouse lung. All mice were subjected to this analysis. Each lane represents an individual mouse. Calnexin was used as a loading control. The density ratio of N protein or Ctsl to calnexin is listed under the blot. g, Integrated density of N protein (upper panel) and Ctsl (lower panel) over the loading control. h, Ctsl transcript levels. b, c, h, All transcript levels are normalized to Gapdh. P values were calculated by one-tailed Mann-Whitney U test, grand mean. **P < 0.01. i, Representative photomicrographs of H&E-stained lung sections demonstrating normal cellularity of parenchymal lung by LNP-CasRx-pre-gCtsl treatment. One lung section per mouse for all animals was used for histological analysis and only one representative image from each group is presented. The thin arrow indicates especially severe interstitial inflammatory infiltrate within perivascular regions.
Fig. 1 |
Fig. 1 |. CasRx-mediated CTSL knockdown inhibits pseudotyped coronaviruses and authentic SARS-CoV-2 Delta variant (B.1.617.2) infection in cells.
a, Schematic depiction of the SARS-CoV-1 (SARS-1), SARS-CoV-2 (SARS-2) or B.1.617.2 Delta variant entry pathway, with CTSL cleavage sites on their respective spike proteins and mutation sites on the B.1.617.2 Delta variant spike protein shown. b,c, Relative infection of pseudotyped virus in Vero-ACE2-TMPRSS2 (b) and Caco-2 (c) cells. Cells were pretreated with CasRx-pre-gControl or CasRx-pre-gCTSL for 24 h or 25 μM E-64d for 1 h, followed by incubation with infectivity-normalized pseudovirus SARS-2 (b and c), SARS-1 (c) or VSV (c). n = 12 biologically independent replicates each group except n = 6 in the background (Bg) group for b; n = 12 (SARS-2, SARS-1) or 9 (VSV) biologically independent replicates each group except n = 5 in all E-64d groups for c. d,e, CasRx-pre-gCTSL treatment reduces live B.1.617.2 Delta variant infection in Vero-ACE2-TMPRSS2 cells. d, Viral N gene transcript level as normalized to 18S ribosomal RNA. e, Virus infectivity as determined by TCID50. n = 3 biologically independent replicates for d and e. Background cells were not challenged with virus and used as a negative control. Data are presented as mean ± s.e.m. P values were calculated by two-tailed Student’s t-tests. NS, not significant; **P < 0.01; ****P < 0.001.
Fig. 2 |
Fig. 2 |. Ctsl is specifically knocked down by a lung-selective LNP encapsulating CasRx-pre-gRNA system with minimal systemic toxicity in normal C57BL/6 mice.
Mice were administrated DPBS, empty LNPs, LNP-CasRx-pre-gControl or LNP-CasRx-pre-gCtsl, respectively, by tail vein. After 72 h, samples were collected for analysis. a, Ctsl mRNA level in lung. Ctsl transcript levels are normalized to Gapdh and expressed as a percentage of the DPBS control group. Each group consists of six females and six males, except for five females in the LNP-CasRx-pre-gControl group. The line shows the grand mean of each group, and each label represents an individual mouse. P values were calculated by one-tailed Mann–Whitney U-test, grand mean. ***P < 0.001, ****P < 0.0001. b, Representative western blot of Ctsl protein in lung. Samples were same as in a, but only one male and one female mouse were selected from each group for presenting. Calnexin was used as a loading control. c, Representative images for Ctsl immunostaining in lung. One lung section from one mouse of each control group and three mice from the LNP-CasRx-pre-gCtsl group were subjected to IHC analysis. Scale bars, 100 μm. d, Hepatic and renal functions were not impaired by LNP-CasRx-pre-Ctsl treatment. ALP, alkaline phosphatase; ALT, alanine transaminase; AST, aspartate aminotransferase; BUN, blood urea nitrogen; CREAT, creatinine. Data are presented as box and whisker plots of each group with n = 8 mice (four females and four males in each group except for three females and five males in LNP-CasRx-pre-gControl group). Box plots show the median (center line) with bounds of 25–75th percentiles. The whiskers are extended to 1.5× the interquartile range. P values were calculated by a two-tailed Mann–Whitney U-test.
Fig. 3 |
Fig. 3 |. LNP-CasRx-pre-gCtsl treatment protects K18-hACE2 mice against lethal SARS-CoV-2 infection.
a, Schematic illustration of the experimental design. Seven-to eight-week-old K18-hACE2 female and male mice were intranasally infected with 105 PFU of SARS-CoV-2 (USA-WA1/2020). They were treated with DPBS, eLNPs, LNP-CasRx-pre-gControl or LNP-CasRx-pre-gCtsl through the retro-orbital injections 2 days before and 1 DPI. Each group consists of ten mice (five females and five males) except for nine mice in the eLNPs group (five females and four males). Mouse weights were monitored daily to DPI 13. b, Percentage of weight change. Data are presented as mean ± s.e.m. The dotted line represents the initial body weight. Mice that had lost >20% of their initial body weight were humanely euthanized. P values were calculated by two-tailed Student’s t-tests, *P < 0.05. c, Kaplan–Meyer survival curves. P values were determined by log-rank (Mantel–Cox) test. ***P < 0.001, ****P < 0.0001.
Fig. 4 |
Fig. 4 |. CasRx-mediated Ctsl knockdown markedly decreases SARS-CoV-2 burden in lungs of infected K18-hACE2 mice.
a, Schematic illustration of the experimental design, using the same treatment as in Fig. 3. Each group consists of two females and two males. Lungs were collected for analysis at 2 DPI. DPBS, eLNPs and LNP-CasRx-pre-gControl groups were pooled and referred to as control. b, Infectious viral titer in lung. Tissue homogenates were analyzed by plaque assay. The bar represents the average of the group, while each circle represents an individual animal. P values were calculated by one-tailed Mann–Whitney U-test, grand mean. ***P < 0.001. c, Western blot (WB) of viral N protein and Ctsl protein in lung. All animals were subjected to this analysis. Nonvirus, two mice (one female and one male) were not challenged with virus. Each lane represents an individual mouse. Calnexin was used as a loading control. The ratio of N or Ctsl protein over calnexin is listed under the blot. d, Representative images for viral N protein immunostaining in lung. One lung section per mouse for all animals were subjected to IHC analysis and only one image from each group was presented. Scale bar, 100 μm. e, Ctsl transcript levels as normalized by Gapdh. The bar represents the average of the group, while each circle represents an individual animal. P values were calculated by one-tailed Mann–Whitney U-test, grand mean. **P < 0.01.
Fig. 5 |
Fig. 5 |. LNP-CasRx-pre-gCtsl reduces chemokine/cytokine levels and lung pathogenesis in SARS-CoV-2-infected K18-hACE2 mice.
a, Schematic illustration of the experimental design, using the same treatment as in Fig. 3. Each group consists of two females and two males except for the eLNPs group (one female and two males). Lungs were collected for analysis at 4 DPI. The DPBS, eLNPs and LNP-CasRx-pre-gControl groups were pooled and referred to as control. Nonvirus, two females and two males. b, Transcript levels of Cxcl10 and Tnf in lung. All transcript levels are normalized to Gapdh. The bar represents the average of the group, while each circle represents an individual animal. P values were calculated by one-tailed Mann–Whitney U-test, grand mean. **P < 0.01. c, Representative photomicrographs of H&E-stained lung sections demonstrate that the perivascular, interstitial and alveolar inflammatory lesions in virus-infected mice were reduced by LNP-CasRx-pre-gCtsl treatment. One section per mouse was subjected to histological evaluation and only one image from each group was shown. Annotations: BV, blood vessel; thin arrow, perivascular or interstitial inflammatory infiltrates; asterisk, intra-alveolar edema. Scale bars, 200 μm (left) and 50 μm (right).
Fig. 6 |
Fig. 6 |. Postexposure treatment with LNP-CasRx-pre-gCtsl reduces virus burden in lungs of SARS-Cov-2 infected K18-hACE2 mice.
a, Schematic illustration of the experimental design. Female and male mice were intranasally infected with 105 PFU of SARS-CoV-2. They were treated with LNP-CasRx-pre-gControl or LNP-CasRx-pre-gCtsl through the retro-orbital injections 2 h and 1 DPI. The LNP-CasRx-pre-gControl group consisted of four mice (two females and two males), whereas the LNP-CasRx-pre-gCtsl group had six mice (three females and three males). The lungs were collected at 3 DPI for analysis. b, Representative images for viral N protein immunostaining in lung. One lung section per mouse was subjected to IHC analysis and only one image from each group was shown. Nonvirus, one female and one male mouse. Scale bar, 100 μm. c, Western blot (WB) of viral N protein and Ctsl protein in lung. All mice were subjected to this analysis. Each lane represents an individual mouse. Calnexin was used as a loading control. The ratio of N or Ctsl protein over calnexin is listed under the blot. d, Ctsl transcript levels as normalized by Gapdh. The bar represents the average of the group, while each circle represents an individual animal. P values were calculated by one-tailed Mann–Whitney U-test, grand mean. **P < 0.01. e, Representative photomicrographs of H&E-stained lung sections demonstrating that alveolar septal areas have essentially normal cellularity following LNP-CasRx-pre-gCtsl treatment. One lung section per animal was used for histological analysis and one image from each group was shown. Annotations: thin arrow, inflammatory infiltrate in interstitial regions causing hypercellularity. Scale bars, 100 μm.

Similar articles

Cited by

References

    1. Beigel JH et al. Remdesivir for the treatment of COVID-19—final report. N. Engl. J. Med 383, 1813–1826 (2020). - PMC - PubMed
    1. Taylor PC et al. Neutralizing monoclonal antibodies for treatment of COVID-19. Nat. Rev. Immunol 21, 382–393 (2021). - PMC - PubMed
    1. Mlcochova P et al. SARS-CoV-2 B.1.617.2 Delta variant replication and immune evasion. Nature 599, 114–119 (2021). - PMC - PubMed
    1. Planas D et al. Considerable escape of SARS-CoV-2 Omicron to antibody neutralization. Nature 602, 671–675 (2022). - PubMed
    1. Ledford H COVID antiviral pills: what scientists still want to know. Nature 599, 358–359 (2021). - PubMed

Publication types