

Assessment of indoor radon concentration and time-series analysis of gamma dose rate in three thermal spas from Portugal
- PMID: 35879585
- PMCID: PMC9314312
- DOI: 10.1007/s10661-022-10157-x
Assessment of indoor radon concentration and time-series analysis of gamma dose rate in three thermal spas from Portugal
Abstract
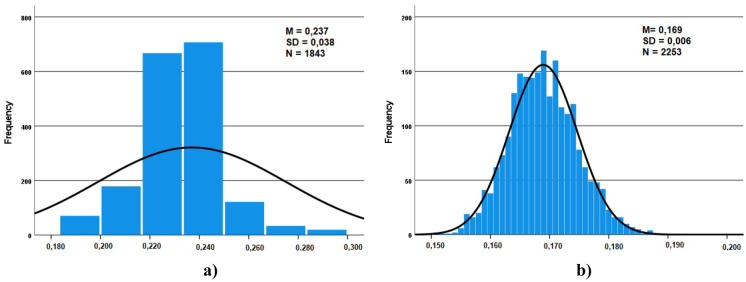
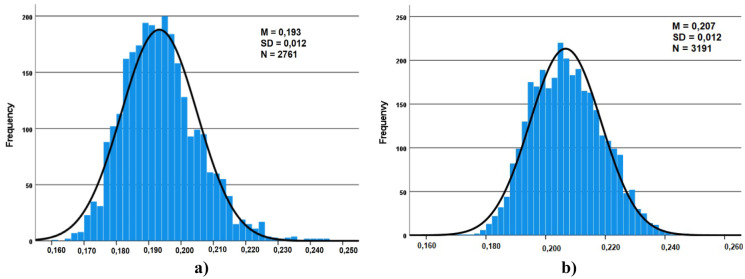
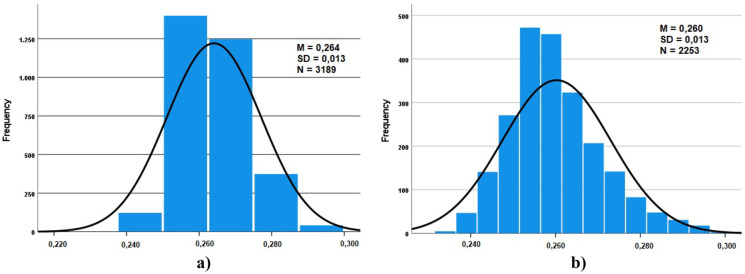
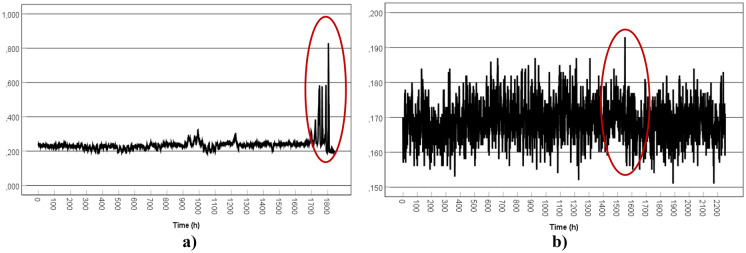
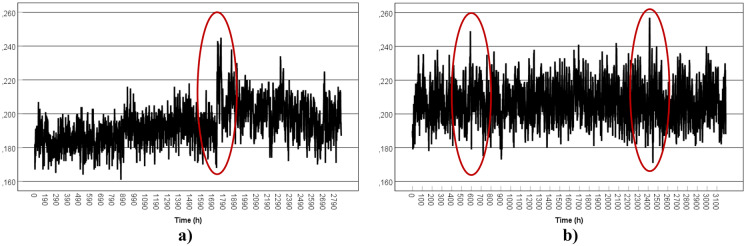
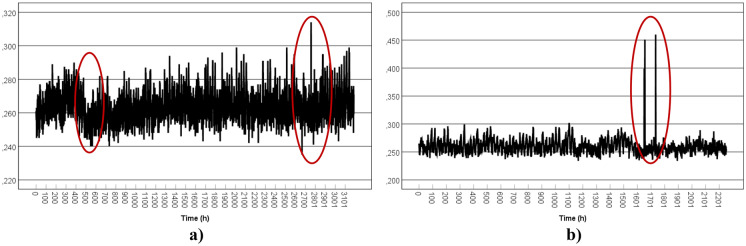
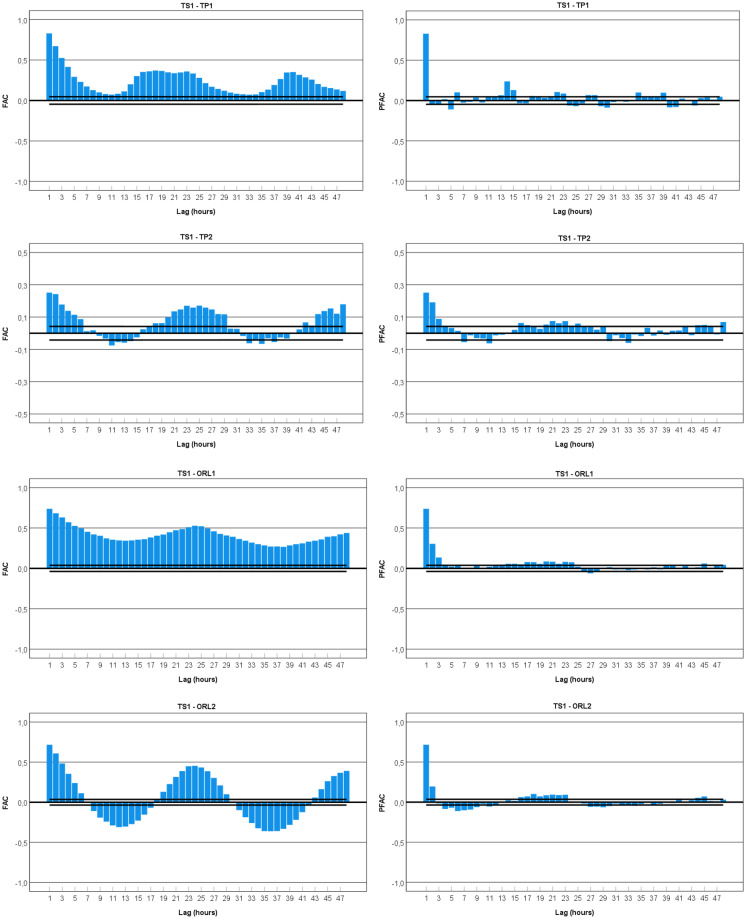
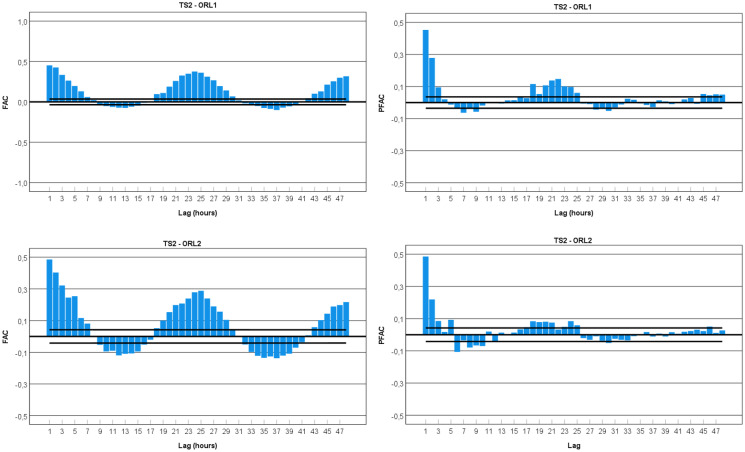
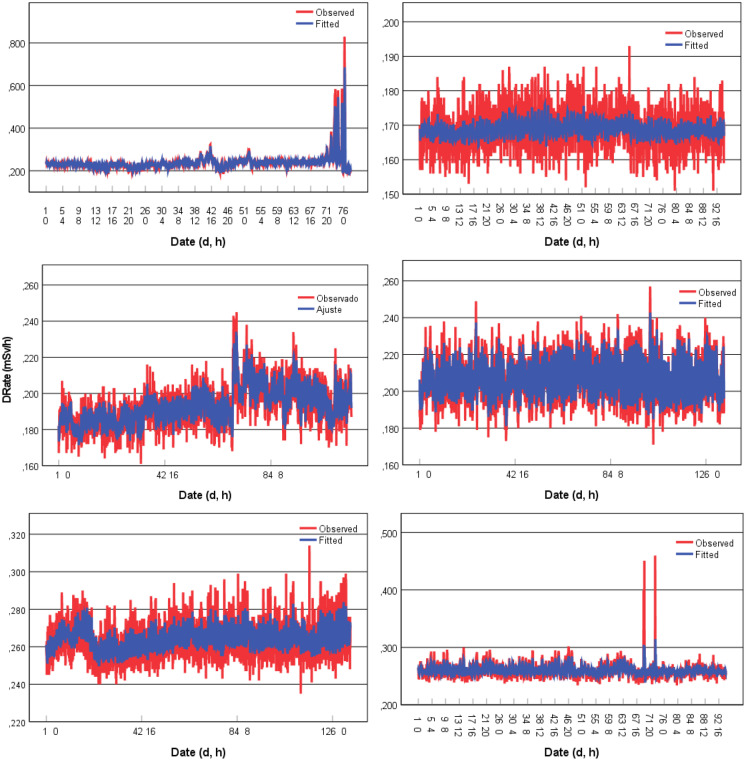
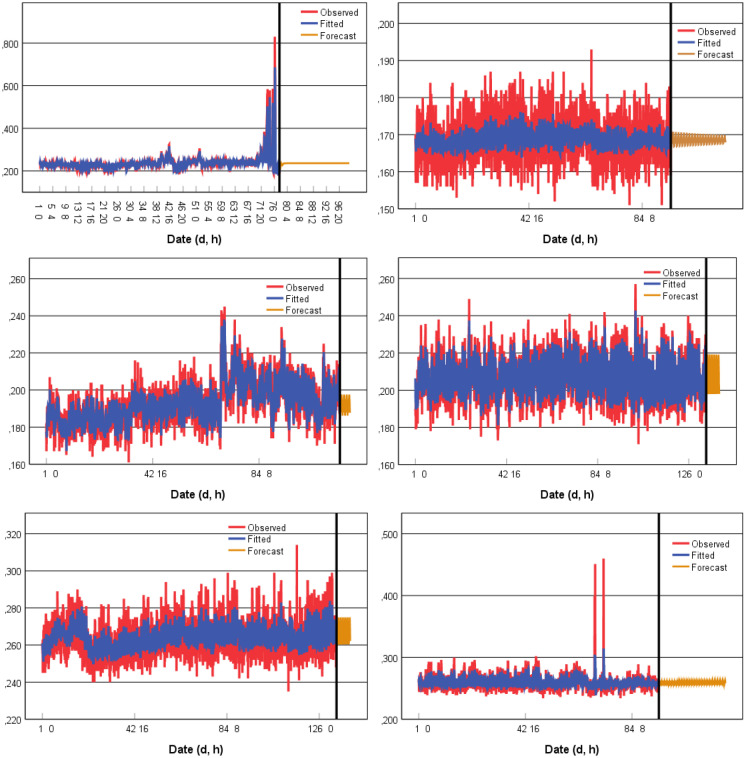
This work is a follow-up study on the exposure to indoor radon levels in Portuguese thermal spas. The previous research involved 16 thermal spas, where radon measurements in air and thermal mineral water were performed twice a year, from 2012 to 2016. These studies revealed concerning radon concentrations both in air and water. Therefore, a follow-up study on long-term radon measurements was conducted to estimate the year-round average radon exposure. The closer the long-term measurement is to 365 days, the more representative it will be of annual average radon levels. Continuous measurements over 1 year for the indoor radon levels are now presented for three of the 16 previously studied thermal spas, together with a time-series analysis of the gamma dose rates registered within the facilities of these thermal spas (TS). An attempt to identify possible patterns in the variation of gamma dose rates was made. Hourly gamma dose rates were modelled and forecasted using the Box-Jenkins seasonal time series models (SARIMA). The results showed that between December 2018 and November 2019, the indoor radon concentration varied from 202 to 1941 Bq/m3 (TS1), from 52 to 191 Bq/m3 (TS2), and from 937 to 1750 Bq/m3 (TS3). Approximately 60% of the obtained values for radon concentration in the indoor air exceed the reference level of 300 Bq/m3. Gamma dose rates were continuously measured with GAMMA SCOUT® detectors for hourly readings (µSv/h) between 83 and 229 days. On average, the results are similar in all considered locations and range between 0.169 and 0.264 µSv/h, although variations are different in winter and summer. The calculated effective doses ranged between 3.49 and 18.65 mSv/year (TS1), between 1.37 and 2.53 mSv/year (TS2), and between 13.89 and 22.97 mSv/year (TS3). For occupational exposure purposes, workers would be classified as category A in nine locations (out of 20), as the exposure is liable to exceed an effective dose of 6 mSv/year. For the time-series analysis, the obtained models captured the dynamics of the time series data and produced short-term forecasts. Their accuracies have been quantified by minimizing the root mean square error, the mean absolute error due to the actual forecast, and the mean absolute scaled error. The current results corroborate the conclusions of previous research and give continuous data on occupational exposure to radon for three Portuguese thermal spas. For TS1 and TS3, the indoor radon levels are much higher than the reference level. Under this circumstance, mitigation measures must be implemented to reduce the radon levels accordingly with the Euratom Directive 2013/59 and the Decree-Law No. 108/2018. In general, the gamma dose rates were below 1 μSv/h and, therefore, the contribution to the annual effective dose is not significant. Nevertheless, the variation of the gamma dose rates showed a coherent behavior with the radon progeny build up in closed spaces, as when the considered facilities were closed for certain periods. The time series analysis made it possible to fit some models to the gamma dose rate variation, and although the produced models cannot forecast exact gamma dose rates, they can provide valuable information to build sound planning and decision-making strategies in occupational exposure.
Keywords: Effective dose; Gamma dose; Model; Occupational exposure; Radon; Time-series analysis.
© 2022. The Author(s).
Conflict of interest statement
The authors declare that they have no known competing financial interests or personal relationships that could have appeared to influence the work reported in this paper.
Figures

Similar articles
-
Evaluation of radon gas concentration in indoor air of spas and in spring water in the central Anatolia region of Turkey.Radiat Environ Biophys. 2022 Nov;61(4):609-614. doi: 10.1007/s00411-022-00992-4. Epub 2022 Sep 16. Radiat Environ Biophys. 2022. PMID: 36112230
-
EFFECTIVE DOSES DUE TO OUTDOOR AND INDOOR RADON AT A MEDITERRANEAN SITE.Radiat Prot Dosimetry. 2019 Dec 31;187(2):215-219. doi: 10.1093/rpd/ncz155. Radiat Prot Dosimetry. 2019. PMID: 31165887
-
First radon measurements and occupational exposure assessments in underground geodynamic laboratory the Polish Academy of Sciences Space Research Centre in Książ Castle (SW Poland).J Environ Radioact. 2016 Dec;165:253-269. doi: 10.1016/j.jenvrad.2016.10.010. Epub 2016 Nov 1. J Environ Radioact. 2016. PMID: 27814500
-
Residential and occupational exposure to indoor radon and associated human health risk in Nigeria buildings assessed by multiple monitoring techniques.Sci Total Environ. 2025 Jun 15;981:179478. doi: 10.1016/j.scitotenv.2025.179478. Epub 2025 May 6. Sci Total Environ. 2025. PMID: 40334468 Review.
-
A Review of Radon Exposure in Non-uranium Mines-Estimation of Potential Radon Exposure in Canadian Mines.Health Phys. 2023 Apr 1;124(4):244-256. doi: 10.1097/HP.0000000000001661. Epub 2023 Jan 5. Health Phys. 2023. PMID: 36607249 Free PMC article. Review.
Cited by
-
State-of-the-Art Review on Removal of Naturally Occurring Radioactive Materials in Water.Int J Environ Res Public Health. 2025 May 2;22(5):727. doi: 10.3390/ijerph22050727. Int J Environ Res Public Health. 2025. PMID: 40427843 Free PMC article. Review.
-
Assessment of indoor radon distribution and seasonal variation within the Kpando Municipality of Volta Region, Ghana.PLoS One. 2024 Feb 27;19(2):e0299072. doi: 10.1371/journal.pone.0299072. eCollection 2024. PLoS One. 2024. PMID: 38412163 Free PMC article.
-
An overview on the relationship between residential radon and lung cancer: what we know and future research.Clin Transl Oncol. 2023 Dec;25(12):3357-3368. doi: 10.1007/s12094-023-03308-0. Epub 2023 Aug 23. Clin Transl Oncol. 2023. PMID: 37610496 Free PMC article. Review.
-
Radon Exposure Assessment in Occupational and Environmental Settings: An Overview of Instruments and Methods.Sensors (Basel). 2024 May 7;24(10):2966. doi: 10.3390/s24102966. Sensors (Basel). 2024. PMID: 38793821 Free PMC article. Review.
References
-
- Alali AE, Al-Shboul KF, Yaseen QB, Alaroud A. Assessment of radon concentrations and exposure doses in dwellings surrounding a high capacity gas turbine power station using passive measurements and dispersion modelling. J of Environ Radioact. 2019;196:9–14. doi: 10.1016/j.jenvrad.2018.10.001. - DOI - PubMed
-
- Allab, M. (2019). Preliminary study of effect of environmental parameter variations on indoor radon concentrations in Mediterranean climate. International Journal of Low Radiation, 11(2).
-
- Box GEP, Jenkins G. Time series analysis: Forecasting and control. Holden-Day; 1970.
MeSH terms
Substances
LinkOut - more resources
Full Text Sources
Medical
